 |
 |
 |
 |


Basic Map Data
*** Back to Desktop Mapping Information for Resource Managers ***There are four basic categories of geographic data:
Mapping data comes in dozens of different formats, projections,
scales and file compression schemes. For a brief explanation of
the types of data you are likely to encounter, the Help
Desk at GeoCommunity is a great reference. See the Links
page for a summary of digital mapping data sources. Click
the graphics below for more information.
Images
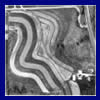
Aerial photographs are the starting point for many mapping projects.
Digital aerial photos are called Digital Orthophotos (DOP)
or Digital Orthographic Quarter Quads (DOQQ). One
of the most common sources of free DOP data in the United States
is the Microsoft TerraServer. See the 2D
Maps page for instructions about downloading TerraServer images
for use as base maps. Free digital aerial photographs might be available
through your state conservation agency, county or other local sources.
DOP and DOQQ files (which are usually distributed on CDs due to
their size) can be purchased from a number of the vendors listed
in Links.
Lines, Points
and Areas
|
 |
Geographic data described with mathematical formulae (with beginning and ending points, length and area) is known as vector data or Digital Line Graph (DLG) data. It takes up a lot less file space than image (or raster) data. DLGs for roads, streams, land surveys, etc. can be viewed without any background image or placed over the top of aerial photos and other images. One of the advantages of DLG vector format information is that it can be resized without any loss of clarity, whereas raster (or image) data becomes pixilated if enlarged too much. |
| USGS DLG data comes in large scale (1:24,000, corresponding to 7.5 minute USGS topographic maps), intermediate scale (1:100,000) and small scale (1:2,000,000). They vary in the amount of detail presented. See Links for sources. |
 |
If you want to map your own thematic information (like the forest cover types on the left), programs in the Toolbox can help you create vector lines, points or areas. Mapping programs have unique vector file formats for storing object information (like size, color, line width, etc.). Shapefiles (*.shp), for example, are used by ESRI ArcView® software and many other products. Other common vector types are DRA (Map Maker), OCD (OCAD), MIF/MID (MapInfo), DXF (AutoDesk), AI (Adobe Illustrator), etc. Some file formats are definitely "smarter" than others, including additional information such as geospatial locations, the map projection used and links to databases. |
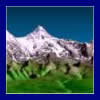
Elevations
A Digital Elevation Model (DEM) contains an array (or
grid) of numbers recording the height of ground positions at regularly
spaced horizontal intervals. The heights can be represented by a wire
frame or colors like the next two examples below. Computer software
can use a DEM to create 3D images of a landscape, applying lighting
effects that reveal hills and valleys. 2D aerial photos or satellite
images can be overlaid on a DEM to create a "virtual
reality" view.
|
|
There are a number of different types of DEMs, but the most commonly used in the United States are those produced by the USGS. They are available in 10 and 30 meter resolution sets, at various scales. Click the image to the left for more information. |
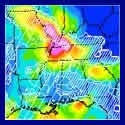
 |
Another type of fascinating DEM produced by the Space Shuttle Radar Topography Mission (SRTM) is available from NASA. Click the image to the left to see an example of a SRTM elevation model combined with a Landsat 7 satellite image. |
 |
Laser pulses from aircraft and satellites can also be used to model Earth's surface. The evolving technology is called LIDAR (Light Detection and Ranging). LIDAR flown in aircraft can produce 3D images of not only the terrain, but tree and shrub vegetation, buildings and other structures by precisely measuring the time it takes for the reflected pulses to return. Space-based LIDAR is being used to model and analyze Earth's atmosphere. |
See the Links page for sources of free DEM downloads.
Spatial Databases
 |
A Geographic Information System (GIS) goes beyond cartography to find answers to geospatial questions. GIS is the mechanism for visualizing spatial data related to the Earth's surface. For example, where do tornadoes occur most frequently? Which habitat types have the highest deer populations? Where are the oldest pine forests with the highest risk of pest damage? For an example of GIS in action, visit the National Oceanic & Atmospheric Administration (NOAA) Atmospheric Modeling and Mapping Internet site. For more information about geospatial analysis, visit GIS.com. |
Where to begin?
Exploration is one the best ways to learn about the treasure
of geographic data that is available. See the
Links page for sources of digital mapping data. For software
to look at data or to make your own maps, see the Digital Grove
Toolbox. You might also want to try some of the on-line mapping
sites like National
Geographic's Map Machine, the US
National Park Service or those at the Geography
Network.
*** Back to Desktop Mapping Information for Resource Managers ***

