There are many useful
programs available on the Internet for making maps. Trying to learn
the capabilities of each can be time consuming. A few basic software
tools, however, will get you started with digital cartography. The
products listed here are available free. A few may offer additional
features after payment of a registration fee.
|
2D and 3D Mapping Software
|
Map Viewers and Utilities
|
|
|
|
|
|
|
|
|
|
|
|
|
|
|
|
|
|
|
|
|
|
|
|
|
|
|
|
|
|
|
|
|
|
|
|
|
|
|
|
|
|
GPS Tools
|
|
|
|
|
|
|
|
|
|
|
|
|
|
|
|
|
|
2D and 3D Spatial Mapping Software
|
 |
Forestry
GIS (fGIS™) is a remarkable, free GIS digitizer
and shapefile editing program and GIS viewer for Windows®
from the University of Wisconsin and Wisconsin DNR - Division
of Forestry. It provides complete mapping functionality similar
to commercial programs costing hundreds or thousands of dollars.
The software is designed for resource managers who want to easily
make land planning and operations maps with minimal training. |
| The program is ideal for tracing over aerial
photographs and other images. fGIS opens geo-referenced digital
orthophotos and topographic maps in MrSID®, ECW, BIL, JPG,
TIFF, GeoTIFF, BMP and PNG file formats. It saves point, line
and area vector data in ESRI® shapefile format. Advanced
map drawing features include snap, split and a COGO-like traverse
tool. A shapefile projection utility within fGIS converts data
between Geographic, Wisconsin Transverse Mercator, and UTM coordinate
systems. The program can load very large data layers and gives
complete control over display properties. Users can designate
the scale at which maps are printed. A page layout module provides
design and annotation tools that can be applied to fGIS map
images.
For details and to download the program, see the fGIS
page.
|
|
|
Global
Mapper® is a versatile program, designed to simplify
digital mapping and make spatial technology accessible to
everyone.
|
|
As a free viewer for geographic data, Global Mapper opens
most image and vector map files. Global Mapper seamlessly
integrates data layers even if projections or scales vary.
Open your first layer in the desired projection, and additional
layers from other projections will be converted to align with
the first "on the fly". Users can change the view
by choosing layers to display, turning 3D hill shading on
or off, modifying the color scheme, adjusting line width and
color, selecting point symbols and other techniques. Global
Mapper can measure areas and distances, and it generates a
constant readout of the latitude/longitude coordinates of
the cursor. With version 5, Global Mapper goes further by
adding image rectification and the ability to draw and edit
your own map objects. (When using the free version of Global
Mapper, you can save images of maps you draw with a screen
capture program.)
With payment of a small registration fee, Global Mapper performs
an amazing suite of additional functions. The registered program
saves your work and easily translates data files between formats
and projections. It can save images with geo-referencing so
they can be accurately placed in other mapping programs, create
and save elevation contour lines, determine what terrain can
be seen from a given vantage point, and much more.
Visit Global
Mapper or USGS
to download the program or to view a full list of its features.
(The USGS version of Global Mapper is distributed under the
name dlgv32Pro.)
|
|
|
 |
USAPhotoMaps™
automatically retrieves and displays TerraServer aerial photos
or topographic maps. It is one of the fastest tools available
to collect TerraServer image tiles for base maps of any size.
Use USAPhotoMaps to quickly get latitude, longitude or UTM coordinates
for any position. GPS waypoints, routes and tracks can be displayed
as map overlays and transferred to or from GPS units. |
|
A companion program, BigJPEG, will assemble downloaded images
into single, georeferenced base maps that can be opened by
geospatial programs or drawing programs.
USAPhotoMaps, BigJPEG and a utility to display elevations
in USAPhotoMaps are available for free download from JDMCox
Software.
For more information and instruction for using USAMaps™
and BigJPEG, click
here.
|
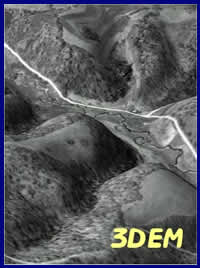 |
3DEM™
produces three dimensional terrain scenes from 2D images ...great
for analyzing fire control, erosion, aesthetic management and
other resource issues. The program can provide high-resolution
3D views using many elevation model sources, including new data
from the Space Shuttle Radar Topography Mission. Create animated
flights through virtual terrains of real places. Connect with
Garmin or Magellan Global Positioning System (GPS) receivers
to display waypoints, routes, and tracks in 3D or generate elevation
profiles of GPS tracks.
 |
Use aerial photos, topographic maps, screen
captures, scanned photos, Landsat images or other source
material for 3DEM projects. Rotate and scale terrains
to fashion the view you want. 3DEM is relatively simple
to learn and a terrific tool for virtual modeling of the
Earth's surface. Find instructions in 3D
Maps page. |
|
| MARPLOT
is designed for viewing and making maps derived from US Census
TIGER® line data. Both the MARPLOT
program and the TIGER
basemaps are available for free download. The program and
data are produced by the US Census Bureau, US Environmental
Protection Agency and National Oceanic and Atmospheric Administration.
The TIGER derived basemaps have predefined display properties,
making them easy to load and navigate. MARPLOT also features
a utility to import ESRI® shapefiles in UTM, Geographic
(lat/lon) and Albers projections. A layer control center allows
you to determine at what scale features or their labels and
symbols appear in the map. User layers can be created for
new point, line and area objects. Objects' lengths and areas/perimeters
are automatically saved. Typical line, polygon and text drawing
tools are included, but more advanced features such as snap
or COGO functions are not.
|
 |
Aerial photographs and other scanned images can be used as
basemaps in MARPLOT. The program offers two methods to geo-reference
images. The first involves providing the latitude and longitude
for two points on the image. The second allows users to dynamically
drag and stretch an image until it corresponds with loaded
vector data. Very nice! (Click the image on the left for a
screenshot.)
You can print maps made in MARPLOT or export image or vector
(enhanced metafile) files. The exported files are not, however,
georeferenced for use in other GIS programs.
|
  |
Map
Maker Gratis™ and Map Maker Pro™ are produced
in the United Kingdom and used around the world by foresters,
farmers, soil conservationists, biologists and other resource
managers who have found Map Maker practical to teach themselves.
The 257 page manual is a valuable cartography and GIS instruction
source.
Map creation, editing, printing, compatibility, import and export
features in the free version of Map Maker Gratis include:
- Vector drawing and editing
- Unlimited number of image and vector
layers
- Create from new or import and edit
- Measure areas and distances
- Intuitive cutting and joining of
polygons
- Simple editing of common boundaries
- Numerous "snap-to" options
- Drag, stretch, rotate, duplicate
groups of objects
- Create buffer zones around an object
- Calibrate raster images
- Generate legends
- Color, monochrome and grayscale bitmap
backgrounds
- Large range of fill, line and symbol
styles
- Translucent and semi-translucent
fills
|
- Curved, stretched and outline text
- Arrows and dimension lines
- Add scale bars, north points, legends,
text panels, inset images, etc.
- Include text and charts from MS Word
- Query data associated with map objects
(sample to the right)
- Point-and-click to pop-up images,
documents and internet links
- Print accurately scaled maps on Windows
compatible printers
- Multi-sheet printing of large maps
- Thematic maps from DBF data
- Import ArcView SHP, MapInfo MIF and
AutoCAD DXF vector data
- View BMP, TIF and JPG raster data
- Export BMP, JPG and TIF image files
- Export attribute data to DBF
- Share your maps and a copy of the
free Map Maker Gratis software with others
|
A complete table comparing Gratis and Map Maker Pro is
available at Map
Maker LTD.
Map Maker Gratis works well with images and vector data from
many coordinate systems. For trouble-free map creation, however,
take care that all the data you intend to combine in a project
base map has the same projection/datum
structure. Gratis will automatically position GeoTiff
image files if they are in the same projection as vector data
used in your base maps.
When you download the Map Maker program, you get both the
Gratis and Pro versions. Map Maker Pro (which has many more
exceptional capabilities, including 3D mapping) runs in a
free trial mode for 30 days, after which it will continue
to operate with no restrictions in the Gratis mode.
For more information about innovative GIS alternatives (including
Map Maker Pro, Manifold System Professional and Delorme XMap),
see Digital Grove's GIS
Software Overview.
|
|
|
 |
OCAD®,
a Computer Assisted Cartography program originally designed
for making maps for orienteering courses, is made by Steinegger
Software of Baar, Switzerland. Orienteering is a competitive
sport that combines running, cycling, skiing, etc. to points
on specialized
maps. OCAD is one of the simplest and most enjoyable programs
you will find for making professional-looking 2D maps for any
purpose. |
|
OCAD lets you start with a clean page or add in an aerial
photo or other image as a base template. If you use GeoTIFF
images for the template, OCAD version 8 will automatically
import them to scale. Other images can be scaled manually,
allowing measurement of areas and distances.
OCAD works with a rich set of fills, lines and point symbols.
The program comes with five pre-defined symbol sets, and you
can create new ones. Map objects with the same attributes
are placed in discrete layers for easy editing.
The OCAD version 8 free trial is full-featured but limited
to 1,000 map objects (more than enough to make a resource
map for most medium-sized tracts). Version 6, released as
freeware, is complete but unable to make geospatial measurements.
(The registered, professional version of OCAD 8 adds GIS database
functionality and the ability to export to ESRI shape files.)
|
Data and Surface Mapping Software
|
 |
Surfer®
from Golden Software creates contour, surface, wire frame, vector,
shaded relief and other types of 3D surface maps. Its output
can be striking. The free trial version allows you to examine
your own data. Printing, saving and clipboard functions are
disabled. Digital Grove's instructions for getting started with
Surfer are available here.
|
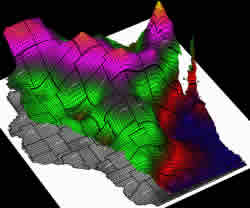 |
3DField
is a contouring, surface plotting and 3D data program. All facets
of 2D or 3D maps can be customized to produce stunning depictions
of your data. Click the image on the left, showing a 3D distribution
of family-owned woodlands in Wisconsin, for a full-screen example.
The developer provides a free, fully-functional demo that
is limited to 50 data points (enough to help you experiment
and appreciate the power of the program). 3DField provides
eleven 2D and 3D map templates that can be precisely tailored,
scaled and rotated for incredible views. Click
here for step-by-step procedures used in the project on the
left, made with the free trial.
|
| 3DField is the product of 15 years of refinement by Vladimir
Galouchko, the Russian developer. See the 3DField
web site for complete details. |
 |
SurGe
is another intriguing program that grids and maps data. The
developer, Miroslav Dressler, is a hydrologic engineer in the
Czech Republic. The software is fully functional at no cost,
with an invitation to register for a small fee. Download
the program for free.
Surge produces three basic types of maps: color contours (left),
isolines, and 3D maps. Click the image on the left for additional
examples. The program offers numerous data interpolation and
smoothing routines and includes detailed documentation that
explains the mathematical principles involved. |
| Data is input with simple ASCII text files that define the
x-y position of each point, z (the data value) and a label field.
Used in tandem with other free software (such as fGIS), one
can easily generate text files for the creation of boundaries
(like the outline of Wisconsin) or the position of data points.
For
a tutorial, click here. |
|
|
 |
Natural
Resources Database (NRDB) bridges tabular statistics
with spatial data (points, lines and areas) to create thematic
maps. As an example, the NRDB tutorial illustration to the
left shows the annual rainfall of municipalities in a province
as different colors. Use NRDB to:
- Design and store databases for either spatial or non-spatial
information
- Import records from Excel, Access and other ODBC compliant
formats and associate them with spatial data
- Utilize map objects made with other mapping and GIS programs,
downloaded from the Internet, or created with an included
digitizing utility (which geo-references scanned or downloaded
maps and aerial photos that you can trace over to make shapefiles)
- Produce reports and graphs from database queries or generate
thematic maps from records linked to spatial data
|
| Richard D. Alexander, of the U.K., originally produced NRDB
for the Philippine Province of Bohol and now offers the free
program to encourage sustainable management of resources around
the world. His vision for NRDB, FAQs and other useful information
are available at the NRDB
User Group.
Although NRDB can draw map geometry through its digitizing
utility "Image to Shapefile", NRDB's primary strength
is thematic mapping utilizing existing spatial data. Mr. Alexander
recently launched NRDB View, an open source shapefile viewer
and editor that will provide additional map drawing capabilities
as it evolves. If you are a programmer, you might consider
helping with the NRDB
View project.
|
 |
The free DIVA-GIS software is designed
to plot data and perform statistical analysis of spatial data
distributions. The program converts tabular data into point
shapefiles and plots them with other GIS layers. ESRI® shapefile,
grid, TIFF, JPEG and Lizardtech® MrSID file types are supported.
|
Additional features offered by DIVA-GIS include:
- An image layout module where maps can be annotated
- Grid manipulation (calculator, aggregate, neighborhoods)
- Conversion of lat/lon data to other projections
- Export/import of grid and shapefile data
- Statistical analysis tools such as histograms and scattergrams
to highlight data correlation
- Multiple regression with grids
- Display of satellite images or digital orthophotos as
basemaps
- Geo-positioning of unreferenced basemap images
- GPS data import (as points, lines, or polygons)
- Climate envelope modeling
- Prediction of crop adaptation (Ecocrop
- ...and more
To download the program, data and tutorials, visit the DIVA-GIS
web page.
|
Non-Spatial Map Drawing Software
|
| |
|
 |
Tekhnelogos
PowerDraw: Tekhnelogos is a software company in Istanbul,
Turkey. They released freeware PowerDraw to demonstrate the
strength of PowerCad, their Delphi/Visual Basic programming
application. PowerDraw is, itself, an exceptional vector drawing
program well suited to drawing maps or annotating aerial photographs
or maps produced in other programs such as fGIS. |
With PowerDraw, you can:
- Draw and edit line, polyline, rectangle, polygon, bezier,
circle, ellipse, arc, pie, chord and text objects
- Use a variety of pens and area fills
- Create text objects with any font installed in the system
- Drag and drop vector symbols from block libraries you
can build and edit
- Manipulate images (scale, flip, mirror, rotate, and a
unique tool to trim a bitmap based on a vector shape)
- Add OLE objects
- Insert WMF/EMF files as editable objects
- Export the drawing as WMF file or BMP
- Save the project or send it to a printer or plotter
Tekhnelogos held nothing back in building PowerDraw (complete
with no restrictions or limitations) to showcase what can
be created with the PowerCad programming application. You
can download the PowerDraw installation setup from Tekhnelogos.
If you are a software developer, you might also want to get
the free PowerCad
trial.
|
 |
Zoner
Draw 3® is a free graphics program to use with either
vector or bitmap images. It has three modules. The Media Explorer
quickly builds thumbnail views of all the graphic files found
in a folder (an easy way to browse the maps you've made or downloaded).
Right-click a thumbnail view to display it in the Zoner Viewer,
which will complete all the typical adjustments such as brightness,
contrast, sharpness and user-specified rotation. The main Zoner
Draw program is an agile vector-drawing system. Use it to make
maps by tracing over digital orthophotos from TerraServer or
other sources. The transparency of the base map image can be
adjusted so it doesn't compete with the vector overlays you
create. Zoner Draw 3 will export your graphics to over ten different
raster and vector formats. |
| Maps produced with Zoner Draw do
not contain any spatial data. As a result, you cannot measure
areas or distances directly in Zoner Draw. If your image has
an associated "world coordinate file" (e.g., ending
in "tfw" for a calibrated TIFF file or "jpw"
for a calibrated JPEG file) you can, however, still open it
in spatial mapping programs like Global Mapper or fGIS even
after making adjustments/additions in Zoner Draw as long as
the image has not been resized or rotated.
In combination with other free software, you can use the
Zoner Viewer to convert a JPEG image made by USAPhotoMaps/BigJPEG
into a GeoTIFF file. (Map Maker Gratis and 3DEM will correctly
scale and position GeoTIFF layers automatically.)
| 1. Use Zoner Viewer to open a JPEG aerial
photo made by USAPhotoMaps-BigJPEG. Tune up the contrast-brightness-sharpness
to suit your needs. (If you wish, you can also add text,
lines or symbols in Zoner Draw.) |
|
|
2. Convert the image to a TIFF format file with Zoner
Viewer's "Convert" tool.
3. Use Properties Plus to rename the image's "jgw"
world coordinate file so it has a "tfw" extension.
|
| 4. Use another free utility called GeoTIFF
Examiner to change the paired TIFF and "tfw"
files into a single GeoTIFF file. GeoTIFF Examiner will
write the world coordinate calibration into the header
of the TIFF file. (Note: Do not create the GeoTIFF file
until you are done making adjustments with Zoner.) |
 is
a dynamite commercial upgrade. (USAPhotoMaps and other shadowed
text logos on this page were designed with Zoner
4.) For other map drawing options, check out AutoREALM
(below). is
a dynamite commercial upgrade. (USAPhotoMaps and other shadowed
text logos on this page were designed with Zoner
4.) For other map drawing options, check out AutoREALM
(below).
|
|
|
AutoREALM™
is a free GNU,
open source mapping program. It's a vector drawing program designed
specifically for making maps. Most operations like selecting
line types and mapping symbols or drawing areas are uncomplicated.
AutoRealm can load raster images (like aerial photos from TerraServer,
USGS topo maps or screen captures from Global Mapper) as backgrounds
over which you can trace features, add symbols or write text.
|
AutoRealm works well for making stand-alone resource management
maps that are not part of a geospatial framework. Since the
program is also used to create maps for role-playing games,
it has some unusual symbol libraries specific for gaming. You
can make maps that might appear to come straight from Tolkien's
Hobbit or more formal, technical map drawings. The choice is
yours. Depending on the purpose, stylized maps can be informative
and interesting.
The program can export image and vector files for use in other
programs. Although images in AutoRealm are not geo-referenced,
complementary mapping programs like Map Maker Gratis, 3DEM or
OziExplorer can register the images if you know the latitude/longitude
of a couple points on the map. |
 |
Drawing programs can take advantage of mapping
symbol fonts (like those to the left) that are freely available
on the Internet. One of the advantages of trying free viewers
from professional GIS companies (like ESRI, ERDAS, MapInfo,
MapTech, etc.) is that they install many of their symbol fonts
into your Windows font folder, giving you the opportunity to
explore them.
|
|