
forestandrange.org home || learning options || further assistance
Lesson 8: LMS Inventory Wizard
Review and Introduction
In earlier lessons, you learned how to establish and take measurements in sample plots. You also downloaded and installed a computer program called the Landscape Management System (LMS), and selected a growth model appropriate for your location. The next step is to begin entering your inventory data into the LMS Inventory Wizard.
As you work through this lesson, you may wish to download and print the following free Washington State University Extension publication as a reference: Inventory Wizard: A new tool that makes it easy to get started with the Landscape Management System (http://cru84.cahe.wsu.edu/cgi-bin/pubs/EB1983.html).
Learning Objectives:
By the end of this lesson, you will be able to:
- Enter your inventory (stand and tree) data into the LMS Inventory Wizard
- Use the Inventory Wizard to create an LMS portfolio
Materials Needed:
- Windows®-based computer1
- LMS software (installed in Lesson 7)
- Completed stand and plot data recording sheets (completed in previous lessons)
- Inventory Wizard Extension publication (optional)
I. Getting Started with the Inventory Wizard
The Inventory Wizard starts in the Main Menu (Figure 8-1). Recall from Lesson 7 that the Getting Started button will bring up the Getting Started menu with several options. The first option is the Tutorial, which is recommended to help you further familiarize yourself with the program. The Growth Model Selection Guide and Field Inventory Forms that you used in previous lessons are also on the Getting Started menu.
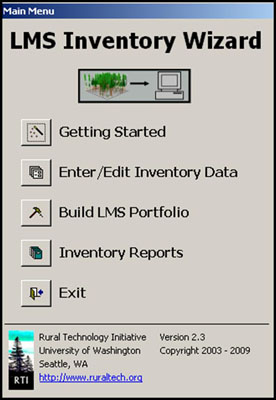 |
| Figure 8-1: The main menu of the LMS Inventory Wizard. |
To begin entering your inventory data, click the Enter/Edit Portfolio Data button on the Inventory Wizard Main Menu to open the select portfolio dialog box (Figure 8-2). Existing portfolios can be selected here, or a new portfolio can be created by clicking the New button. Your new portfolio should be given a name (do not include spaces in the name), and the appropriate growth model (that you identified in Lesson 7) should be selected. Clicking the Select button will then open the data entry form.
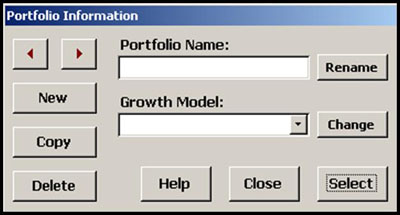 |
| Figure 8-2: The select portfolio dialog box allows you to create and browse your portfolios. After giving your new portfolio a name and selecting a growth model, click the Select button to enter or edit the portfolio data. |
II. Entering Stand Data
On the data entry form (Figure 8-3), stand-level data should be entered first on the left side of the form. This includes the stand name (no spaces) and acreage that you determined back in Lesson 1, as well as information like site index that you recorded in Lesson 7. If you have multiple stands on your property, you can add additional stands and browse between them using the New button and the arrow buttons next to the Stand Name field. Different growth models use different types of stand-level data, so your data entry form may look slightly different than Figure 8-3. To guide you through each field, a message with more information about the field will appear at the bottom of the screen when that field is clicked.
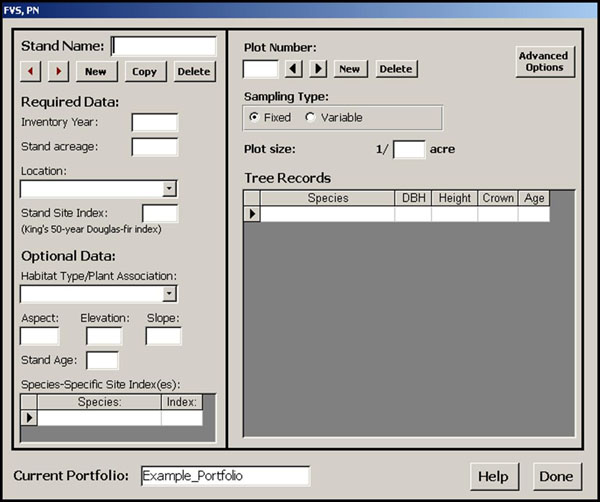 |
| Figure 8-3: In the data entry form, enter stand data on the left and plot data on the right. |
III. Entering Inventory Data
Plot and tree record data are entered on the right side of the data entry form (Figure 8-3). Select the sampling type by toggling the options shown (fixed plot or variable plot). The form will then ask for either the plot size for fixed plots or the BAF for variable radius plots. The Advanced Options button will reveal additional options that are not covered by these lessons.
Once the plot characteristics are entered, the tree measurements for that plot can be added. Species is selected from a drop-down menu, while DBH (in inches), Height (in feet), Live Crown Ratio (as a decimal), and Breast Height Age are entered directly into their respective fields. Species and DBH are required for each tree, while height, live crown ratio, and age are optional (Lesson 6).
When you are done entering data for a plot, you can add another plot by clicking New under Plot Number at the top of the form. You can browse between plots using the arrows under Plot Number. Likewise, when you are done entering all plots for a stand, you can add another stand by clicking New under Stand Name in the upper left corner of the form and use those arrows to browse between stands.
When all stand, plot, and tree data have been entered, clicking the Done button at the bottom of the form will return the user to the Main Menu. Users can go back to add or modify the data at any time by clicking the Enter/Edit Portfolio Data button on the Main Menu and selecting the desired portfolio.
IV. Building an LMS Portfolio
When you finish entering your inventory data for all your plots and stands, click the Build LMS Portfolio button on the Inventory Wizard’s Main Menu (Figure 8-1). This will open the Build LMS Portfolio dialog box (Figure 8-4). Select your portfolio from the drop-down menu. Then select whether you want the growth model to grow the trees in 5- or 10-year increments (called Step Size) – selecting 5 years will give you the most flexibility when running LMS. For new users, we recommend the Log Sort Table be left at its default value.2 Enter your name as the portfolio Author (and your organization if you wish). Clicking OK will create the portfolio and return you to the Main Menu, where you can Exit the Inventory Wizard and begin working with LMS.
Once you have finished and exited the Inventory Wizard, start the LMS program (version 2). From the main window in LMS, go to File: Open Portfolio (Figure 8-5). The open portfolio dialog should default to a directory (folder) on your computer called lmsfolio2, where the LMS program stores portfolio files (usually C:\lmsfolio2). Find and open the folder for the portfolio you just created. (Note: if when opening you get an error that something cannot be found, try clicking “close and check”).
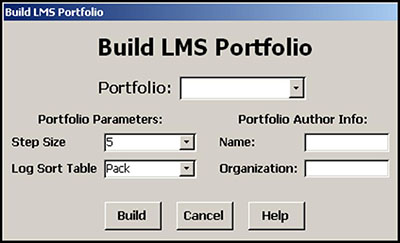 |
| Figure 8-4: Use the Build LMS Portfolio dialog box to finish creating your LMS portfolio. |
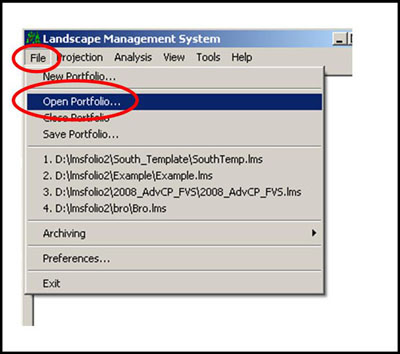 |
| Figure 8-5: Opening an LMS Portfolio. |
Notice that there are now items listed in the main LMS window—these are your stands. The LMS portfolio should have your inventory information for each of the stands listed.
Important: When opening your portfolio for the first time, you will need to go to Tools: Portfolio: Rebuild Inventory (Figure 8-6). This will allow the growth model to estimate heights and crown ratios for any trees you did not collect this data for. You only have to do this step once—you do not need to repeat it when opening the portfolio on subsequent occasions.
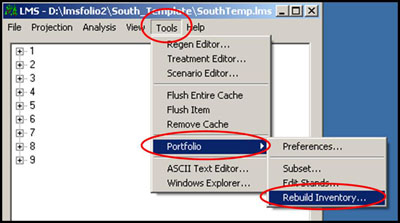 |
| Figure 8-6: When you open a portfolio for the first time in LMS, you will need to rebuild the inventory. |
|
Next Steps:
- There is no quiz for this lesson.
- Go to the Next Lesson.
1LMS will work with Windows 98 and later, including Vista. It is not compatible with other operating systems (Macintosh, Linux, etc.). For more information on system requirements, visit http://lms.cfr.washington.edu/
2Advanced users can explore log sort tables in LMS later on their own with the help of the LMS tutorials and help files.