
forestandrange.org home || learning options || further assistance
Lesson 1: Mapping Your Forest
Introduction
When conducting a forest inventory, the first step is to get the “big picture” view of your forest. Obtaining a good aerial image will help lay the foundation for your inventory project. The image will help you to delineate forest stands and other important features.
Learning Objectives:
By the end of this lesson, you should be able to:
- Obtain an aerial image of your property
- Divide your forest into individual stands
- Determine the area of each stand
Materials Needed:
- Computer with internet access and a printer (if you do not own a computer, try the ones available at your local library)
- Pencils and/or pens (several different colors may help)
- Ruler
- Calculator (recommended)
- Acreage measuring grid (recommended)
- Graph/grid paper (optional)
I. Create a basic map of your forest
The best way to get the big picture view of your forest is to start with an aerial image of your property. There are several potential sources of aerial images:
- One of the best sources for aerial images is your local county. Your county government may have images available online for free download and printing through the assessor’s office, planning department, or similar department. Contact your local county government for information on availability.
- Your state department of forestry or natural resources (or equivalent department) may have this available. Contact the relevant department for your state for information on availability.
- Several internet-mapping sites can provide you with aerial images of your property that you can download and print for free. Coverage is limited in many rural areas, though. Here are some commonly used websites:
- Google Maps (http://maps.google.com/) gives you the option of searching for an address and viewing satellite imagery.
- Google Earth (http://earth.google.com/) is a free tool you can download that can show you printable images of a given address/location.
- Microsoft Live Maps (http://maps.live.com/) is similar to Google Maps, allowing you to search for an address and view/print an aerial image.
- Microsoft Virtual Earth (http://www.microsoft.com/VirtualEarth/) is a free tool similar to Google Earth that you can download to show printable images of a given address/location.
- Terra Server (http://terraserver-usa.com/default.aspx) is another free site that you can use to search for your location and see what aerial images are available.
- Another source you can utilize for aerial images is the USDA-Natural Resource Conservation Service’s (NRCS) Web Soil Survey (http://websoilsurvey.nrcs.usda.gov/app/) . This system is primarily designed to provide soil maps of your property, but it also offers aerial image overlays. Having the soil map in addition will yield further benefits as you conduct your inventory, so this free site is worth exploring.
Whatever the source, a key to successfully working with an aerial image is that the scale must be large enough to allow you to distinguish geographic features (roads and ponds, etc.) and to observe texture (and hopefully color) differences in the forest.
|
II. Identify Stands
A forest is made up of individual stands. A stand is a distinct, recognizable unit of the forest. A stand is identified by what you see. Often age or tree species composition will differentiate different stands. An area of hardwoods would be considered a different stand than an area of conifers. Similarly, an area of 80-year-old trees would similarly be considered a different stand than an area of newly planted trees.Identifying stands is a subjective process, and different people may look at the same forest and identify different stand boundaries. For instance, consider a mixed conifer stand forest with a small pocket of hardwoods in the middle. Is the pocket of hardwoods a separate stand, or is it incorporated as part of a larger, mixed-species stand? These questions often come down to personal preference. Are you a “lumper” or a “splitter”? What is the smallest area that you would consider a distinct stand? It may be helpful to think of stands as areas that you could manage independently. In the case of the pocket of hardwoods in an otherwise coniferous stand, is the pocket large enough to support its own harvesting operation? If yes, you might consider this a separate stand. If not, it might be better incorporated as part of the larger, surrounding stand.
To figure out where different stands are in your forest, it is important to look at aerial images as well as walking your forest to examine it at the ground level. Start at a known location within your forest, such as near the house or a pond, or at the property line or corner. Look for areas on the ground with similar tree species composition, similar tree ages, etc. What areas of the forest look the same, and what areas look different? Correspond these areas to different colors, shades, and textures on the aerial image to get a bird’s eye layout of the stands on your property.
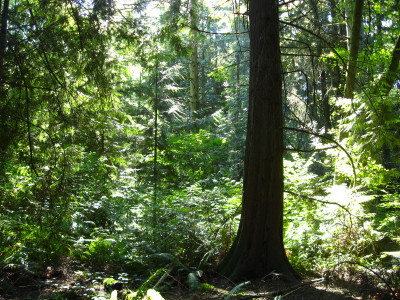
Figure 1-1 illustrates the differences that you may notice between different stands. The boundary between these two areas was first identified on an aerial photo based on significant differences in color and texture. An on-the-ground visit confirmed that the vegetation in these two areas is very different—one area had dense, coniferous vegetation with no understory, while the other was a mixed species stand with a diverse understory. These areas would likely be managed differently, so they were identified as two different stands.
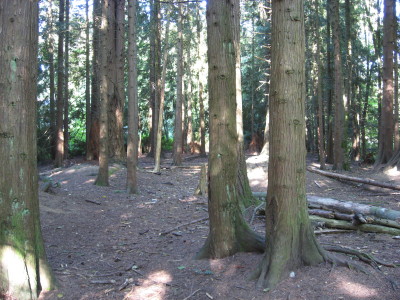 |
Figure 1-1: Based on an aerial photo, two distinct areas were identified that may be indicative of different stands. An on-the-ground visit found that the areas are quite different and, more importantly, are likely to be managed differently. The area shown on the left had dense, coniferous vegetation with no understory, while the area shown on the right was a mixed species stand with a diverse understory. Based on these differences, these areas were identified as being different stands. |
 |
![]()
Watch a video clip of verifying stand boundaries in the field
Figure 1-2 shows the end result once stands have been identified. Stand boundaries have been drawn on the aerial photo, which can now serve as a stand map. Notice the difference in both color and texture between the different stands. Stand 3 is the dense, pure conifer stand shown on the top in Figure 1-1, whereas Stand 2 is the more diverse, mixed stand shown on the bottom in Figure 1-1. The ‘X’ marked in the upper left denotes the location of the video clip above.
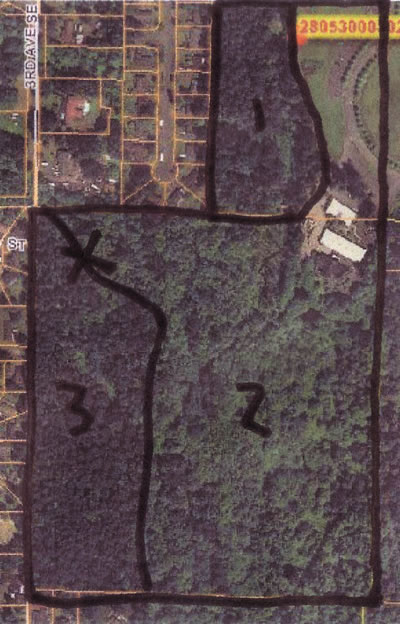 |
Figure 1-2: Map of a forest divided into 3 different stands. The different stands were identified based on differences in color and texture in the photo. These differences were verified by an on-the-ground examination, as shown in the video clip above. |
Once you have identified your stands, give each one a name to identify it. Some people simply number their stands. Others give descriptive names, such as “5-year-old loblolly pine plantation.” Others may name a stand after a specific feature or something of personal significance, such as “Billy’s hillside stand” or “family picnic area stand.” It is possible that your property incorporates only one stand, especially if your property is small. Large properties may have many different stands.
Looking at the aerial image that you created in Step One, see if you can identify potential stand boundaries. Walk your forest to help you confirm their location. Draw the stand boundaries on your map and give each stand a name of your choosing. |
III. Determine the acreage of each stand in your forest
It will be helpful to estimate the acreage of the stands in your forest. This does not need to be exact—a reasonable estimate should work fine for our purposes (there are, however, applications such as a timber sale in which precise measurements of acreage, such as those done by a professional forester or survey, will be required).
Visual acreage estimation
You may be able to estimate acreage visually just by looking at your map. For example, if your property is 10 acres and you have two stands that each comprise approximately half of the property, you would estimate each stand to be 5 acres. Similarly if you know the acreage of a given stand (for instance, one that was recently harvested), you could visually estimate the acreage for the other stands. This is the easiest but least precise way to determine acreage.
Using an acreage measuring grid
Another approach is to use an acreage measuring grid or area scale. This is a grid or series of evenly spaced dots, often printed on clear plastic. These grids are available from forestry supply merchants. You can also make your own using a piece of graph/grid paper.
Professional acreage grids usually have a key relating the grid squares or dots to acreage given a certain scale of map/photo. If your map/photo fits the pre-defined scale(s) on the acreage grid, you can overlay the grid on your map/photo, count the squares or dots that cover each stand, and use the key to calculate acreage.
It is likely that in many cases your map/photo will not fit the defined scale of the acreage grid. In this case you can do a calculation to determine how much area the dots or squares on the grid represent given your particular map/photo scale. Figure 1-3 shows an acreage grid with dots overlaid on an aerial photo of a stand. According to the acreage grid, each dot represents 1/10th (0.1) acre if the photo scale is 1” = 660’. However, the scale of this particular aerial photo is 1” = 300’, so a calculation is needed.
Below is how to set up the calculation. Note that the photo scales are squared to convert from units of length to units of area.
[Your photo scale]2 x [Acreage defined on grid] / [photo scale defined on grid]2
Using this equation for the example in Figure 1-3:
3002 x 0.1 / 6602 = 0.02, or 1/50th acre.
Now that the grid has been converted to the photo scale, the next step is to count the dots that fall within the drawn boundaries of the stand. There are approximately 477 dots within the stand boundary in Figure 1-3. 477 dots multiplied by 0.02 acres per dot yields approximately 9.5 acres.
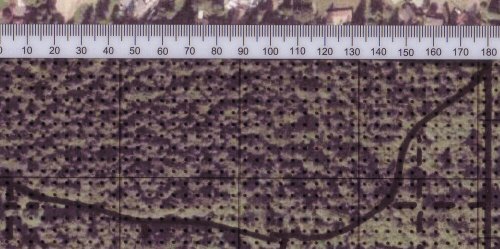 |
Figure 1-3: An acreage grid is overlaid on an aerial photo of a stand. Approximately 477 dots fall within the stand. Given the scale of the photo, it was determined that each dot represents approximately 0.02 acres, yielding a total of 9.5 acres for the stand (477 x 0.02). |
Other ways to determine acreage
There are other techniques that can also be used to determine acreage, such as the use of a handheld global positioning system (GPS) device. Contact your Local Extension Forester for more information.
Using your map with the stand boundaries drawn in, estimate the area of each stand using one of the procedures described above. Make a record of the acreage of each of your stands |
Next Steps:
- Test your knowledge by taking a Short Quiz.
- Go to the Next Lesson.