Economic Analysis
Owner Classes
Another attribute central to the database is the type of owner for each property. The type of owner affects forest management style, which in turn affects their economics and conversion risk. The owner class was determined by examining the owner name for each parcel, comparing it to a categorized, exhaustive list of names, and placing the parcel into a category. The owner class can be: Government, Corporate, Tribal, Conservation, Other Private.
- Government: An owner class field describing whether or not a parcel has Government ownership.
- Corporate: An owner class field describing whether or not a parcel has corporate ownership.
- Tribal: An owner class field describing whether or not a parcel has Tribal ownership.
- Conservation: An owner class field describing whether or not a parcel has conservation ownership.
- Other Private: An owner class field describing whether or not a parcel is Private ownership, but not one of the above categories.
Management Types
Through previous studies performed by the Rural Technology Initiative, it has been shown that industrial and small forest landowners (SFLO) manage their forests differently (Lippke, et al. 2007). In order to accurately model the economics (Internal Rate of Return and Forest Value) of each forest parcel, the management method needs to be known.
There are two separate concepts of what defines a small forest landowner, one based on productivity, and one based on ownership size. Washington State created a definition in RCW 76.09.450, which is based on productivity of the owner. The database attribute WA_TYPE is used to represent this definition of small forest landowner.
The term Non‐Industrial Private Forestland (NIPF) is often used interchangeably with small forest land owner and is based on ownership size. There is not a single definition for this confusing term. There are two Forest Service Definitions. Smith et al. define nonindustrial private as, "An ownership class of private lands where the owner does not operate wood‐using plants"(Smith, et al. 2003). Gray et al. define forest industry lands as, "Lands owned by companies that grow timber for industrial use. Includes companies both with and without wood processing plants," and other private lands as, “private lands not owned by forest industry. Native American lands, farmer‐owned lands, and miscellaneous private lands are included”(Gray, Veneklase and Rhodes 2005). In Washington State, before the Salmon Recovery Act defined the term small forest landowner, nonindustrial forests and woodlands were defined as, "suburban acreages and rural lands supporting or capable of supporting trees and other flora and fauna associated with a forest ecosystem, comprised of total individual land ownerships of less than five thousand acres and not directly associated with wood processing or handling facilities," in RCW 76.13.010. Finally, in Washington Department of Natural Resource Timber Harvest Reports through the year 2002, private land owners were broken down into two categories Private Large, and Private Small. Private Small was defined as, "Non‐industrial companies and individuals not operating wood‐using plants and having statewide holdings totaling less than 1,000 acres,"(Washington State Timber Harvest Reports 2009). However, the Washington Department of Revenue, the source of the Timber Harvest Report data, has now moved to using the term Small Harvester, which is defined as, "A harvester who harvests timber from privately or publicly owned forest land in an amount not exceeding two million board feet in a calendar year" in both WAC 458‐40‐610 and RCW 84.33.035.
Currently, no reliable method exists to determine which owners harvest less than two million board feet in a calendar year. The Washington State Department of Revenue does collect information on “Small Harvesters” which is self reported by timber harvesters however the Revenue database cannot be directly linked to parcels in the Forestland Database. A proxy for the 2 million board foot harvest limitation was developed to identify SFLO ownerships based on acreage and location in the state.
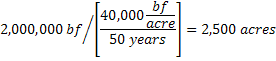
Using yield curves2, modeled stocking densities, and volume equations on the Westside an estimated 40 thousand board feet (Mbf) per acre can be harvested on a 50 year cycle (the average modeled rotation length for both industrial and SFLO lands) on site III ground. Harvest restrictions due to buffers were assumed to be 20% of the landscape. Using Westside growth curves (McArdle, Meyer and Bruce 1949) for high site III ground yields were assumed to be 50 Mbf per acre in 50 years, only 80% of which is harvestable.
On the Eastside an estimated 4 thousand board feet per acre can be harvested on a 20 year cutting cycle on site IV ground. This assumes a 45% volume removal and corresponds to a 75+ year understory regeneration scenario producing 9 MBF.
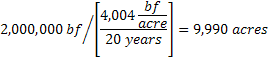
Using these growth and harvest assumptions for Westside and Eastside forests acreage proxies for the Washington State small forest landowner 2 million board foot definitions were set at 2,500 and 9,990 acres respectively.
The Washington State Forestland Database is primarily interested in identifying small forest landowner parcels using the State SFLO definition. However an attempt to identify NIPF parcels was also made. Because of the lack of clarity about the definition of NIPF, the database uses the RCW 76.13.010 definition of, "total individual land ownerships of less than five thousand acres and not directly associated with wood processing or handling facilities". The database attribute WA_NIPF is used to represent this definition of small forest landowner.

Washington Small Forest Land Owner
This forestland management type uses an acreage proxy for the Washington State Small Forest Landowner (SFLO) definition as defined in RCW 76.09.450 (harvesting no more than an average of 2 million board feet of timber per year). While the Forestland Database has parcels down to 1 acre in size, the Database’s SFLO definition requires the smallest properties to be at least 2 acres in size (tract acres) with a minimum of 1 acre of forest cover. Parcels with forested land uses as defined by county assessors were classified as SFLO up to the acreage limits regardless of minimum size cutoffs (land uses 87, 88, 92 and 95, see Appendix F: Land Use Codes in the Washington State Forestland Database).
Values: SFLO, Industrial, Tribal SFLO, or NULL.
- SFLO: A parcel that meets the Washington State Small Forest Landowner definition as defined in RCW 76.09.450 (harvesting no more than an average of 2 million board feet of timber per year). This is estimated by determining the number of acres in management an owner would need to meet this level of productivity. On the west side of the state, an owner would need 2500 acres, and on the eastside 9990 acres. A parcel whose owner owns less than 2500 acres on the west side of the state, or a parcel whose owner owns less than 9990 acres on the east side of the state would qualify. The parcel owner must also be non‐corporate and non‐government.
- INDUSTRIAL: A parcel that does not meet the Washington State Small Forest Landowner definition as defined in RCW 76.09.450 (harvesting no more than an average of 2 million board feet of timber per year). This is estimated by determining the number of acres in management an owner would need to meet this level of productivity. On the west side of the state, an owner would need 2500 acres, and on the eastside 9990 acres. A parcel whose owner owns at least 2500 acres on the west side of the state, or a parcel whose owner owns at least 9990 acres on the east side of the state would qualify. The parcel owner must also be corporate and non‐government.
- TRIBAL_SFLO: A parcel that meets the Washington State Small Forest Landowner definition as defined in RCW 76.09.450 (harvesting no more than an average of 2 million board feet of timber per year). This is estimated by determining the number of acres in management an owner would need to meet this level of productivity. On the west side of the state, an owner would need 2500 acres, and on the eastside 9990 acres. A parcel whose owner owns less than 2500 acres on the west side of the state, or a parcel whose owner owns less than 9990 acres on the east side of the state would qualify. The parcel owner must also be tribal, non‐corporate, and non‐government.
Washington NonIndustrial Private Forest Land Owner
The management type using the NIPF definition, "total individual land ownerships of less than 5000 acres and not directly associated with wood processing or handling facilities".
Values: NIPF, Industrial, or Null.
- NIPF: A parcel that meets NIPF definition, "total individual land ownerships of less than 5000 acres and not directly associated with wood processing or handling facilities", and does not have a corporate or government owner.
- INDUSTRIAL: A parcel that does not meet the NIPF definition, "total individual land ownerships of less than 5000 acres and not directly associated with wood processing or handling facilities", meaning the parcel owner owns more than 5000 acres in the State. The parcel also has a corporate owner, and is non‐government.
Modeling forest growth
Growth simulations were preformed to represent forested lands in the state of Washington. Five site classes were used for eastern and western Washington. In addition two general ownership classes were simulated (Industrial and Non‐Industrial Private). Each of the site class and ownership class simulations was then matched to parcel information on the state landscape.
Each ownership class/site class also had separate simulations to represent the different forest activities allowed in the buffers of Forest and Fish. Initial simulations assumed a maximum removal as allowed by the Forest and Fish rules.
Modeling Assumptions and Details
The FVS growth model was used for all simulations. Western Washington simulations were run using the Pacific Northwest Coast variant of FVS and used the Olympic NF equations (FVS location code 609) and an elevation of 300 feet. All stands were modeling with the same location parameters except for the variation is site index. Maximum SDI values were reduced to 600 (from the default of 950) according to the maximum value suggested for Douglas‐for by (Long, McCarter and Jack 1988) and (Reineke 1933).
Westside Simulations
The Table 5 shows the site index, SDI Max and rotation length for each ownership site class for Western Washington. The rotation lengths and intermediate treatments represent a management intensity level associated with each site class.
Table 5: Site index, SDI Max, and rotation length for site class and ownership in Western Washington.
| |
Owner Class |
Site Class |
|
SDI Max |
Rotation |
 |
Industrial |
S1 |
145 |
600 |
35 |
S2 |
125 |
600 |
40 |
S3 |
105 |
600 |
45 |
S4 |
85 |
600 |
45 |
S5 |
65 |
600 |
50 |
NIPF |
S1 |
135 |
600 |
45 |
S2 |
115 |
600 |
50 |
S3 |
100 |
600 |
55 |
S4 |
80 |
600 |
60 |
S5 |
60 |
600 |
65 |
For each site class and ownership 5 separate simulations were run for upland stands and each buffer zone according to Forest and Fish rules. A simplified description of the harvest options by buffer is presented in Table 6.
Table 6: Simplified harvest by buffer zone for western Washington.
Riparian/Wetland
Management Zone |
Treatment |
| Upland |
Site/owner class specific scenario |
| Core |
No harvest |
| Inner |
Leave > 57 TPA, thin from below, regeneration simulated |
| Outer |
Leave 20 TPA > 12, regeneration simulated |
| Wetland |
Leave 75 TPA > 6, regeneration simulated |
Each site class and ownership also has a unique scenario and combination of treatments designed to represent different management intensities across the site and ownership classes. These are summarized in Table 7. The Industrial S1 management intensity represents management that includes improved stock and no thinning treatments on a short rotation. Industrial S2 and S3 contain a single commercial thinning. Only the NIPF S2 management intensity includes a commercial thinning.
Table 7: Site/owner class scenarios for western Washington.
| Owner Class |
Rotation |
Regeneration4
(TPA DF) |
Intermediate Treatments |
Final Harvest |
| Industrial S1 |
35 |
590 |
None |
Leave 5 TPA @ 35 |
| Industrial S2 |
40 |
590 |
PCT to 275 TPA @ 15 |
Leave 5 TPA @ 40 |
| Industrial S3 |
45 |
590 |
PCT to 275 TPA @ 15 |
Leave 5 TPA @ 45 |
| Industrial S4 |
45 |
590 |
None |
Leave 5 TPA @ 45 |
| Industrial S5 |
50 |
590 |
None |
Leave 5 TPA @ 50 |
| NIPF S1 |
45 |
590 |
PCT to 275 TPA @ 15 |
Leave 5 TPA @ 45 |
| NIPF S2 |
50 |
590 |
None |
Leave 5 TPA @ 50 |
| NIPF S3 |
55 |
590 |
None |
Leave 5 TPA @ 55 |
| NIPF S4 |
60 |
590 |
None |
Leave 5 TPA @ 60 |
| NIPF S5 |
65 |
590 |
None |
Leave 5 TPA @ 65 |
Eastside Simulations
Eastern Washington was divided into three zones that were as defined in the WA Forest Practices Rules: Ponderosa Pine type (0‐2500 ft), Mixed conifer type (2501‐5000 ft), and high elevation type (>5000 ft). Each zone was represented by a different species: Ponderosa pine type = PP; Mixed conifer type = DF; and high elevation type = LP.
Table 8: Site index, SDI Max, and rotation length for site class and ownerships in Eastern Washington.
| Zone |
Owner Class |
Site Class |
Site Index5 |
SDI Max |
Rotation |
 |
Industrial |
S1 |
130 |
600 |
75 |
| S2 |
120 |
600 |
75 |
| S3 |
110 |
600 |
75 |
| S4 |
100 |
600 |
75 |
| S5 |
90 |
600 |
75 |
NIPF |
S1 |
120 |
600 |
75 |
| S2 |
110 |
600 |
75 |
| S3 |
100 |
600 |
75 |
| S4 |
90 |
600 |
75 |
| S5 |
80 |
600 |
75 |
 |
Industrial |
S1 |
110 |
600 |
75 |
| S2 |
100 |
600 |
75 |
| S3 |
90 |
600 |
75 |
| S4 |
80 |
600 |
75 |
| S5 |
70 |
600 |
75 |
NIPF |
S1 |
100 |
600 |
75 |
| S2 |
90 |
600 |
75 |
| S3 |
80 |
600 |
75 |
| S4 |
70 |
600 |
75 |
| S5 |
60 |
600 |
75 |
 |
Industrial |
S1 |
90 |
700 |
65 |
| S2 |
80 |
700 |
65 |
| S3 |
70 |
700 |
65 |
| S4 |
60 |
700 |
65 |
| S5 |
50 |
700 |
65 |
NIPF |
S1 |
80 |
700 |
75 |
| S2 |
70 |
700 |
75 |
| S3 |
60 |
700 |
75 |
| S4 |
50 |
700 |
75 |
| S5 |
40 |
700 |
75 |
The eastern Washington simulations were run using the East Cascades variant of FVS and used different locations for each of the three zones simulated: PP (Wenatchee ‐ 617), DF (Okanogan ‐ 608), and LP (Okanogan ‐ 608). Table 8 presents the site index, SDI Max, and rotation length for the site classes and ownerships in Eastern Washington.
For zone, each site class, and ownership 5 separate simulations were run for upland stands and each buffer zone according to Forest and Fish rules. A simplified description of the harvest options by buffer is presented in Table 9.
Table 9: Simplified harvest by buffer zone for eastern Washington.
Riparian/Wetland
Management
Zone |
Zone |
Criteria |
Treatment |
| Upland |
|
|
Site/owner class specific scenario |
| Core |
|
|
No harvest |
| Inner |
PP |
BA > 110 |
Leave 50 TPA > 10 |
| BA < 60 and TPA >100 |
Leave 100 TPA > 6 |
| Otherwise |
Leave 100 TPA |
DF |
BA > 150, 130, 110 |
Leave 50 TPA > 10 |
| BA < 150 and TPA > 120 |
Leave 120 TPA > 6 |
| Otherwise |
Leave 100 TPA |
LP |
|
Leave 58 TPA > 12 |
| Outer |
PP |
|
Leave 10 TPA, regen 400 PP |
DF |
|
Leave 15 TPA, regen 400 DF |
LP |
|
Leave 20 TPA, regen 400 LP |
| Wetland |
PP |
|
Leave 75 TPA > 4, regen 200 PP |
DF |
|
Leave 75 TPA > 4, regen 200 DF |
LP |
|
Leave 75 TPA > 4, regen 200 LP |
Table 10 presents the scenarios used for even‐aged management in Eastern Washington.
Table 10: Site/owner class scenarios for eastern Washington.
| |
Owner Class |
Rotation |
Regeneration6
(TPA DF) |
Intermediate Treatments |
Final Harvest |
 |
Industrial S1 |
75 |
400 |
Leave 250 TPA @ 25 |
Leave 5 TPA @ 75 |
| |
|
Leave 175 TPA @ 50 |
|
| Industrial S2 |
75 |
400 |
Leave 250 TPA @ 25 |
Leave 5 TPA @ 75 |
| |
|
Leave 175 TPA @ 50 |
|
| Industrial S3 |
75 |
400 |
Leave 175 TPA @ 50 |
Leave 5 TPA @ 75 |
| Industrial S4 |
75 |
400 |
Leave 175 TPA @ 50 |
Leave 5 TPA @ 75 |
| Industrial S5 |
75 |
400 |
Leave 175 TPA @ 50 |
Leave 5 TPA @ 75 |
| NIPF S1 |
75 |
400 |
Leave 175 TPA @ 50 |
Leave 5 TPA @ 75 |
| NIPF S2 |
75 |
400 |
None |
Leave 5 TPA @ 75 |
| NIPF S3 |
75 |
400 |
None |
Leave 5 TPA @ 75 |
| NIPF S4 |
75 |
400 |
None |
Leave 5 TPA @ 75 |
| NIPF S5 |
75 |
400 |
None |
Leave 5 TPA @ 75 |
 |
Industrial S1 |
75 |
400 |
Leave 175 TPA @ 50 |
Leave 5 TPA @ 75 |
| Industrial S2 |
75 |
400 |
Leave 175 TPA @ 50 |
Leave 5 TPA @ 75 |
| Industrial S3 |
75 |
400 |
Leave 175 TPA @ 50 |
Leave 5 TPA @ 75 |
| Industrial S4 |
75 |
400 |
Leave 175 TPA @ 50 |
Leave 5 TPA @ 75 |
| Industrial S5 |
75 |
400 |
Leave 175 TPA @ 50 |
Leave 5 TPA @ 75 |
| NIPF S1 |
75 |
400 |
Leave 175 TPA @ 50 |
Leave 5 TPA @ 75 |
| NIPF S2 |
75 |
400 |
Leave 175 TPA @ 50 |
Leave 5 TPA @ 75 |
| NIPF S3 |
75 |
400 |
Leave 175 TPA @ 50 |
Leave 5 TPA @ 75 |
| NIPF S4 |
75 |
400 |
Leave 175 TPA @ 50 |
Leave 5 TPA @ 75 |
| NIPF S5 |
75 |
400 |
Leave 175 TPA @ 50 |
Leave 5 TPA @ 75 |
 |
Industrial S1 |
65 |
800 |
None |
Leave 5 TPA @ 65 |
| Industrial S2 |
65 |
800 |
None |
Leave 5 TPA @ 65 |
| Industrial S3 |
65 |
800 |
None |
Leave 5 TPA @ 65 |
| Industrial S4 |
65 |
800 |
None |
Leave 5 TPA @ 65 |
| Industrial S5 |
65 |
800 |
None |
Leave 5 TPA @ 65 |
| NIPF S1 |
65 |
800 |
None |
Leave 5 TPA @ 75 |
| NIPF S2 |
65 |
800 |
None |
Leave 5 TPA @ 75 |
| NIPF S3 |
65 |
800 |
None |
Leave 5 TPA @ 75 |
| NIPF S4 |
65 |
800 |
None |
Leave 5 TPA @ 75 |
| NIPF S5 |
65 |
800 |
None |
Leave 5 TPA @ 75 |
Eastside Uneven aged Simulations
The initial even‐aged simulations for Eastern Washington were felt to be inadequate because they did not represent the types of management that is actually happening. A series of uneven‐aged simulations were developed to address that concern.
A series of simulations were done to investigate an initial starting condition that would results in a somewhat even flow of volume from each upland stand over multiple 20 year cutting cycles. These simulations were started in the past to achieve a mature stand in 2000 for the first 20 year cycle or a limited harvest of a buffer for the PP and Mixed Conifer (DF) zones.
Table 11: Uneven‐aged scenarios for Eastern Washington.
| |
Owner Class |
Regeneration7 (TPA) |
Intermediate Treatments
(2000, 2020
) |
Final Harvest |
|
Industrial S1 |
400 |
Thin to SDI 330 |
Regen 150 TPA |
| Industrial S2 |
400 |
Thin to SDI 300 (2000),330 |
Regen 200 TPA |
| Industrial S3 |
400 |
Thin to SDI 300 (2000), 330 |
Regen 200 TPA |
| Industrial S4 |
400 |
Thin to SDI 330 |
Regen 200 TPA |
| Industrial S5 |
400 |
Thin to SDI 330 |
Regen 200 TPA |
| NIPF S1 |
400 |
Thin to SDI 330 |
Regen 200 TPA |
| NIPF S2 |
400 |
Thin to SDI 330 |
Regen 200 TPA |
| NIPF S3 |
400 |
Thin to SDI 330 |
Regen 200 TPA |
| NIPF S4 |
400 |
Thin to SDI 330 |
Regen 200 TPA |
| NIPF S5 |
400 |
Thin to SDI 330 |
Regen 200 TPA |
 |
Industrial S1 |
400 |
Thin to SDI 330 |
Regen 200 TPA |
| Industrial S2 |
400 |
Thin to SDI 300 |
Regen 200 TPA |
| Industrial S3 |
400 |
Thin to SDI 350-375 |
Regen 200 TPA |
| Industrial S4 |
400 |
Thin to SDI 300 |
Regen 200 TPA |
| Industrial S5 |
400 |
Thin to SDI 300-315 |
Regen 200 TPA |
| NIPF S1 |
400 |
Thin to SDI 330 |
Regen 200 TPA |
| NIPF S2 |
400 |
Thin to SDI 330 |
Regen 200 TPA |
| NIPF S3 |
400 |
Thin to SDI 300-330 |
Regen 200 TPA |
| NIPF S4 |
400 |
Thin to SDI 330 |
Regen 200 TPA |
| NIPF S5 |
400 |
Thin to SDI 330 |
Regen 200 TPA |
The Industrial S2 and S2 management intensities required a slightly heavier thinning in 2000 to balance the volume yields. Several of the Mixed Conifer management intensities (Industrial S3, S5 and NIPF S3) required variation in the thinning intensity to balance the volume yields.
Risk of conversion
Using the parcel‐based Washington State Forest Land Database to extract real estate values, acreages, improvement values and land uses for forested areas in Washington, maps were produced of the privately‐owned areas at highest risk of conversion, based on a series of assumptions on forest growth, management intensity and appraised market values. The base assumption is that parcels with the largest difference between the real estate value (REV) and the working forest value (WFV) are likely candidates for conversion. Working forest value is the sum of the forest value (FV) in the buffers and upland areas. The real estate value (REV) is the market value assigned to each parcel by the county assessor. The forest value (FV) is the land value plus the added economic value of any standing timber (the total economic value of the forest).
The forest value was calculated using five site classes for eastern and western Washington with cost assumptions from the recently produced timber supply study based on owner type (industrial/non‐industrial). Modeled management scenarios within riparian buffers are based on findings from the timber supply study and allocated by owner type since it is known that riparian areas are being managed differently by industrial and non‐industrial owners. Both WFV and REV are calculated and mapped for each parcel, and the output is a map of forested parcels with the differential between WFV and REV normalized to a per acre basis. Parcels with a high REV relative to WFV can be considered likely candidates for conversion whereas parcels with a high WFV relative to REV can be considered unlikely candidates for conversion.
Process
- Calculate all forested acres (_A)
- Forest acres are different than parcel size, since a landowner could have a 100‐acre parcel and only 50‐acres are forested. Forest acres are based on an intersection with forest cover data or as available from assessor land use information.
- Calculated upland acres (UA)
- Calculated acres in riparian management zones (RMA) and wetland management zones (WMA) on forested parcels
- As much is possible, acreage in riparian management zones (RMZ) and wetland management zones (WMZ) were determined as defined in state forest practice rules, Chapter 22‐30, Timber Harvesting.
- Using DNR’s soil site class layer, and stream type (F, S, Np, Ns) or wetland type (A, B) the acreage included in each type of RMZ and WMZ by parcel was calculated.
- There are three riparian management acreages per parcel: core, inner and outer (RMAc, RMAi, and RMAo), and one wetland management acreage: WMA
- Calculate Land Value (SEV)
- This figure, also known as bare land value, land expectation value (LEV), or soil expectation value (SEV), estimates the economic value of the land alone based on its ability to generate income through the production of timber through an infinite number of rotations including planting costs, thinning costs, harvest revenue and administrative costs.
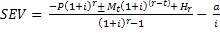 - Where:
- P = planting cost
- Mt
= mid‐rotation cash flow in year t (PCT cost or thinning revenue)
- Hr = net harvest revenue at rotation year r
- a = annual overhead cost
- i = target rate of return (assume 5%)
- Calculate Forest Value (FVx)
- Forest value is land value plus the added economic value of any standing timber (the total economic value of the forest). Since current forest values for each parcel are unknown, assume an average at midpoint of rotation (or immediately post‐harvest for uneven aged stands).
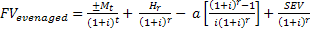
- Where:
- Mt = mid‐rotation cash flow in year t (PCT cost or thinning revenue)
- Hr = net revenue from harvest of existing timber at year r (end of current rotation or cutting cycle)
- c = number of years in the uneven aged cutting cycle
- SEV = bare land value
- a = annual overhead cost
- i = target rate of return
- Forest value is calculated per acre for each combination of site index, owner type, and forest area (upland, buffer)
- Determine Real Estate Value (REV)
- Using Washington State Forest Land Database, determine total market value (real estate value) for each parcel.
- Calculate Working Forest Value (WFV)
- Working forest value is the forest for eac parcel which is the sum of the forest
valuehvalue in the buffers and the uplands

- Where:
- RMAc = core riparian management zone acres
- RMAi = inner riparian management zone acres
- RMAo = outer riparian management zone acres
- WMA = wetland management zone acres
- UA = upland acres
- FVc = forest value per acre in the core riparian management zone
- FVi = forest value per acre in the inner riparian management zone
- FVo = forest value per acre in the outer riparian management zone
- FVw = forest value per acre in the wetland management zone
- FVu = forest value per acre in the upland area
- Calculate conversion risk (CR) as the difference between WFV and REV.
- CR = REV – WFV
Discussion
The use of county assessor appraisal values as a proxy for the market value of forestland is feasible on parcels not in the Designated Forest Land (DFL) tax program. Parcels in the DFL program are not required to be appraised for fair market value and therefore a conversion risk cannot be calculated. A brief attempt was made to correlate market values to physical characteristics of the DFL lands, like proximity to roads, urban growth areas or development however no statistically significant predictors were found. Others have shown that the development of market value predictors from physical characteristics can be done and therefore more work should be done in this area. An attempt was also made to correlate recent sales activity to DFL lands to generate a market value however the sales information was too coarse and had artifacts from multi‐parcel sales that made correlation difficult.
For the non‐DFL lands the calculated conversion risk follows conventional wisdom: smaller parcels closer to urban growth areas, major transportation corridors or high‐amenity areas like the Puget Sound have a much higher risk of conversion compared to larger rural properties.
Results
Tabular/GIS comparison
Purpose
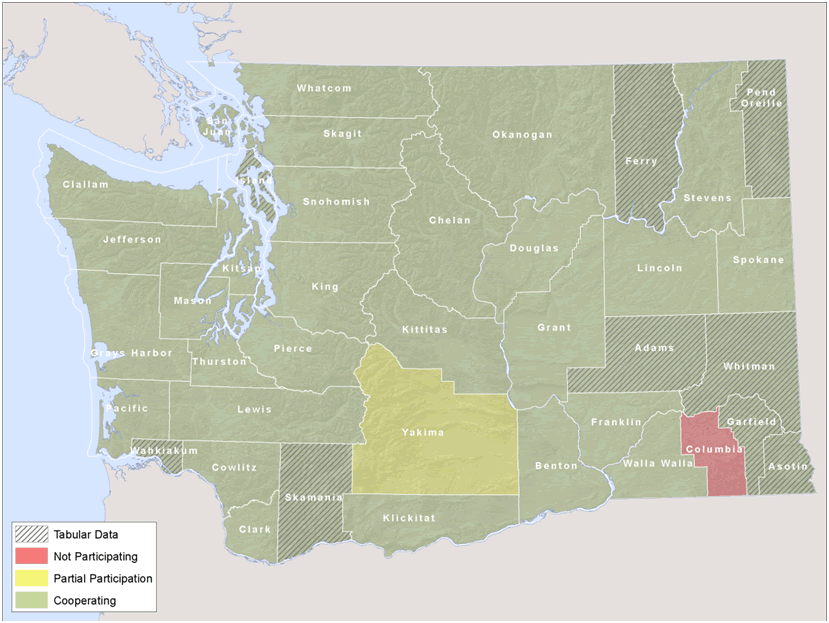
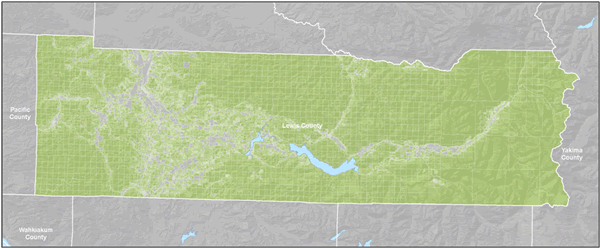
GIS‐based parcel geometry is currently unavailable for 10 of the 39 counties in Washington State (Figure 1). However, nine of these 10 counties have tabular parcel data with a legal description for each parcel. The legal description will place each parcel within a Township, Range and Section in Washington’s Public Land Survey System framework. Each Section is a one mile by one mile square. Using available information, it is possible to place each parcel within one square mile of its actual location even without GIS‐based data.
 |
| Figure 3: Parcel Data Availability for Washington State. |
For this database project, a method was developed to use the acreage and legal description in the Assessor’s data to estimate the location for each parcel when true geometry was unavailable. These estimated locations are referred to from here on as Pseudo‐Parcels. In a worst‐case scenario, a Pseudo‐Parcel could be up to 1.4 miles from its real‐world location. Clearly this introduces complications when attempting to develop attributes for a particular parcel such as distances to certain features, whether or not streams are present, and the amount of Forest Practice stream buffers. It is of interest to know whether or not the spatial inaccuracy inherent in this process has a significant effect on these and other attributes when looking at a larger area, such as an entire county. To this end, a test was undertaken to determine the extent to which using Pseudo‐Parcels affects spatial attributes.
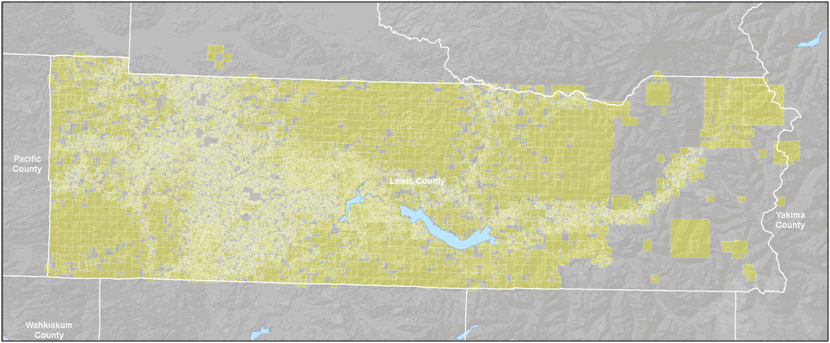
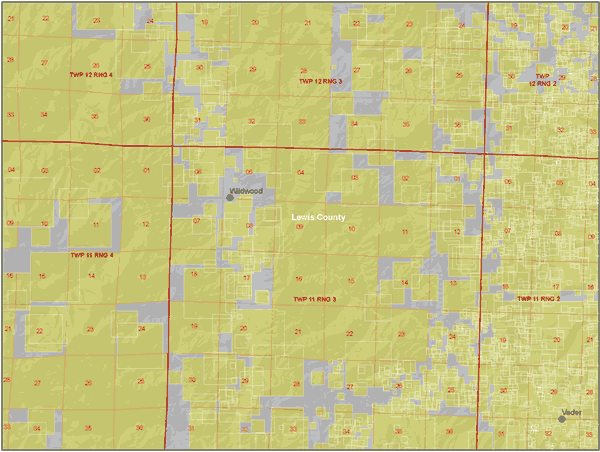
Methods
Lewis County was selected as a sample county for this test because of its large forest area, and the availability of existing GIS parcel geometry. A Pseudo‐Parcel dataset (Figures 3 and 5) was developed using the legal description and acreage information provided by the county. This Pseudo‐Parcel GIS data was compared to the true GIS data (Figures 2 and 4) by performing the spatial analysis on both data sets and calculating statistics.
 |
| Figure 4: GIS Parcels for Lewis County. |
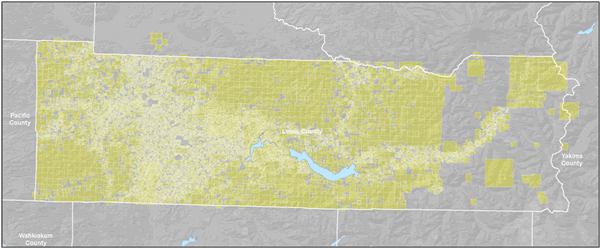 |
| Figure 5: Pseudo‐Parcels for Lewis County. |
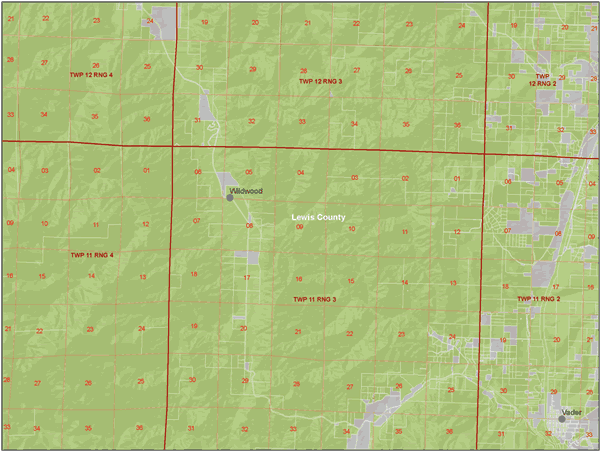 |
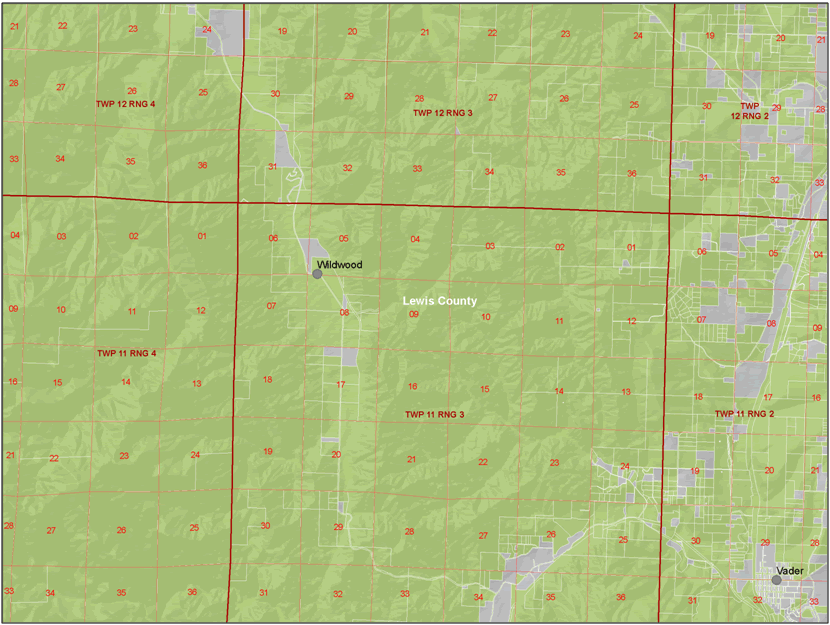
| Figure 6: GIS Parcels around Wildwood and Vader, Lewis County. |
 |
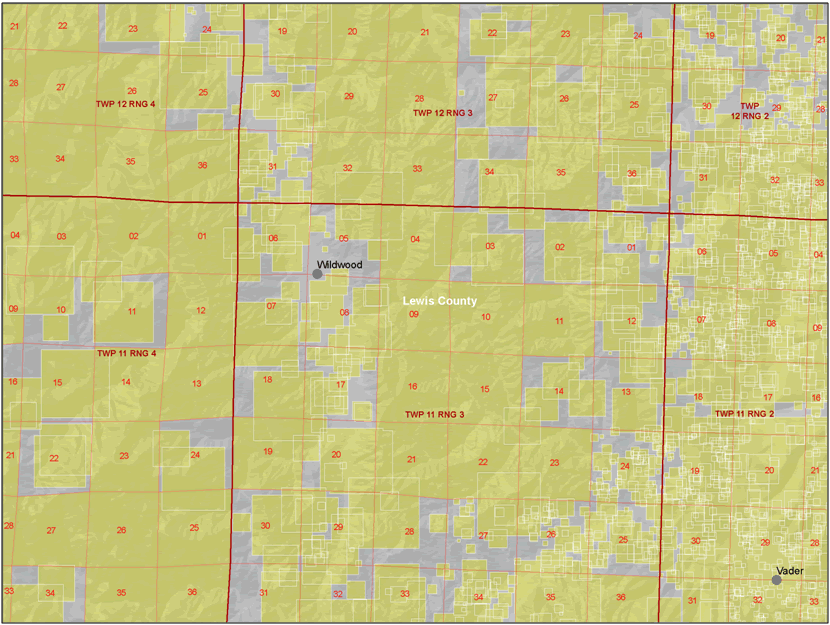
| Figure 7: Pseudo‐Parcels around Wildwood and Vader, Lewis County. |
Results
The first comparison performed on the two parcel datasets was to compare the acreage of each owner class (Corporate, Tribal, Conservation, and Other Private) for the entire county (Table 12). Since these classes are based on the owner names, they should be more or less identical.
Table 12: Acres and Percent of County in Forestland Ownership by Owner Class.
| Acres |
County |
Corporate |
Tribal |
Conservation |
Other private |
Total private |
GIS Parcels
|
1,558,511 |
553,147 (35%) |
198 (0%) |
221 (0%) |
300,382 (19%) |
853,949 (55%) |
Psuedo-Parcels
|
1,558,511 |
597,883 (38%) |
248 (0%) |
248 (0%) |
365,783 (23%) |
964,162 (62%) |
It is immediately obvious, that the acreage of each owner class is not the same for the GIS parcels and the Pseudo‐Parcels. There is an increase of 110,213 total private acres for the Pseudo‐Parcels.
It was realized as a result of this test that the way the Pseudo‐Parcel creation methodology handles missing acreage and legal description values in the Assessor’s data could be improved. The method will be improved in the next version of the database.
It was also realized that this comparison is somewhat inappropriate. By using the County Assessor’s parcel acreage, this comparison is a test of the data quality not a test of the accuracy of the Pseudo‐Parcel creation methodology. It accurately represents the method used for counties without GIS data, but errors in the data provided by the county outweigh differences due to methodology. If the true GIS acres had been used to create the Pseudo‐Parcels for this test, the comparison performed here would have been direct and more appropriate.
A second test compared the acreage of Forest Practice buffers around wetlands and streams (Table 13) for two different management types (Small Forest Land Owners, and Industrial) and for all private parcels for the two parcel datasets. Again the acreages for the Pseudo‐Parcels are larger than those for the GIS Parcels. However, both the Buffer Acres and the Total Parcel Acres are higher for the Pseudo‐Parcels, so the percentage of land in each buffer type is nearly identical between the Pseudo and GIS Parcels.
Table 13: Acres and Percent of Ownership in Buffers by Management Type.
| |
Owner type |
Parcel acres |
Buffer acres |
Core acres |
Inner acres |
Outer acres |
Wetland acres |
 |
SFLO
|
177,443 |
30,200 (17%) |
17,367 (10%) |
6,813 (4%) |
3,365 (2%) |
2,655 (1%) |
Industrial
|
604,026 |
124,757 (21%) |
96,411 (16%) |
17,969 (3%) |
8,361 (1%) |
2,015 (0%) |
All Private
|
781,470 |
154,957 (20%) |
113,778 (15%) |
24,783 (3%) |
11,726 (2%) |
4,670 (1%) |
 |
SFLO
|
324,732 |
55,480 (17%) |
31,346 (10%) |
12,745 (4%) |
6,181 (2%) |
5,208 (2%) |
Industrial
|
639,431 |
132,088 (21%) |
100,176 (16%) |
20,114 (3%) |
9,378 (1%) |
2,419 (0%) |
| All Private |
964,162 |
187,568 (19%) |
131,522 (14%) |
32,859 (3%) |
15,559 (2%) |
7,627 (1%) |
The third comparison made was between the lengths of streams in different Forest Practice Stream classifications in both the Pseudo and GIS parcel datasets. Table 14 presents the total length of all streams in the different classifications for the entirety of Lewis County.
Table 14: Length of Streams in Feet.
| |
Stream length |
Type F length |
Type S length |
Type N length |
Type U length |
| Lewis County |
80,998,624 |
13,902,900 |
4,444,579 |
51,743,207 |
10,907,938 |
Table 15 presents the length and percentage of each stream type that occurs on Small Forest Land Owner Parcels. For example, there are 1,920,545 feet of Type N streams on SFLO GIS Parcels in Lewis County, which means that 18% of Type N streams in Lewis County occur on SFLO ownership in the GIS Parcels dataset.
Table 15: Length of Streams in Feet for SFLO Parcels and Percent of Total.
| |
Stream
length |
Type F
length |
Type S
length |
Type N
length |
Type U
length |
| GIS Parcels |
Acres |
10,812,029 |
3,166,779 |
1,040,320 |
4,684,385 |
1,920,545 |
(%) |
-13% |
-23% |
-23% |
-9% |
-18% |
| Psuedo-Parcels |
Acres |
14,446,145 |
3,851,957 |
1,493,446 |
6,519,663 |
2,581,079 |
(%) |
-18% |
-28% |
-34% |
-13% |
-24% |
Table 16 presents the length and percentage of each stream type that occurs on Industrial Ownership. For example, there are 6,163,523 feet of Type F streams on Industrial Pseudo‐Parcels in Lewis County, which means that 44% of Type F streams in Lewis County occur on Industrial ownership in the Pseudo‐Parcels dataset.
Table 16: Length of Streams in Feet for Industrial Parcels and Percent of Total.
| |
Stream
length |
Type F
length |
Type S
length |
Type N
length |
Type U
length |
| GIS Parcels |
Acres |
43,106,515 |
5,526,150 |
1,633,302 |
30,302,838 |
5,644,226 |
(%) |
-53% |
-40% |
-37% |
-59% |
-52% |
| Psuedo-Parcels |
Acres |
44,684,186 |
6,163,523 |
1,566,970 |
31,141,579 |
5,812,114 |
(%) |
-55% |
-44% |
-35% |
-60% |
-53% |
Table 17 presents the length and percentage of each stream type that occurs on Private Ownership. For example, there are 8,692,928 feet of Type F streams on Private GIS Parcels in Lewis County, which means that 63% of Type F streams in Lewis County occur on Private ownership in the GIS Parcels dataset.
Table 17: Length of Streams in Feet for all Private Parcels and Percent of Total.
| |
Stream
length |
Type F
length |
Type S
length |
Type N
length |
Type U
length |
| GIS Parcels |
Acres |
53,918,544 |
8,692,928 |
2,673,622 |
34,987,223 |
7,564,771 |
(%) |
-67% |
-63% |
-60% |
-68% |
-69% |
| Psuedo-Parcels |
Acres |
59,130,331 |
10,015,481 |
3,060,417 |
37,661,241 |
8,393,193 |
(%) |
-73% |
-72% |
-69% |
-73% |
-77% |
Discussion
The acreage overestimation that occurred when creating Pseudo‐Parcels is understood, and will be addressed in the next version of the database. Since both total acreages and acreages of buffers are overestimated, the relative proportion of these acreages is still valuable, and is very close to the proportions seen in the GIS Parcels.
The acreage overestimation disproportionately affects SFLO ownership. It takes more small parcels to fill an entire square mile section, and it is possible for small parcels to have larger distances between their estimated and true locations within a section. Small parcels tend to occur in urban areas, and SFLO parcels tend to be smaller and closer to urban areas. In Lewis County, the estimated locations for small parcels often placed them outside of their true urban locations and inside of forest cover. The result is that many non‐forest parcels in the GIS Parcels became forested SFLO parcels in the Pseudo‐Parcel dataset. Industrial parcels are typically larger taking up all or high percentages of a section, and are typically located farther from urban areas. Distances between true and estimated parcel locations will be smaller, and there will be less movement from urban to forested locations for Industrial ownerships.
2 Westside assumptions use (King 1966) yield curves for Douglas‐fir (base age 50). Eastside assumptions use (Cochran 1979) yield curves for Douglas‐fir (base age 50); (Barrett 1978) yield curves for Ponderosa pine (base age 100); and (Alexander, Tackle and Dahms 1967) yield curves for Lodgepole pine (base age 100).
3 Westside simulations use (King 1966) site index for Douglas‐fir (base age 50).
4 Regeneration for DF was developed to produce a simulation that was compatible with an unmanaged stand development from the (McArdle, Meyer and Bruce 1949) yield tables. A simulation exercise was done to determine a starting point for the simulation that would track through the yield tables and agree in density, diameter, and volume.
5 Eastside simulations use (Cochran 1979) site index for Douglas-fir (base age 50); (Barrett 1978) site index for Ponderosa pine (base age 100); and (Alexander, Tackle and Dahms 1967) site index for Lodgepole pine (base age 100).
6 Regeneration eastern Washington was set at 400 TPA for each species.
7 Regeneration in Eastern Washington was set at 400 TPA for each species.
|