
forestandrange.org home || learning options || further assistance
Lesson 2: Introduction to Plot Sampling
Review and Introduction
Lesson 1 focused on taking a “big picture” approach and dividing your forest into individual management units called stands. The next step is to inventory the trees in each stand. When conducting your forest inventory, we recommend working with each stand separately. To inventory your trees, it would be unrealistic to measure every tree—even in a small stand. Instead, we do plot sampling. By measuring trees in small areas of the forest, called sample plots, we can extrapolate the sampled information and get information about the forest as a whole.
Learning Objectives:
By the end of this lesson, you will be able to:
- Establish a plan to systematically sample the stands in your forest
- Determine how many plots you want to establish in each stand
- Determine how far apart the plots should be in each stand
- Identify on your map where the plots should be located
Materials Needed:
- The map you created in Lesson 1
- Pencils and/or pens (several different colors may help)
- Ruler
- Calculator (recommended)
I. Systematic sampling
Given that it is impractical to count every tree in a stand, you will be setting up sample plots and making determinations about the entire stand based on these small sample areas. When putting in sample plots, it is very important to be systematic. In other words, you should have a pre-defined set of rules that will determine where sample plots are located. The purpose of a systematic sampling procedure is to avoid sample bias, in which the samples do not accurately represent the stand.
Biased Example 1: Suppose you are trying to determine where to locate sample plots in your stand. You do not want to go deep into the stand because the terrain is steep and difficult to walk on, so you locate all of your plots along a road or trail. This would be a biased sample, because it only includes areas near a road or trail and does not represent the interior of the stand or areas away from forest edges.
Biased Example 2:Suppose you are trying to determine where to locate sample plots in your stand. You know of several key features that are important to you, such as a large, old oak tree or a special area along a stream that you like to visit. You decide to put your plots in these places, so that you can be sure that these special features are included in your inventory. As with the example above, this is not systematic and it will introduce bias into your inventory by over-representing things like large oak trees and under-representing other features of the stand.
Biased Example 3: Suppose you are trying to determine where to locate sample plots in your stand. Parts of the stand are more open than others, allowing for easy access. You decide to locate your plots in these open areas to make it easier to navigate and measure the trees. Again, this is not a systematic approach and would introduce bias by over-representing the more open areas and under-representing the denser areas.
An easy way to set up a systematic sampling procedure is to overlay a grid on your stand map. The intersection of lines on the grid become the locations of your plots. Plots are evenly distributed throughout the stand with this systematic approach. It avoids bias, as the plots fall based on the grid, not based on preferred or convenient locations.
II. How many plots per stand?
The question of how many plots per stand is not as straightforward as it might seem. The more plots you put in, the more accurate your inventory will be, but the more time and effort it will take to make the inventory. There are rules of thumb that can guide you, but ultimately it becomes a question of balancing the labor required with the accuracy desired.
In general, you should put in at least 3 total plots per stand. In smaller stands, this may mean that plots are close together (but they must never overlap). For best results, you should also strive to have, at a minimum, one plot for every 10 acres. For example, if you had a 50-acre stand, this would mean a minimum of 5 plots. You may find that the recommended number of plots for your stand is more than you are willing or able to establish. Just remember that with fewer plots, your inventory may have diminished accuracy.
It is important to consider the uniformity of the stand when determining how many plots you want to establish. If your stand is a young plantation that is very uniform, you might only need to do a minimum number of plots. Conversely, if you have a very diverse stand with a diversity of species, densities, and terrain, you should put in more plots to get a better representation.
Again, there are some general guidelines as to the minimum number of plots you should put in, but it will often be better to put in more than the minimum if you have a large and/or diverse stand. How many more you put in (and whether you even do the suggested minimum) ultimately depends on how much effort you are willing to invest. Just remember that with fewer plots your inventory will not be as accurate of a representation, so treat the inventory data accordingly.
|
III. Determining how far apart plots should be
When setting up your plot grid, you will need to determine how far apart your grid lines should be on the ground. This will depend on the shape, size, and configuration of your stand.
Chains The chain is a somewhat archaic unit of measure that was used for surveying dating back to medieval times. It is still sometimes used today, though, in agriculture, forestry, and other applications. A chain is 66 feet long. There are 80 chains in a mile. An acre is 10 square chains, which corresponds to a rectangular area 1 chain by 10 chains (10 chains is also referred to as a furlong). If you have a 40 acre square property (i.e. a quarter-quarter section), your property would be 20 chains (or 2 furlongs) on each side. |
When laying out your grid, it may be easiest to run the lines in the 4 cardinal directions (i.e. north-south lines and east-west lines). This way, assuming that your aerial photo and map are oriented with north at the top, your lines will then be parallel to the edges of the map or photo (and in-the-woods navigation will be simplest). However, it may be desirable to orientate the grid lines differently to accommodate the unique shape and orientation of your stand. If there is significant slope in your stand, it may also be desirable to run your gridlines perpendicular to the slope to more fully sample the terrain.
You will want to start your grid at an identifiable on-the-ground reference point on the border of the stand. This could be a property corner, bend in a road, road intersection, stream, or other identifiable feature. To avoid having plots right on the edge, you will want your first plot to be a pre-determined distance in from the edge (usually half of the distance between plots) along a grid line and then at regular intervals.
When establishing distances, a unit of measure that is often used in the forest is the chain, which is 66 feet. Both the distance from the edge to the first plot and the interval between plots will depend on the size of your stand. Table 2-1 suggests some distances.
Table 2-1: Suggested distances for establishing plots in different sized stands.
Stand Size |
Distance from edge |
Interval Distance |
2-5 acres |
1 chain (66 feet) |
2 chains (132 feet) |
5-10 acres |
1.5 chains (99 feet) |
3 chains (198 feet) |
Over 10 acres |
2.5 chains (165 feet) |
5 chains (330 feet) |
Note that these distances are only suggestions. Depending on the shape and configuring of your stand and the location of your reference point, you may have to adjust these distances – but once your distances are determined, they must not be changed.
IV. Determining your plot locations
In order to draw distances in chains on your map and/or aerial image, you will need to determine how long these distances are on your map given the scale. You can use the following equation to determine a desired distance on the map:
[Map scale (inches) x desired distance (feet)] / map scale (feet)
Map Scale Example: if your map scale was 1” = 1,000’ and you wanted to know how long on the map 5 chains (5 x 66 = 330’) was, you would compute the following:
[1 x 330] / 1,000 = approx. 0.3 inches
It is important to note the scale of your ruler. Most standard rulers are marked at 1/16th’s inches. If this is the case, you will need to know what a value such as 0.3 inches is in 16th’s of inches. Table 2-2 gives approximate conversions from 10th’s of inches to 16th’s of inches. In this case we see that our example of 0.3 (3/10th’s) inches = 5/16th’s. So you would mark on your map 5-chain intervals every 5/16th’s inches. This procedure can be done for any map scale or number of chains.
Table 2-2: Approximate conversions from 10th’s of inches to 16th’s of inches.
10th’s |
1 |
2 |
3 |
4 |
5 |
6 |
7 |
8 |
9 |
10 |
16th’s |
2 |
3 |
5 |
6 |
8 |
10 |
11 |
13 |
14 |
16 |
Note that for larger stands, laying out your grid may result in more plots than you want or need to put in. For instance, if you have a 60-acre stand, a 5-chain grid should yield somewhere in the neighborhood of 24 plots. If it is a uniform stand, you may wish to do the recommended minimum of 6 plots (1 per 10 acres) or you may wish to do 10, 12, 15, or some other number of plots less than the 24 on your grid. The simplest way to reduce the number of plots is to widen your grid. For the 60-acre example, a 10-chain grid should yield somewhere in the neighborhood of 9 plots.
Example Plot Grid:
Here is an example of laying out a plot grid in a stand that is approximately 23 acres. From the guidelines above, a minimum of 3 plots would be desired for good results, and the recommended distance would be 2.5 chains in from the stand edge for the first plot and 5 chains between plots (Table 2-1). The aerial photo scale states that 1 inch = 100 yards, or 300 feet (Figure 2-1). Using the equation from above, the map distance for 5 chains can be calculated:
[1 x 330] / 300 = approx. 1.1 inches
The ruler used in this example is marked in 16th’s of inches. From Table 2-2, the closest approximation for 0.1 (1/10th) inch is 2/16th’s. This means that the distance between plots on our map should be 1 2/16th’s inches. Half of this distance (2.5 chains) would be 9/16th’s inches.
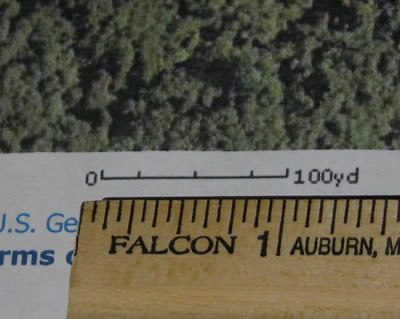 |
| Figure 2-1: The scale of this map is 1 inch = 100 yards (300 feet). |
Figure 2-2 shows one possible plot grid. The reference point (marked with an ‘X’) is approximately 2.5 chains from the eastern edge of the stand. It is located at the corner of a building, which will be easy to find on the ground. Moving south 2.5 chains, the first plot has been located. Subsequent plots (marked as black dots) are established on a 5-chain grid. In this example, 6 plot locations have been identified. Notice how they are systematically distributed through the stand. There are two additional potential plot locations where the grid lines intersect along the northern boundary of the stand. Since these are right on the stand edge, they may not be desirable plot locations.
Figure 2-3 shows another possible plot grid. In this case, the reference point starts at an identifiable corner of the stand. Going 2.5 chains west and then 2.5 chains south, the first plot is established away from both stand edges. Subsequent plots are located on a 5-chain grid. This grid has only 3 non-edge plots. The plots are not as well distributed as they are in Figure 2-2, but there are the recommended minimum of 3 plots and they are systematically distributed. This grid may be more desirable if you wanted to do fewer plots.
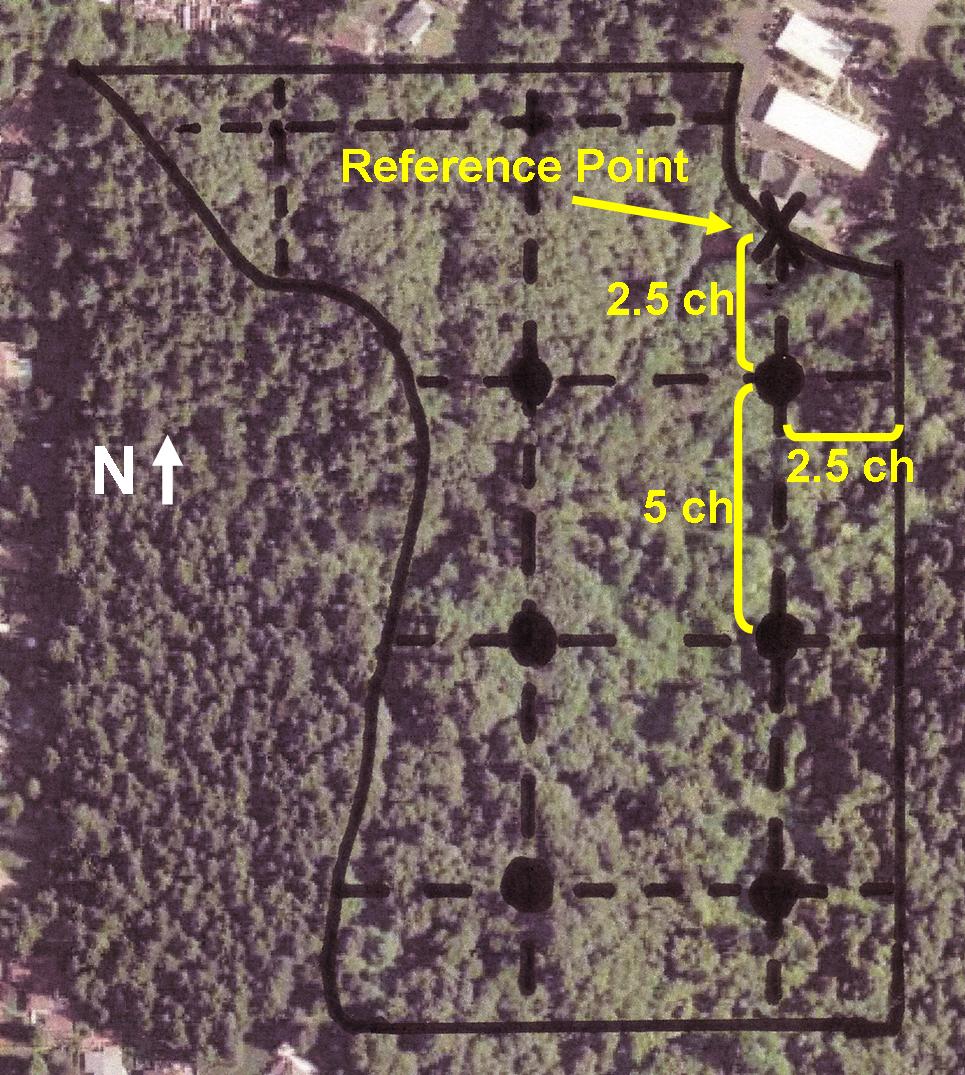 |
| Figure 2-2: A potential plot grid that establishes 6 plots in this 23-acre stand. The reference point (marked with an ‘X’) is located at the corner of a building. Moving south 2.5 chains locates a plot that is 2.5 chains in from the northern and eastern boundary of the stand. |
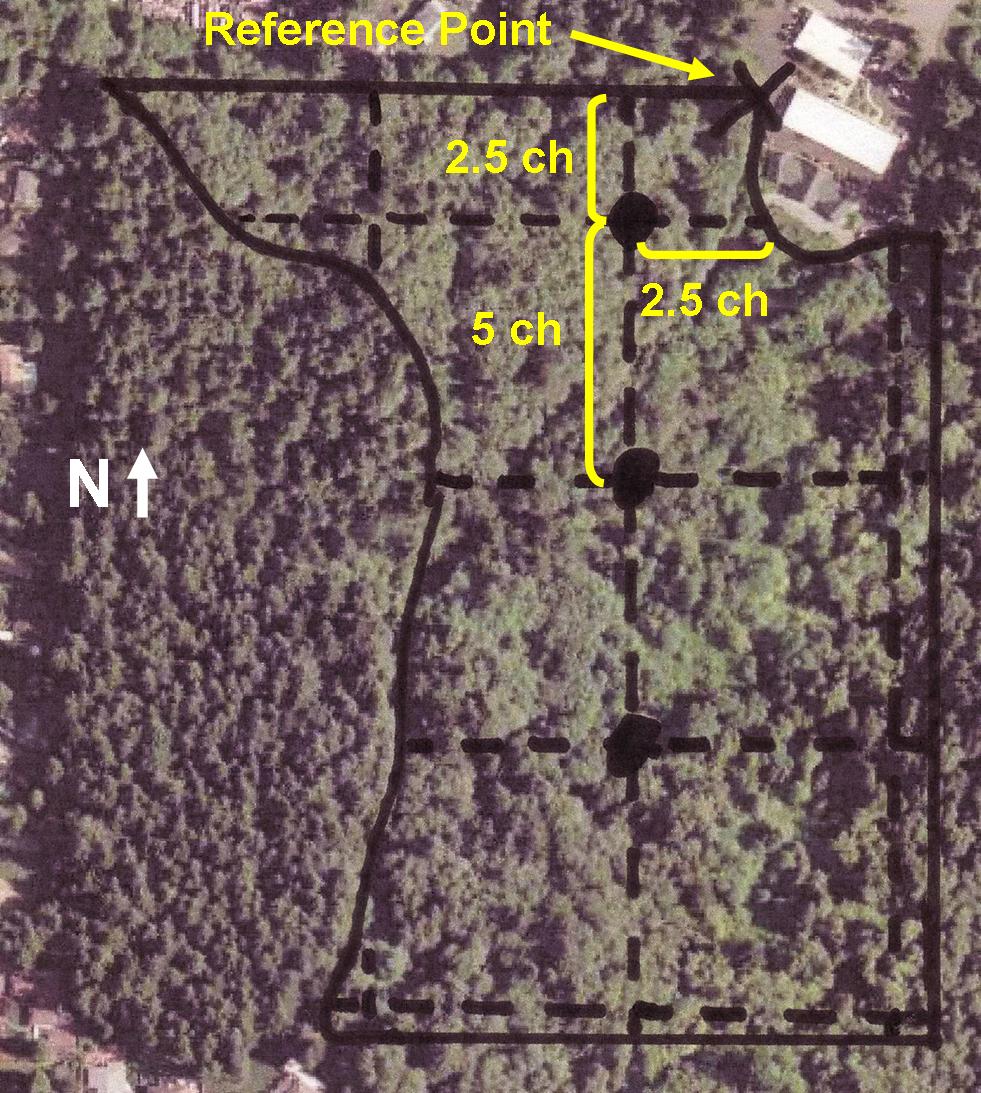 |
| Figure 2-3: A potential plot grid that establishes 3 plots in this 23-acre stand. The reference point (marked with an ‘X’) is located at the northeast corner of the stand. Moving west 2.5 chains and south 2.5 chains locates a plot that is 2.5 chains in from the northern and eastern boundary of the stand. Note the different distribution of plots with this grid compared to Figure 2-2. |
These two figures demonstrate that there are multiple ways that a plot grid can be established. Different starting points result in a different number and distribution of plots. Both examples above are systematic and one is not necessarily better than another. You may try a couple different grid layouts to find one that gives you the number and distribution of plots you desire.
|
Next Steps:
- Test your knowledge by taking a Short Quiz.
- Go to the Next Lesson.