 |
 |
 |
 |


INVESTIGATION OF ALTERNATIVE FUEL REMOVAL
STRATEGIES
|
Heather K. Rogers
*RTI has made Heather Roger's Thesis Defense Presentation available on-line. The defense video is synchronized with the corresponding presentation at two different magnitudes. Details are below.
Here's a link to the PDF version of this Thesis
AcknoledgementsI really enjoyed working with Kevin Ceder, Larry Mason, Dr. James
McCarter, Bruce Lippke, Jeff Comnick, Luke Rogers and Matt McLaughlin
on this research. I learned a great deal through their patience
and support
|
|||||||||||||||||||||||||||||||||||||||||||||||||||||||||||||||||||||||||||||||||||||||||||||||||||||||||||||||||||||||||||||||||||||||||||||||||||||||||||||||||||||||||||||||||||||||||||||||||||||||||||||||||||||||||||||||||||||||||||||||||||||||||||||||||||||||||||||||||||||||||||||||||||||||||||||||||||||||||||||||||||||||||||||||||||||||||||||||||||||||||||||||||||||||||||||||||||||||||||||||||||||||||||||||||||||||||||||||||||||||||||||
| Figure 1 | A and B 2002 Large Fire Locations and USFS ownership |
| Figure 2 | Acres Burned in Wildland Fires Reported 1993-2002 (NICC 2002) |
| Figure 3 | Fremont National Forest Boundary |
| Figure 4 | FNF Forest Type Distribution |
| Figure 5 | FNF Fire Risk Distribution |
| Figure 6 | Okanogan National Forest boundary |
| Figure 7 | ONF Forest Type Distribution |
| Figure 8 | ONF Fire Risk Distribution |
| Figure 9 | A and B FNF High Fire Risk Species and Structure Distributions |
| Figure 10 | FNF High Fire Risk Response to Six Simulations with Regeneration |
| Figure 11 | FNF High Fire Risk Response with No Regeneration after Treatment |
| Figure 12 | A and B ONF High Fire Risk Species and Structure Distributions |
| Figure 13 | ONF High Fire Risk Response to Six Simulations with Regeneration |
| Figure 14 | ONF High Fire Risk Response with No Regeneration after Treatment |
| Figure 15 | A and B FNF Net Revenue High and Moderate Risk Low Cost |
| Figure 16 | A and B FNF Net Revenue High and Moderate Risk High Costs |
| Figure 17 | A and B ONF High and Moderate Risk Net Revenue with Low Cost |
| Figure 18 | A and B ONF Net Revenue High and Moderate Risk with High Costs |
| Figure 19 | Gross fire fighting costs by magnitude for 1992-2002 |
| Figure 20 | FNF Fire Suppression average costs/acre by magnitude for 1992-2002 |
| Figure 21 | OWNF Fire Suppression average costs/acre 1990-2002 |
| Figure 22 | A and B FNF ONF High and Moderate Net Return Low and High costs |
List of Tables
| Table 1 | Tons Per Thousand Board Feet (MBF) for Eastern Washington and Oregon |
| Table 2 | FNF and ONF Low and High Logging, Hauling/MBF and PCT Costs/Acre |
| Table 3 | Regional Log Sort Values $/MBF Used for Economic Valuation |
| Table 4 | Acres in Initial Fire Risk Class for Forests on FNF and ONF |
| Table 5 | FNF fire risk reduction treatment metrics |
| Table 6 | ONF fire risk reduction treatment metrics |
| Table 7 | FNF mean net revenue for high and moderate risk with high and low costs |
| Table 8 | ONF mean net revenue for high and moderate risk with high and low costs |
| Table 9 | FNF MMBF available/year and direct and indirect jobs from fuel reductions |
![]()
1. Introduction
1.1 Background
Dry, mid to high elevation federal forests in the inland West are
overstocked with unhealthy, suppressed, small trees (Cooper 1960,
Pyne 1997, Arno 2000). This is a result of decades of grazing, fire
suppression, and logging (Pyne 1982, Arno 1996). Historically 10-25
year fire return intervals maintained a healthy ecosystem in these
forests (Agee 1993). Many of these forests have grown under suppressed
conditions which leave them more susceptible to insect and disease
(Stewart 1988, Cochran and Barrett 1998, Pfilf et al. 2002). Due
to lengthened fire intervals the dominant species in these forests
have transitioned from fire tolerant to fire intolerant species
(Pfilf et al. 2002). In forests now dominated by fire intolerant
species the fuel load available to burn is more vulnerable to more
intense fires (Huggard and Gomez 2001). Due to the high fuel load
and altered species composition from tolerant to intolerant tree
species, the fires may burn out of control as intense wildfires
(USDA Forest Service 2002a). Fire suppression has caused these naturally
or mechanically reseeded stands to grow into densely stocked forests
(Pyne 1997, Everett et al. 2000, Strohmaier 2001). Removal of surplus
fuel is needed to restore frequent low intensity fire regimes (Omi
and Martinson 2002).
High fire risk forests in the United States (US) are concentrated
on public lands including the national forests (USDA Forest Service
U.S. Dept. of Interior and Western Governors' Association 2001).
The majority of United States Forest Service (USFS) land is concentrated
in the Western half of the US. Figure 1 shows the distribution of
large fires for 2002 alone. There are many overlaps between the
USFS land and the 2002 fires as shown by comparison of Figure 1
A and B. Concentrations of high fire risk forests appear in very
similar locational distributions as do the large forest fires in
2002 in the Western United States (Powell et al. 2001).
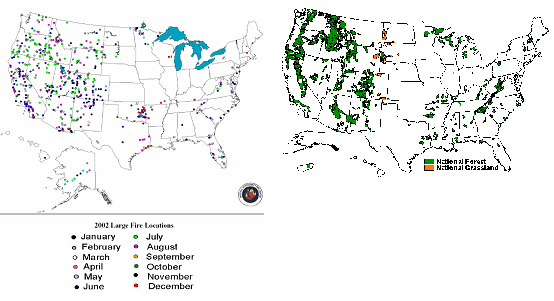 |
| Figure 1 A and B 2002 Large Fire Locations and USFS ownership |
The extent of the problem nationally is evidenced by the trend of
acres burned over the last 10 years and the number of acres in high
fire risk (United States National Interagency Fire Center 2002).
Figure 2 shows acres burned in wildland fires 1993-2002. Note particularly
the large number of acres burned in 2000 and 2002. The USFS manages
192 million acres of which 56 million acres have been determined
to be in high fire risk conditions (Powell et al. 2001). Roughly
half of the high fire risk acres on National Forest lands are located
in the Pacific Northwest (Western Governors Association 2001, 2002).
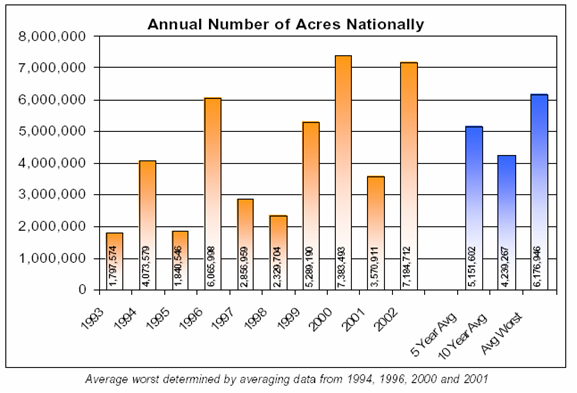 |
| Figure 2 Acres Burned in Wildland Fires Reported 1993-2002 (NICC 2002) |
![]()
There are many potential impacts from forest fires to rural communities that are located near high fire risk forests. Impacts of wildfire include decreased forest health, air pollution, loss of wildlife habitat, destruction of private property, and decline in the quality of life for people who live near this forestland. The federal government is developing strategies for fuel reduction treatment in at-risk forests through the National Fire Plan (Western Governors Association 2001, 2002, The Office of the President 2002). Fuel reduction treatments are being tested through innovative contracting mechanisms and research. Fuel removal thinning costs may be considered as an investment in reducing the expense to the government of suppressing fire. Currently, the federal budget spent on fire suppression well exceeds the allocation for fuel reduction activities. In recent years record costs have been incurred by federal agencies to fight forest fires, $1.4 billion in 2000 and $2.2 billion in 2002 (The Office of the President 2002). There are also costs to local areas business, and states, counties, and cites when forest fires occur (Babbitt and Glickman 2000).
1.2 Research Objective
The objective of this study is to evaluate the cost and/or revenue
associated with fire risk reduction effectiveness for different
management alternatives on two National Forests (NF) in order to
support more effective hazardous fuels reduction strategies. This
assessment analyzes fire risk and net revenue associated with hazardous
fuels reduction treatment simulations. The two forests that were
chosen both have high fire risk overstocked forest areas dominated
by small diameter suppressed trees and, as a result, both forests
recognized to be are in need of fuel removal thinning treatments
to reduce fire risk (Fremont National Forest 2003, Okanogan National
Forest 2003). On the other hand while these forest share a similar
risk reduction challenge there are many aspects of these forests
that are quite different such as the harvesting and manufacturing
infrastructures, the forest types, moisture and weather patterns,
etc.
Hypothesis: Positive net revenues from logs sales will result from
harvest activities designed to reduce fire risk in most of the moderate
to high risk inland west forests.
Null Hypothesis: There is little potential for positive net revenue from logs sales that will result from harvest activities designed to reduce fire risk in moderate to high risk inland west forests.
Also worthy of consideration in the context of fuel removal treatment evaluations is a broader set of costs and benefits expanded to include an assortment of market and non-market values that result from risk reduction investments. Simply put, it may be that, even if fuel removal harvests don't generate positive revenues from log sales, the many other benefits resulting from resource protection and utilization will outweigh any government costs for service contracts to remove surplus fuel loads.
An additional goal of this investigation is present a technical methodology to assist forest managers in quick evaluation of forest fire risk distributions and potential treatment alternatives across broad landscapes. Without technology to assist such analysis, the complexity of forest planning for hundreds of thousands of acres is daunting. It is the intention of this investigation to demonstrate technical modeling capabilities beneficial to foresters that must communicate management choices to involved lay publics so that they might better understand the consequences of treatment alternatives or no action.
![]()
2. Methods
This project has been designed as a parametric sensitivity analysis to be used in tandem with existing forestry modeling capabilities to assess the effectiveness of varying degrees of harvest intensities for fire risk reduction against operational costs and revenues associated with alternative fuels reduction strategies. To support this project, information needed to gain better understanding of the opportunities and obstacles associated with fuel removal activities on federal lands has been gathered from the scientific literature, government publications, and personal interviews with forestry professionals and community representatives.
2.1 Literature and Government Report Review
A review of pertinent elements of the scientific literature and various government reports was completed in order to achieve several informational goals identified as important to the results of this project. In addition to general background information on the history and magnitude of wildfire risk associated with overstocked forests, other information including but not limited to logging and hauling costs, forest product types and values, Forest Service administration costs, Forest Service contracting authorities, community demographics and infrastructures, etc. has been assembled to best inform this investigation.
2.2 Local Interviews
There is a wealth of experience and knowledge held by members of
local communities (USDA Forest Service USDI and Western Governors'
Association 2001). Interviews were conducted with public agency
professionals, loggers, foresters, consultants, and economic development
organizations. These interviews provided information on local costs,
values, and perceived opportunities. Interviews were conducted by
telephone and in person. The interviews covered questions regarding
quantitative information such as costs of operation and qualitative
discussions including experiences of treating overstocked stands.
Respondents shared opinions and commentary on how to improve and
streamline current fuel removal techniques and contract options.
In order to respect respondent privacy, specific details and data
will not be associated with specific contractors or organizations,
however, a list of interviewees is presented within the bibliography
(local interviews 2002).
Many individuals generously contributed information founded upon
their professional judgment and personal experiences. For example,
operational cost estimates provided by private contractors served
to enrich the quality of cost data from other sources. Suggestions
from local people on how to customize Forest Service contract offerings
for increased efficiencies proved essential for better understanding
of operational possibilities. The benefits provided to this project
from personal interviews served to underscore a recurring theme
in this project: successful fuel reduction strategies will likely
be based upon integration of anecdotal and institutional knowledge.
Through this investigation interview data, research information
from the literature, and results of modeling analysis are presented
together by topic of interest.
2.3 Technical Tools
Evolving forestry and mapping technologies can help foresters design complex fuel reduction strategies that integrate multiple management goals. This project has developed a parametric sensitivity analysis that utilizes available technologies to analyze a range of conditions that apply to customized local needs. Software capabilities employed for use in this project include the Landscape Management System (LMS), Forest Vegetation Simulator (FVS), Fire and Fuels Extension (FFE), Microsoft Access , Microsoft Excel , and ESRI ArcView . Customized software functionality created for use in this project included spreadsheets and databases to assess performance metrics.
![]()
The Landscape Management System
The effects of forest management alternatives on fire risk reductions, forest product outputs, and economic metrics, were simulated using the Landscape Management System (LMS). LMS is an evolving computer-based, landscape-level forestry analysis software tool developed at the University of Washington College of Forest Resources (McCarter 1997, McCarter et al. 1998, McCarter 2001). LMS offers a software platform for the integration of component software capabilities that include growth and yield models, interactive stand treatment simulation programs, tabular and graphical analytical outputs, and stand and landscape visualization programs. Data sources necessary for LMS include stand inventory information (tree-based measurements), landscape data (slope, aspect, elevation, site quality), and Geographic Information System (GIS) spatial data (stand boundaries, streams, roads, etc.). Using LMS it is possible to simulate stand and landscape inventory growth projections forward in time to create predictions of potential stand and landscape forest conditions. Simulations may be created that include harvesting, regeneration, and wildfire. The graphical user interface (GUI) within LMS is designed to provide a user-friendly "click and go" command format. The intended result is that this powerful forestry software is available for use by individuals with minimum computer skills and limited financial resources. Consequently, LMS has proven to be useful not only as a powerful analysis support tool for forestry professionals but also as a communication tool for use with stakeholder groups embarked on the often conflict-vulnerable process of consensus building. LMS is available for download and provided at no charge through a forestry research partnership between the University of Washington and Yale University. The web site address is http://lms.cfr.washington.edu/.
Forest Vegetation Simulator
The Forest Vegetation Simulator (FVS) is an individual-tree, distance-independent
growth and yield model (Crookston 1990, Van Dyck 2000). FVS will
simulate growth and yield for most major forest tree species, forest
types, and stand conditions. FVS can simulate a wide range of silvicultural
treatments. Variants of FVS provide growth and yield models for
specific geographic areas of the United States. Prognosis (Stage
1973) is the original model that evolved into the Forest Vegetation
Simulator. Stage developed Prognosis for use in the Inland Empire
area of Idaho and Montana. In the early 1980s, the National Forest
System's Timber Management Staff selected the individual-tree, distance-independent
model form as the nationally supported framework for growth and
yield modeling. Over the following years, the Forest Management
Staff's Growth and Yield Unit incorporated much of the Prognosis
modular structure and capabilities into the national model framework.
This model framework is the Forest Vegetation Simulator, or FVS
(Wykoff et al. 1982).
There are 21 different FVS variants. Each is calibrated to a specific
geographic area of the United States. Various extensions are available
for some of the variants. These extensions provide the ability to
estimate the influence of other agents upon tree growth (such as
insects, disease, and fire), extend FVS modeling capabilities, and
permit multiple stand simulation. For the simulations needed for
this investigation the East Cascades Variant (EC) of FVS and the
South Central Oregon and Northeastern California Variant (SORNEC)
of FVS were selected for use within LMS to contribute growth-modeling
capabilities for the Okanogan National Forest and the Fremont National
Forest respectively. More information and a suite of FVS regional
variants are available from the USFS web site at: http://www.fs.fed.us/fmsc/fvs/.
Fire and Fuels Extension to the
Forest Vegetation Simulator
The Fire and Fuels Extension to the Forest Vegetation Simulator
(FFE-FVS) links the existing FVS, models that represent fire and
fire-effects, with newly developed fuels dynamics and crowning submodels
(Beukema et al. 1997, Scott and Reinhardt 2001). The Fire and Fuels
Extension (FFE) has been developed to assess, risk, behavior, and
impact of fire in forest ecosystems (Beukema et al. 2002). FFE can
produce reports of changes in various indices of potential fire
severity as a result of alterations to stand characteristics resulting
from simulated management alternatives. More information and downloadable
FFE for use with selected variants of FVS are available from the
USFS web site at: http://www.fs.fed.us/fmsc/fvs/.
The 35-year simulations selected for this project were performed
using the East Cascades (EC) and Southern Oregon and Northeast California
(SORNEC) variants of the Forest Vegetation Simulator (FVS) with
the Fires and Fuels Extension (FFE) within the Landscape Management
System (LMS). 35 years was used as a time horizon to consider the
durability of post harvest risk reduction for each simulation into
the future.
This project uses the capabilities of the Fire and Fuel Extension
to the Forest Vegetation Simulator (FVS). The Fire and Fuel Extension
(FFE) was developed to integrate the FVS growth model with elements
of existing models of fire effects and behavior (Beukema et al.
2002). The FVS growth model was used to simulate tree growth and
silvicultural treatments. FFE was used to assess fire risk for all
scenarios and fire impacts for the wildfire simulation. Both tool
were run from the Landscape Management System to allow additional
analytical procedures which addressed other research questions.
Inventory information from 1995 was used to simulate stand growth
to 2030, with treatments performed in 2000.
![]()
2.4 Data and Information
Current Vegetation Survey
Conditions on the Fremont and Okanogan National Forests were represented,
simulated, and analyzed using the Current Vegetation Survey (CVS)
Occasion 1 data sets. Data for these national forests was collected
during the period from 1994 to 1996. Re-measurements of many plots
occurred during successive panels of CVS Occasion 2, but full re-measurement
data was not available for both forests. As a result, CVS Occasion
1 data, with a base year of 1995, was selected to provide the forest
inventory information used to undertake the simulation analysis
required for this study. The 1995 data were "grown" forward
within FVS for one growth period to 2000 to bring data close to
present time before treatment simulations were conducted.
The Fremont National Forest contains 601 total CVS plots. Plots
with dominant species by basal area of lodgepole pine (Pinus contorta),
ponderosa pine (Pinus ponderosa), or white fir (Abies concolor)
were used in the analysis. Plots with other dominant species associated
with higher-elevation long duration fire cycles or non-forested
plots associated with grasslands, rocky outcrops, or water were
not considered in this analysis. For the Fremont National Forest
61 plots were dominated by juniper (Juniperus occidentalis). While
these areas may well benefit from fuel reduction, presently there
is no growth model for this species. For this reason the plots dominated
by juniper were discarded from the data set as well. It is worthy
of mention, however, that juniper harvests could augment feedstock
supplies for biomass-to-energy projects and that juniper removals
will likely reduce overall forest fire risk (Swan 2002). A total
of 502 plots or 84% of the total plots were selected as forested
areas to be evaluated for treatment simulations.
A total of 663 CVS plots were available from the Okanogan National
Forest. Plots used in the analysis were those in which the dominant
species, determined by basal area, was ponderosa pine, lodgepole
pine, Douglas fir (Pseudotsuga menziesii), or western larch (Larix
occidentalis). Plots with other dominant species associated with
higher elevation long duration fire cycles and non-forested plots
were considered not suitable and were removed from the data set
used for this analysis. The number of plots used in the simulations
for the Okanogan National Forest was 413 or 62% of the total available
CVS plots.
The selected 502 plots (FNF) and the 413 plots (ONF) from the CVS
database were used to create two forest inventory datasets representative
of the variety and distribution of forest age classes, densities,
tree species, tree sizes, and crown characteristics present in the
ONF and the FNF that would be subject to consideration for hazardous
fuel reduction treatments. For purposes of conducting forest-wide
simulations, the data from each plot has been assumed to represent
the inventory of a one-acre forest stand. Subsequently, the simulated
FNF will have a 502 acre "forest" and the simulated ONF
will have a 413 acre "forest". To expand per acre volumes
from CVS data for landscape inventory estimates, one would use 1849.6
as an expansion factor resulting from the 1.7 mile grid used to
systematically distribute CVS sampling point locations.
![]()
2.5 Growth, Treatment, and Wildfire Simulation
To analyze the relative effectiveness of alternate harvest treatment
intensities on fire risk reduction and the subsequent economic results,
four silvicultural prescriptions were developed to conduct harvest
simulations for each CVS plot for the Fremont and Okanogan National
Forests. A NO Action simulation of growth without disturbance and
a Wildfire simulation where all acres were ignited were conducted
to represent opposite ends of a control spectrum to evaluate do
nothing verses the consequences of potential fire disturbances verses
effectiveness of the risk reduction treatments. The four harvest
treatments were selected to span a range of removal intensities,
removing various categories of trees from the very small to the
very large and with both fixed and variable density targets. The
treatment alternatives were selected, as well, to be readily comparable
to simulation findings emerging from other fire risk reduction research
projects. All harvest simulations growth projections were done using
variants of FVS within LMS. The East Cascades (EC) Variant of FVS
was used for the Okanogan inventories, and the South Central Oregon
and Northeastern California (SORNEC) Variant of FVS was used for
the Fremont inventories. Simulated treatments were conducted in
2000. Post treatment inventories were grown forward to 2030 using
5-year growth simulation periods. A set of results were developed
with and without ingrowth. Alternatives modeled included no action
(no treatment or disturbance within the study period), four different
harvest treatments, and a wildfire simulation.
The six treatment prescriptions that were developed to investigate
the response of different forest types to different treatment strategies
include:
- No Action (No action). This prescription assumes
no harvest activities and no wildfire for the duration of the
simulation period. While no wildfire seems an unrealistic expectation,
this simulation is valuable to display increases in risk for the
forest landscape over time.
- Remove 9" and Under, (9 and under). This
prescription harvests all trees 9" in diameter at breast
height (DBH) and smaller. This treatment represents an approach
in use by the Forest Service and recommended by Babbitt and Glickman
in 2000.
- Remove 50% BA, From Below (Half BA). This treatment
is a removal of half of the total basal area (BA)/acre by removing
the smallest trees (thinning from below).
-
Leave 45 sqft BA, From Below (BA 45). This treatment is intended to simulate restoration of savannah-like conditions that are similar to what has been described in literature as the pre-settlement open-stand conditions that resulted from frequent but low wildfires (Agee 1993). In the FNF, all ponderosa pine were left standing, while in the Okanogan both ponderosa pine and western larch were favored as leave trees. In both cases, these species were selected for retention in order to help restoration these forests to what is considered to be an open pre-settlement condition dominated by thick bark fire tolerant species. For an example of what BA 45 means as a management target consider that if trees are approximately 12" DBH then at BA 45 approximately 57 trees per acre (TPA) would be left after harvest.
&TPA = BA/DBH2*.005454
- Remove 12" and Greater, From Above (12 and over).
This treatment is to simulate harvest designed to maximize profit
by taking the largest and most valuable trees that are 12"
DBH and larger. This practice was commonly known as high grading
in the first half of the twentieth century. This simulation conservatively
estimates the value of stand inventories at risk from wildfire.
- Wildfire Simulation (Wildfire). This simulation is undertaken to demonstrate the levels of mortality for different stand inventories that might be associated with wildfire. The wildfire was simulated using the FFE extension within FVS. Burn conditions to be specified in the model were a temperature of 70 degrees Fahrenheit, a wind speed at 20 feet in the stand of 20 miles per hour, and nominal moisture levels of "very dry" (Crookston et al. 2002).
All treatments and the wildfire simulation occurred in year 2000. The four thinning treatments modeled included a removal of all trees with a DBH less than or equal to nine inches (9 and under); a thin from below removing 50% of the original basal area (Half BA); a thin from below with a residual basal area target of 45 square feet favoring ponderosa pine and western larch (BA 45); and a removal of all trees with a DBH greater than or equal to 12 inches (12 and over).
Results were produced for each alternative with and without regeneration to simulate either controlled burn fuel removal or fire risk impacts associated with accumulating fuel loads from ingrowth. Simulations with regeneration were modeled to have a stocking level of 500 trees per acre 4 years after a treatment or wildfire. The distribution of species for the new seedlings was based on the distribution of species by basal area in the residual stand. No action simulations received no regeneration. All simulations including No action utilize FVS to "grow" existing inventories (including regeneration where applicable) forward through time to the end of the simulations period at 2030.
![]()
2.6 Analysis of Fire Risk
Simulations that were treated but not assigned regeneration inventories
suggest outcomes in 2030 that might be achieved if controlled burns
or other treatments remove additions to fuel loads that might otherwise
result from ingrowth. Simulations that were treated and assigned
post-treatment regeneration inventories (ingrowth) are conducted
to demonstrate that effective long term risk reduction will likely
require some type of post treatment fuels control.
Each alternative was analyzed to examine the impact on fire risk
and economic net revenue. Initial forest conditions were analyzed
for each national forest for fire risk, forest structure, and species
composition. Additionally, each CVS plot was analyzed at each projection
cycle for fire risk.
Fire Risk Classification
High, moderate, and low fire risk was estimated for each CVS plot in the simulation dataset based on the Severe Crowning Index assessment from the Potential Fire Report produced by FFE. The Crowning Index indicates the estimated wind speed in miles per hour (mph) at 20 feet off the ground that would initiate an active crown fire assuming ignition of a surface fire. Assumptions required by the model include a temperature of 70 degrees Fahrenheit and 'very dry' moisture conditions (Crookston et al. 2002). Results from the crowning index estimates for each stand were sorted into one of three risk classes. Lower wind speeds indicate greater risk. If the crowning index was less than 25 mph, then the plot was considered to be in the high fire risk category. Moderate risk stands were those with a Severe Crowning Index between 25 and 50 mph. Low fire risk stands were those with a crowning index greater than 50 mph. It should be noted here that risk classifications are arbitrary thresholds useful and necessary for comparative analysis but that they may very well understate the risk at the margins. The word moderate properly segments a risk difference between high and low although the risk of a fire from wind speeds only slightly higher than 25 MPH might not be considered a moderate risk by many publics. It is in part for this reason that performance comparisons for treatment alternatives were reported in this investigation for high and moderate as separate risk classes and then combined as the total area to be considered for risk reduction treatments.
The initial 1995 fire risk distribution for the Fremont and Okanogan National Forests was reported as the percentage of CVS plots in each of the fire risk categories prior to any treatment or growth simulation. Fire risk distribution was similarly reported for projected and treated plot inventories at each growth cycle. For purposes of simulations to demonstrate comparisons between treatment alternatives only the plots with high and moderate initial classification were treated. Low risk areas did not receive treatment simulations since treatments of low risk areas would logically be considered unnecessary or of low priority. While some low risk areas may experience increases in risk over time most low risk areas appear to be either very young small diameter forests or rangeland/forest interface with sparse distributions of forest inventories that are unlikely to require fuels reductions at the time of this study.
Forest Structure
Forest structure was determined using an approach utilized by the Business Bureau of Economic Research in Montana in "A strategic assessment of fire hazard in Montana" (Fiedler et al. 2001). This canopy structure classification system identifies stands as being single-layered, two-layered, multi-layered, or scattered. Five potential layers could be present in a stand, based on a minimum amount of basal area in a diameter size class. The sapling size class required at least 5 square feet of basal area in trees with less than 5" DBH to be present. The pole, medium, large, and very large size classes included trees within a DBH range of 5-9", 10-15", 11-20", and greater than 20", respectively. These size classes required at least 10 square feet of basal area to be present to be considered as a canopy layer. Stands classified as single- and double-layered had one and two size class layers present, respectively. Multi-layered stands had more than two layers present. Scattered stands had no layers present and at least 25 square feet of basal area in the stand. Using this system, each plot was classified in 1995. The initial stand structure distribution for each landscape was determined as the percentage of plots in each category.
Forest Type
Forest type for the Fremont National Forest was determined based on criteria provided by the Sue Puddy, the Silviculturist at the Fremont National Forest. This classification system identified plots by dominant species and structure. The categories were Ponderosa Pine Closed, Ponderosa Pine Moderate, Ponderosa Pine Open, Ponderosa Pine Very Open, Juniper, Lodgepole Pine, Mixed Closed, and Mixed Open. Plots with at least 12 ponderosa pine tpa with a DBH greater then 14" were classified as one of the Ponderosa Pine types. The canopy closure algorithm by Crookston and Stage (1999) was then used to distinguish Ponderosa Pine Closed (greater than 50% canopy closure), Ponderosa Pine Moderate (35-50%), Ponderosa Pine Open (25-35%), and Ponderosa Pine Very Open (less than 25%). Plots with greater than or equal to 70% of the tpa in juniper were classified as Juniper. The Lodgepole Pine forest type was defined by plots with greater than or equal to 50% of the total tpa in lodgepole pine and less than 15% of the total tpa in ponderosa pine trees with a DBH greater than 10". Plots in the Mixed forest types were classified as not meeting any of the above criteria. Mixed Closed plots had greater than 40% canopy closure. Mixed Open plots had less than or equal to 40% canopy closure. Forest type distribution for both the Fremont and Okanogan National Forests were reported as the percentage of plots in each structure type in 1995.
Forest type was reported for each national forest for conditions in the initial time period. Forest type for the Okanogan National Forest indicated the percentage of plots in Cold Dry, Dry, Mesic, and Moist conditions. Cold dry forests typically have mixed mortality fires in an elevation range from 6000-7200 ft. Dry forests have 7.5-50 year fire return intervals and are found from 1,200 to 5000 ft. Mesic forests experience weather driven catastrophic fire events every 100 or more years found in a wide elevation range from 1800-6000 ft. Moist forests are 100 to 300 year fire return interval found in mid elevations of 3000-4500 ft (Northeastern Cascades Late-Successional Reserve Assessment Team 1998). The forest type was determined using plot locations, which are UTM coordinates, for each CVS plot which were "joined" in the GIS with a forest type layer provided by John Townsley, the Silviculturalist at the Okanogan National Forest.
![]()
2.7 Analysis of Economics
Each of the four harvest alternatives were also analyzed to examine the positive or negative economic net revenue that resulted when estimated harvest and hauling costs were subtracted from the gross revenues from sale of estimated log yields. Interviews provided a range of primary data regarding local logging and hauling costs and log values by grade and species per thousand board feet (MBF). Secondary data was also gathered from available Forest Service documents and market reports that show the current market opportunities and trends of historic of log prices. The collected cost information for operational costs/acre, and average log values/MBF that were incorporated into the economic evaluation of the treatment alternatives examined in this project are described later in the text. Within LMS, a bucking algorithm was used to optimize estimates of log segments that result from trees harvested in simulated silvicultural treatments. Estimated volumes of logs by grade and species from harvest simulations were multiplied by delivered log prices to estimate gross harvest revenue for each stand (plot). Microsoft Access™ and Excel™ were used to compute the gross and net revenue per acre based upon subtraction of local logging costs, and hauling costs from local market log values by species and grade. In some cases, effective fuel reductions required the removal of non-merchantable small diameter trees. Where this was the case an additional operational cost/acre referred to in this study as pre-commercial thinning (PCT) was charged against gross revenues to complete the economic analysis for each stand. The gross log value/acre minus the logging, hauling, and (PCT) costs equals net economic return per acre. Estimates of preparation, administration and litigation costs to the USFS are not considered in this analysis but have historically been significant as noted in the USFS publication "The Process Predicament" (USDA Forest Service 2002b).
Conversions
To utilize the specific logging costs, hauling costs, and log value estimates that were gathered from interviews and publication, some numbers required conversion from tons to thousand board feet. Forestry professionals from both National Forests were interviewed for the appropriate conversion factor to use. Weight to volume conversion factors are by nature variable due to water content in log, tree species, and time since the log has been felled. A conversion rate of 7 tons/MBF was agreed to be most generally representative and was selected to be used to convert some costs and values based on tonnage into $/MBF. Table 1 shows the range of conversion factors that resulted from local interviews (local interviews 2002).
Table 1 Tons Per Thousand Board Feet (MBF) for Eastern Washington and Oregon
| High | Low | Average |
| 5.6 | 8.6 | 7 |
Logging and Hauling Costs
Eighteen logging contractors were interviewed in Oregon and Washington. These loggers were willing to share information on the logging equipment mixes that they have, the costs to log with their equipment, and the cost to haul the wood to the mill. The haul costs were assigned based on the interview results according to the average haul the loggers suggested for each forest. Harvest operations costs estimates collected from these contractors include both cable and ground based logging operations. Table 2 shows the high, low and average logging hauling and PCT costs per acre. These costs were assigned by calculating an average of all the high and low operations costs collected from contractors for each forest. These figures were used for economic valuation of thinning simulations for the FNF and ONF. The PCT costs are included to estimate the range of costs required to thin some of the non-merchantable stems in conjunction with the removal of any merchantable material. A low PCT cost of $300/acre and a high of $500/acre were used to simulate treatment of non-merchantable material as part of fuel reductions in any stand with greater than 200 TPA 6" in diameter or smaller. The interviews with contractors and USFS employees suggested 200 TPA, of submerchantable material as the threshold of when PCT costs become a realistic addition to logging costs. PCT costs include removal of submerchantable material to the road or landing. This material could be used as biomass fuel for energy generation, but has historically not been economically feasible to remove to a conversion site.
![]()
Table 2 FNF and ONF Low
and High Logging, Hauling/MBF and PCT Costs/Acre
| Low | High | |
| Fremont Cable | $160 | $246 |
| Fremont Ground | $132 | $217 |
| Okanogan Cable | $210 | $296 |
| Okanogan Ground | $182 | $267 |
| Pre-Commercial | $300 | $500 |
There is a high degree of variability in logging and hauling costs
suggested by interview respondents. To demonstrate a representative
range of potential operations costs, simulated harvest yields were
analyzed for both high and low cost for the four thinning treatments.
Interviews with many employees in the Forest Service, Department
of Natural Resources, and Oregon Department of Forestry served to
confirm contractor cost estimates and validate the range of costs
per acre. Several factors including equipment, terrain, contract
specifications, and density of stand are known to influence operating
cost variability. In addition, many of those interviewed commented
on their experiences logging for the USFS compared to logging on
private land. Some contractors reported that higher operations charges
were necessary to profitably operate on federal forests as opposed
to private or state owned forest lands. Other contractors reported
that as a result of unfavorable experiences with USFS contracts
that they only work on private land now. Interview comments suggested
that the many complicated factors regarding contract requirements
for harvest activities on federal lands have made such operations
difficult and expensive.
Mill Log Values
Logs that are removed during fuel reduction thinnings, can include a mixture of non-merchantable trees, pulp logs and sawlogs. Interviews with mills around the FNF and ONF were combined with log price market reports to estimate delivered log prices. Prices in this study are current as of August 2002. Table 3 shows the prices collected from nine mills and three regional log value reports.
Table 3 Regional Log Sort
Values $/MBF Used for Economic Valuation
| FNF Sorts | PP | DF | LP | RC | WP | ES | WF | GF | AF | WL | WH |
| Pulp | 100 | 122 | 122 | 122 | |||||||
| Hewsaw | 452 | ||||||||||
| Saw 4 | 400 | ||||||||||
| Saw 3 | 530 | ||||||||||
| Saw 2 | 575 | ||||||||||
| Saw 1 | 625 | 270 | 300 | ||||||||
| ONF Sorts | PP | DF | LP | RC | WP | ES | WF | GF | AF | WL | WH |
| Pulp | 100 | 100 | 100 | 100 | 100 | 100 | 100 | 100 | 100 | 100 | |
| Hewsaw | 350 | 350 | 322 | 377 | 343 | 350 | 336 | 336 | 350 | 336 | |
| Saw 4 | 331 | 462 | |||||||||
| Saw 3 | 487 | 525 | |||||||||
| Saw 2 | 525 | 410 | 289 | 585 | 343 | 300 | 300 | 300 | 410 | 300 | |
| Saw 1 | 800 | 479 | 375 | 711 | 628 | 428 | 330 | 330 | 479 | 330 |
Net Revenue Calculation
Volumes of harvest were simulated for alternative thinning treatments and divided to estimate potential yield volumes by species and grade estimated by the bucking algorithm in LMS. Estimates of merchantable volumes of pulp and sawlogs were divided by species and grade. Each species and grade volume was multiplied by the assigned price per MBF. Gross estimated revenues from log sales were determined for each stand and for each treatment alternative by summing species and grade returns for each stand. Treatment costs were subtracted from gross revenue from log sales to determine net revenue. The average net revenues for each treatment type by risk class were calculated for comparison with risk reduction success resulting from each treatment alternative. Risk reduction and the associated economic results when compared for each treatment alternative are presented to offer dual measures of effectiveness. Such comparisons are valuable to foresters planning treatments for maximum risk reduction at least cost. Since harvesting and hauling contractor costs are subtracted from gross revenues, the resultant positive or negative net return from each treatment simulation may be considered indicative of either potential timber sale revenues (theoretical bid maximums in excess of operational costs in the case of a positive returns) or stewardship costs for risk reduction (while logs may not be profitable from a timber sale perspective they do have sufficient value to discount fuel reduction costs when included in a combined goods and services transaction). Neutral returns mean that the value of the logs harvested will cover the risk reduction treatment costs but do not have sufficient value to warrant a timber sale offering. In some cases foresters may want to combine treatments and stands such that the positive revenues available from one stand fuel reduction harvest can be used to offset the negative revenues associated with another stand fuel reduction harvest. This may be done to create a service contract that is cost neutral or a timber sale where the harvest value of some stands carries the cost of fuel reductions for other stands and still yields positive revenue.
![]()
3. Case Study Site Descriptions
The Fremont National Forest (FNF) in Oregon and the Okanogan National
Forest (ONF) in Washington were selected as study areas for this
project. Both of these National Forests are located within the dry
interior portion of the western United States. Both of these forests
are thought to have had frequent fire return cycles, prior to European
settlement, that created many areas that were dominated by open
stands of ponderosa pine (Fremont National Forest 2003, Okanogan
National Forest 2003). Both the FNF and the ONF contain substantial
acreages of overstocked forests that are considered to be at risk
from wildfire Table 4. Both National Forests have experienced destructive
wildfires in recent years. The communities surrounding these two
forests provide a variety of infrastructure options to remove fuel
from overstocked stands. However, the logging, transportation, and
processing of low value smaller wood has historically not been profitable.
The rural communities surrounding these forests have experienced
double-digit unemployment and economic declines due to job losses
associated with reductions in federal timber harvest volumes. Individuals,
organizations, and businesses from both areas demonstrated interest
in this investigation and contributed valuable reference information
through personal interviews. The citizens of these local Oregon
(OR) and Washington (WA) communities appear eager to meet the challenge
to remove the fuel from forests with a high fire danger.
Table 4 Acres in Initial
Fire Risk Class for Forests on FNF and ONF
| National Forest | High | Moderate | Low | Total |
| Fremont | 284,838 | 436,506 | 207,155 | 928,499 |
| Okanogan | 216,403 | 369,920 | 177,562 | 763,885 |
3.1 Fremont National Forest
The FNF is in the south central dry interior of the state of Oregon. There are several rural communities surrounding the FNF boundary. The forest lies roughly between the towns of Lakeview, Klamath Falls and Bend, Oregon just North of the California/Oregon border Figure 3. Also see Appendix D for forest maps.
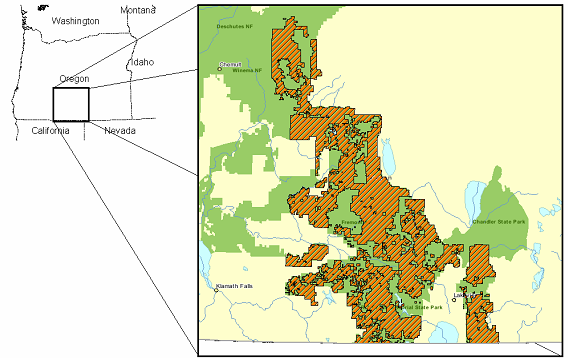 |
| Figure 3 Fremont National Forest Boundary |
The majority of the 1,198,301 acres within the boundary of the FNF
are in Lake County which is 8,359 square miles. The population of
Lake County is 7,470 and neighboring Klamath County is 64,116 (US
Census Bureau 2003). The town of Lakeview is at the Southeastern
corner of the FNF close to the California border and has a population
of 2,800 (Fremont National Forest 2003). Lake County has .9 people
per square mile. The unemployment rate for 2002 was 8.7% and it
was 10.4% in 2001. The high for the 1990's was an unemployment rate
of 12.2% (Lake county 2003). "Lake County was also the only
county in the state that experienced a net job loss during the 1990's"
(Kauffman 2001).
The forest includes wildlife and tree species adapted to the climate and elevation variation from 5,000 to 7,000 feet with mild terrain on slopes roughly 40% and less. About half the FNF is a mixed open forest type, see Figure 4, with multi-structured canopies.
![]()
 |
|
Figure 4 FNF Forest Type
Distribution
|
Half of the forest plots have greater than 500 Trees per acre (TPA)
and a Basal Area (BA) ranging from 50-150. The quadratic mean diameter
(QMD) is 12" and less for over 90% of the forestland. The major
tree species include ponderosa pine (Pinus ponderosa), juniper (Juniperus
occidentalis), lodgepole pine (Pinus contorta), and at higher elevations
white fir (Abies concolor). Most of these trees are adapted to summer
drought and extreme temperature fluctuations due to the nature of
the arid region (Fremont National Forest 2003). The 10-20 inches
average precipitation occurs from the autumn through the spring
and as a result the summers are dry and hot. See the Appendix A
for detailed charts of the original forest conditions. Of the 502
plots on the FNF the fire risk distribution is 154 high, 236 moderate,
112 low risk.
Figure 5 shows high moderate and
low fire risk by percentage of total forest.
 |
| Figure 5 FNF Fire Risk Distribution |
Fire risk analysis conducted with FFE indicate that 77.8% of FNF
is presently in a moderate to high risk condition with 30.7% of
the FNF considered to be high fire risk forests. The FNF has experienced
destructive wildfires in recent years. In 2002 over 125,000 acres
of the FNF burned due to wildfire (local interviews 2002).
In 2001 22 MMBF were harvested from FNF (local interviews 2002). There is one mill in Lakeview, Oregon. However, as many as 4 mills in the surrounding area receive logs from the FNF. The Fremont National Forest also has a sustained yield unit, and network of local efforts and non-profit organizations working to maintain forestry infrastructure.
![]()
3.2 Okanogan National Forest
The Okanogan National Forest (ONF) is located in North central
Washington. In 2000, the ONF was merged with the Wenatchee National
Forest to become the Okanogan-Wenatchee National Forest (OWNF).
Okanogan is the Northern portion of what is now the Okanogan-Wenatchee
NF.
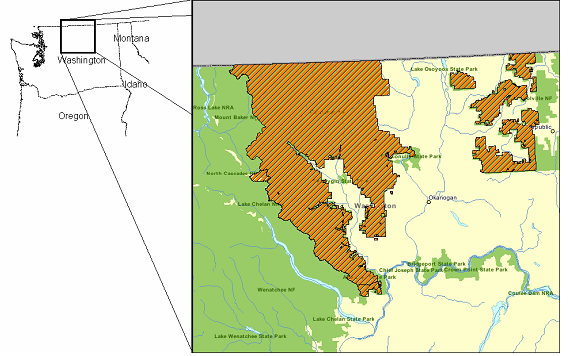 |
| Figure 6 Okanogan National Forest boundary |
Figure 6 shows the original Okanogan National Forest boundary. Also
see Appendix B for forest map. The Okanogan National Forest consists
of 1,226,550 acres total that are spread across four counties including
Skagit, Whatcom, Okanogan, and Chelan counties. The population is
most concentrated around the towns of Omak and Okanogan. Several
of the other towns close to the forest include Oroville, Tonasket,
Twisp, Brewster, Winthrop, Chelan, and Leavenworth. The population
in 2001 for Okanogan County was over 20,100 and for Chelan County
67,000 (US Census Bureau 2003). The unemployment rate for the past
ten years has been over 10% for Okanogan County. In 2000 it was
11% and 2001 it was 10.8%.
ONF is predominately dry forest type ranging in elevation from 3000 to 6000 feet in elevation
Figure 7. The Okanogan National Forest is dominated by multistructured Douglas-fir (Pseudotsuga menziesii), lodgepole pine (Pinus contorta), ponderosa pine (Pinus ponderosa), and Western larch (Larix occidentalis) with a QMD of less than 12". The BA of the forest plots is concentrated from 50 to 200 sqft. The tree densities for the majority of the forest plots range from 250 to 4000 TPA. Most of these trees in the ONF are adapted to summer drought; high summer temperatures of 90 degrees Fahrenheit are not uncommon (Okanogan National Forest 2003). The 20-40 inches average precipitation occurs from the autumn through the spring and as a result the summers are dry and hot (local interviews 2002). See Appendix B for detailed charts of the original forest conditions.
![]()
 |
| Figure 7 ONF Forest Type Distribution |
FFE analysis of the ONF data in Washington indicates that of the 413 stands total, 117 (28.3%) are classified as high risk, 200 stands (48.4%) are moderate risk, and 96 stands (23.2%) are low fire risk Figure 8. There have been large fire years in the past decade in 2000 and 1994 on the ONF.
 |
| Figure 8 ONF Fire Risk Distribution |
The mills and infrastructure surrounding the ONF are further distances away from the forest compared to the mills around the FNF increasing the haul distance and cost required to transport the wood to be processing facilities. There are also a wider variety of species in ONF potentially available for harvest that may require hauling trees to a wider variety of mills. The total harvest at Okanogan for 2001 was .1 MMBF. Whereas in 1989 the 10 year average harvest volume was 71 MMBF for the Okanogan National Forest (Okanogan National Forest 1989).
![]()
4. Results
4.1 Fire Risk Results
Fremont National Forest
As shown in
Figure 5, 30.7% of the 502 plots on the FNF are in high fire risk classification. There appear to be some common characteristics of high fire risk stands on the FNF. High risk stands have thin bark species and multi-layered canopies that are indicators of past fire suppression (Agee 1993). Figures 9 and 10 display the occurrence of these common traits of high fire risk stands on FNF. The majority of the stands designated as high fire risk are white fir dominated (53.0%) and have multi-layered canopies (94%). The presence of white fir, a thin barked shade tolerant and fire intolerant species, as well as, multi-layered canopies would indicate that wildfire has been successfully suppressed and that the current condition is not reflective of historic frequent ground fire conditions (Hopkins 1981).
 |
 |
|
A
|
B
|
| Figure 9 A and B FNF High Fire Risk Species and Structure Distributions | |
Conversely, the low risk stands are dominated by ponderosa pine
and scattered structure canopy. The scattered structure would suggest
that many low risk stands could be low density rangeland/forest
interface. See the Appendix A for a full set of tables and charts
that display initial and post-treatment forest conditions.
The simulations results indicate that the thinning treatments, Half BA and BA 45, may be the most effective in reducing fire risk in high and moderate risk forests. After the Half BA treatment, 55.4% of high and moderate risk forests were transitioned to low risk while after the BA 45 treatment, 63.8% of high and moderate risk forests were transitioned to low risk. This is compared with the 9 and under treatment which results in only 22.1% of the stands in the low fire risk category after treatment. Somewhat unexpectedly the 12 and over treatment results showed a transition of only 20.5% to low risk from high and moderate risk stands. See Appendix A for detailed tables showing risk transitions from one risk class to the next.
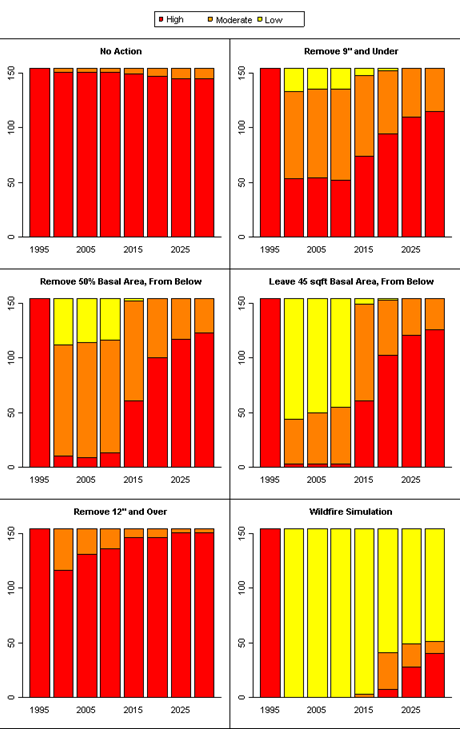
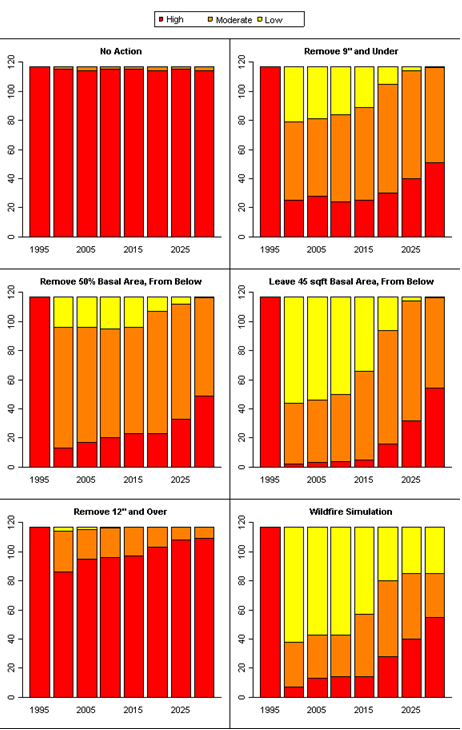
Stands designated as in a high risk forest condition logically represent those forested areas with the most opportunity for fire risk reduction. Figure 10 shows that the greatest reduction of risk resulting from fuel removal treatments occurs with the BA 45. Figure 10 shows the response to treatment with regeneration included in the simulations. This is equivalent to thinning and not planning any follow up fuels reduction treatments such as future thinning or burning to control fuel build up from regeneration ingrowth. Subsequently, 15 to 20 years after fuel reduction treatments, fire risk begins to increase dramatically with accumulation of new trees in the understory, suggesting that entries for ingrowth removals should commence 10-15 years after treatment to prevent future risk.
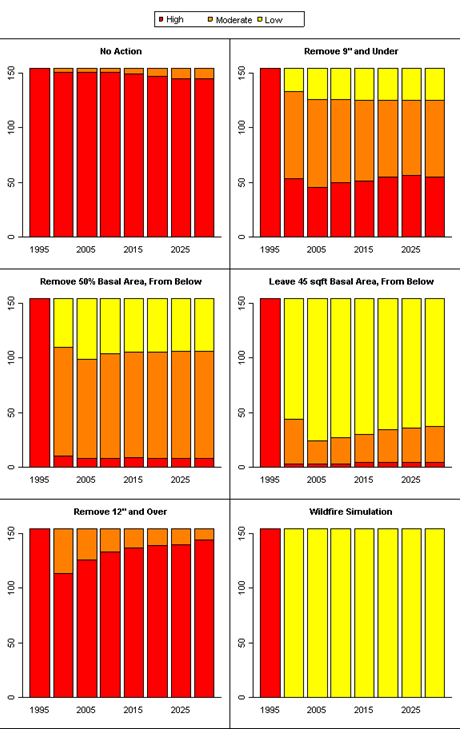
Conversely, Figure 11 is intended to display the forest risk through time as it might be with a control burn program to remove risk from ingrowth. Subsequently reductions in risk are maintained into the future by excluding regeneration from the simulations. Amongst the high risk stands both the BA 45 and the Half BA treatments reduce the risk in most of the stands; 151 or (98.1%) of the BA 45 and 144 or (93.5%) of the Half BA treated stands moved from high risk to either moderate or low risk status. However, the BA 45 treatment resulted in many more stands dropping from high to low risk status than the Half BA treatment. 110 plots (71.4%) went from high to low risk for the BA 45 treatment while only 42 plots (27.3%) went from high to low risk as a result of the Half BA treatment. The post-treatment growth simulations without regeneration for stands originally at high risk indicate that stands in low risk classification actually increase slightly (average 4-5% depending on treatment) over time for the FNF, see Appendix A. This may be due to reductions to ladder fuels associated with growth of leave trees. See Appendix A for the full set of fire risk response results for FNF and Appendix B for ONF.
![]()
 |
| Figure 10 FNF High Fire Risk Response to Six Simulations with Regeneration |
 |
| Figure 11 FNF High Fire Risk Response with No Regeneration after Treatment |
All three thinning from below treatments result in substantive risk
reduction as does the Wildfire simulation Table 5. The 12 and over
treatment does result in some risk reduction but most change is
within the moderate risk. No action simulations result in net risk
increases on high and moderate stands in the FNF. The Wildfire simulations
result in near total mortality from crown fires in both high and
moderate fire risk stands on FNF.
![]()
Table 5 FNF
fire risk reduction treatment metrics
Okanogan National Forest
High fire risk stands comprise 28.3% of the Okanogan National Forest stand data examined in this investigation. The most prevalent species in ONF stands is Douglas-fir (64.2%). While Douglas-fir is not necessarily a thin barked species in inland west ecosystems it functions as a late seral shade tolerant species in ONF forests that is present when fire return cycles become infrequent (Agee 1993). Within high fire risk stands in the ONF, the dominant forest species is Douglas fir (72.7%) and multistructured canopies (89.7%) are the dominant forest structure. Both FNF and ONF appear to have high risk forest characteristics of multi-storied canopy and late seral dominant species that are likely a result of prolonged fire exclusion. While low risk stands in the ONF are dominated by Douglas-fir they appear to have a higher percentage of ponderosa pine than high and moderate risk areas as well as a scattered canopy structure. See Appendix B for the full set of fire risk response results for ONF.
 |
 |
|
A
|
B
|
| Figure 12 A and B ONF High Fire Risk Species and Structure Distributions. | |
The response of the high and moderate risk classes to treatment simulations indicates that the treatment, BA 45, was the most effective in reducing the risk. Post-treatment results for BA 45 show 72.5% of high and moderate stands transitioned to low risk status. The Half BA treatment resulted in 56.2% of stands going to low risk after treatment. This is compared with the 9 and under which resulted in 35% of the stands in the low fire risk category. The 12 and over treatment resulted in 17.4% of high and moderate risk stands going to low risk, however, as with the FNF, most of these stands originate as moderate risk. No action resulted in increased numbers of stands in high risk over time. Due to the climate and inventory differences between the ONF and the FNF, the Wildfire simulation on the ONF did not result in near total mortality to all forest inventories as it did in the FNF. High and Moderate risk forests in the ONF retained a mean TPA of 40 after wildfire with 71.3% reduced to low risk.
![]()
The high fire risk stands represent the highest level of fuel and the most critical opportunity for fire risk reduction. Simulations indicate that risk reduction under such conditions is maximized with the BA 45 treatment. Figure 13 shows the response to treatment with regeneration included in the simulations. This is equivalent to thinning and not planning any follow up maintenance of fire risk in the form of thinning or burning included in the management plan. Elevated risk levels begin to reappear in treated stands on the ONF after 15-25 years suggesting that future fuel removal entries are necessary to control fire risk.
Figure 14 shows the results when regeneration is excluded from the simulations. Exclusion of regeneration is intended to demonstrate treatment effectiveness when combined with future control of fuel build-up from ingrowth. BA 45 initially reduced high fire risk to low for 62.4% of the stands but, by the end of simulation period in 2030, 46% remained in low risk indicating a 16% increase in risk. Very few stands returned to high risk, however Error! Reference source not found. In 2030, only 5.1% of stands initially designated as high risk with BA 45 remained high risk. While there appears to some change over time from low to moderate risk without regeneration for Half BA and 9 and under very few stands regain high fire risk classification during the study period. This trend is different than what was observed on the FNF where slight reductions in risk occurred over time. The exception is the 12 and over stands that began as high risk. By the end of the simulation period 92% remained as high risk. Forests that were not treated, No action, remained as high risk. See Appendix B for the full set of fire risk response results.
One difference between Okanogan and Fremont is that
Okanogan high risk stands that are treated do not return to high
risk as soon after treatment as Fremont stands. The wildfire simulation
on the ONF does not completely burn up all the high risk stands
as does the wildfire simulation for the FNF. Some of the forest
stands on ONF are also further west and have a cooler and moister
climate. As a result, the fuel moisture content in many high fire
risk ONF stands is higher and therefore is less susceptible to complete
combustion from wildfire than the stands in the FNF.
Table 6 ONF fire risk reduction treatment metrics
![]()
 |
|
Figure 13 ONF High Fire
Risk Response to Six Simulations with Regeneration
|
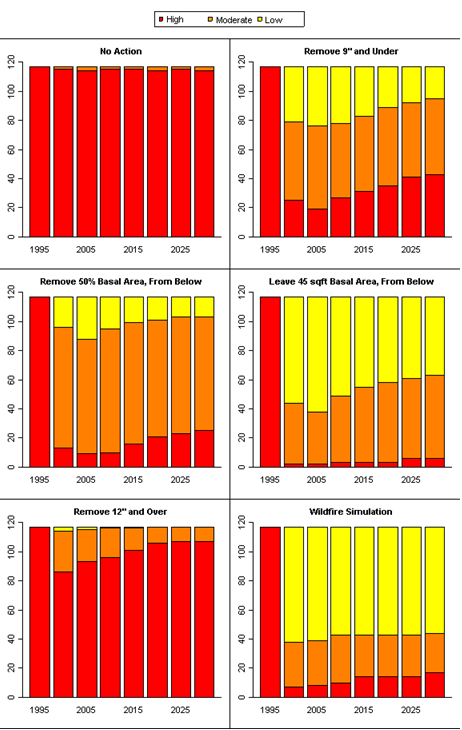 |
| Figure 14 ONF High Fire Risk Response with No Regeneration after Treatment. |
![]()
4.2 Economic results
FNF Economics results
The mean, minimum, and maximum net revenue economic results from harvest simulations are displayed in $/acre for both high and moderate fire risk stands in FNF in Table 7. The economic results of this analysis show that 9 and under has an average net cost to the USFS with both high and low logging costs scenarios on the FNF. The 12 and over provides significant revenue with both high and low logging costs used in this analysis. The other two thinning treatments, Half BA and BA 45, provide positive revenues with low logging costs on the FNF, but have negative revenues with high logging costs applied to treatment simulations.
Table 7 FNF
mean net revenue for high and moderate risk with high and low costs
| Treatment |
High Cost Mean
|
High Cost Minimum
|
High Cost Maximum
|
Low Cost Mean
|
Low Cost Minimum
|
Low Cost Maximum
|
| 9 and under |
($374)
|
($1,132)
|
$92
|
($134)
|
($466)
|
$240
|
| Half BA |
($319)
|
($1,309)
|
$1,270
|
$139
|
($569)
|
$2,683
|
| BA 45 |
($168)
|
($2,015)
|
$3,885
|
$529
|
($770)
|
$6,241
|
| 12 and over |
$1,244
|
($1,857)
|
$8,270
|
$2,198
|
($765)
|
$11,414
|
The economic analysis of net revenue for each thinning treatment simulation has a range of results demonstrated in Figure 15 A and B. See Appendix A for the full set of economic results for FNF. The high risk stands treated with BA 45 with high logging costs are very close to neutral revenue which indicates that on many stands the value of the logs removed will cover the costs of the risk reduction. High risk stands treated with BA 45 and with low logging costs produce positive revenues with very few stands modeling negative net revenue. The Half BA treatment appears to generate modest positive returns with low cost assumptions while the high cost assumptions result in negative net revenues. The 9 and under treatment remains a negative net revenue with both high and low costs for all risk categories. Treating the high risk stands is more likely to result in positive returns than treating the moderate risk stands because generally high risk treatments yield greater saw log volumes than do moderate risk stands.
![]()
 |
 |
|
A
|
B
|
| Figure 15 A and B FNF Net Revenue High and Moderate Risk Low Costs | |
 |
 |
|
A
|
B
|
| Figure 16 A and B FNF Net Revenue High and Moderate Risk High Costs | |
ONF Economics results for the entire forest and each fire risk
The results of average net revenue per acre for high and moderate risk stands in ONF are shown in Table 8. The economic results of this analysis show that for high and moderate risk stands on the ONF, the 9 and under and the Half BA treatments have an average net cost to the USFS under both high and low logging costs scenarios. However, the Half BA treatment is close to breakeven with low logging costs. The 12 and over thinning is the only treatment that provides revenue with both high and low logging costs used in this analysis. But all of the other three thinning treatments have some stands with positive net revenue. The BA 45 average net revenue is positive with low logging costs on the ONF but has an average cost of $169/acre to thin with high logging costs Table 8.
![]()
Table 8 ONF
mean net revenue for high and moderate risk with high and low costs
| Treatment |
High Cost Mean
|
High Cost Minimum
|
High Cost Maximum
|
Low Cost Mean
|
Low Cost Minimum
|
Low Cost Maximum
|
| 9 and under |
($345)
|
($892)
|
$67
|
($287)
|
($625)
|
$270
|
| Half BA |
($265)
|
($946)
|
$953
|
($39)
|
($618)
|
$2,110
|
| BA 45 |
($169)
|
($1,160)
|
$2,660
|
$291
|
($598)
|
$5,191
|
| 12 and over |
$1,025
|
($331)
|
$7,358
|
$1,953
|
$4
|
$11,113
|
The economic analysis of high fire risk stands revenue by treatment simulation has a range of results displayed in Figure 17 and Figure 18. See Appendix B for the full set of economic results. Only the 12 and over treatment has positive net revenue with both high and low logging costs for both high and moderate risk classes. BA 45 treatment has positive net revenue with low logging costs for both high and moderate risk classes but not for high cost assumptions. The Half BA has marginally negative returns for all cases. The 9 and under treatment generates average negative net revenues with high and low costs for both risk classes.
 |
 |
|
A
|
B
|
| Figure 17 A and B ONF High and Moderate Risk Net Revenue with Low Cost | |
 |
 |
|
A
|
B
|
| Figure 18 A and B ONF Net Revenue High and Moderate Risk with High Costs | |
![]()
4.3 Cost to fight fire on the Fremont and Okanogan National Forests
The FNF and ONF have forest fire fighting costs depending upon fire size and conditions that can range from $300 to almost $11,000/acre. These figures do not include suppression costs to states, counties, or municipalities nor do they include losses of forest resources and property. The closer to the wildland/urban interface generally the greater the fire fighting cost. Individual large forest fires may cost as much as $1,000,000/day due to large numbers of ground crews and expensive ground and air equipment (local interviews 2002). Fire fighting cost trends appear to be increasing as fires become more explosive and impossible to control (United States National Interagency Fire Center 2002). In addition to fire fighting costs, once the fire is out, regeneration and restoration projects can be problematic and add more costs. Individuals in the local communities and Forest Service agree that the alternative to thinning overstocked forests will be spending billions of dollars over the next 100 years to fight wildfire (local interviews 2002). In figure 25, fire fighting costs for 1992-2002 are displayed as averages by year/magnitude for the Fremont National Forest. The average cost/acre has been calculated and displayed with the discounted average cost/acre based upon a 30 and 60 year return cycle at a 5.0% discount rate. The discounted costs are presented here to demonstrate that if an equal number of acres burned every year such that all acres were burned by the end of the discount period (in this case either 30 or 60 years) then the net present cost outlay would be $564/acre or $271/acre. Since a majority of stands on both forests are in high to moderate risk classifications and most stands are well outside of historic fire return intervals, it should not be unreasonable to speculate that all or at least most acres might burn within a discrete future period. Such cost estimates can serve as value indicators that are important when forest managers must decide on the level of stewardship investment (negative return fuel reduction treatments) that is appropriate to avoid the estimated cost exposure of high risk forest conditions.
 |
| Figure 19 Gross fire fighting costs by magnitude for 1992-2002. |
![]()
Average fire suppression costs/acre 1992-2002 for the FNF are presented in figure 26. The need for expensive fire suppression efforts has resulted in increases to FS fire suppression budget. Ironically, however, forest management budgets (funding that is needed to support fire risk reductions through fuels removal treatments) are shrinking (Michaels and Evans 2003). In 2002, 125,000 acres of forest burned on the FNF. Forest silviculturalists and fire scientists report that where prior fuel reduction activities had been undertaken, forest fires dropped to the ground and burned with low intensity(Michaels and Evans 2003). Where fuel loads had not been reduced fires increased intensity and consumed the crowns (local interviews 2002). These anecdotal observations agree with wildfire simulations conducted as part of this investigation. All stands in high and moderate risk classes (78% of the total FNF area studied) would experience near total mortality in the event of a wildfire. The total precommercial thinning budget for the Fremont Winema National Forest combined for thinning non merchantable trees was $1,020,000 in contrast to much higher fire fighting costs (Michaels and Evans 2003).
 |
| Figure 20 FNF Fire Suppression average costs/acre by magnitude for 1992-2002 |
Okanogan has experienced similar costs associated with fighting
fire as those reported by the FNF. Actual costs by fire size are
shown in figure 26 (Burdick 2002). Both forests display the common
trend of higher costs/acre for smaller fires, which are often in
the wildland/urban interface. However, an increasing number of large
forest fires has resulted in suppression costs in the $ millions/year
for both national forests. The total fire suppression costs for
the Forest Service for Okanogan-Wenatchee was $11,024,200 in 2001
and $12,552,000 in 2002. These figures do not account for the state,
county and private fire suppression costs or loss of valuable resources.
They do include the funding of the initial attack resources, heat
and light, administration costs, fire management personnel, etc.
![]()
 |
| Figure 21 OWNF Fire Suppression average costs/acre 1990-2002 |
![]()
5. Discussion
5.1 Fire Risk
Analysis of 1995 CVS data utilizing the USFS models FFE and FVS shows that 30.7% of the FNF and 28.3% of the ONF are in high fire risk classification. These high fire risk stands have the potential of a ground fire moving into the crown at wind speeds less than 25 MPH. In reports issued in 2001 and 2002 the Western Governors Association refers to forests of the intermountain West as urgently in need of treatments to reduce hazardous fuel loads (USDA Forest Service U.S. Dept. of Interior and Western Governors' Association 2001). A Density Management white paper by USFS suggests the backlog of high fire risk forests will increase by 13% on USFS land over the next 5 years (Powell et al. 2001).
The No Action growth simulations for both forests experience gradual increases in fire risk over time. Risk increases appear to be more dramatic for the ONF. No Action assumes no forest fire or treatment in any stand during the simulation period of 1995-2030. While this assumption of no disturbance is historically unrealistic, there is comparative benefit from being able to review No Action outcomes against other treatment alternatives. For this study both No Action and Wildfire simulations act as dual controls to establish a range of consequences that could result if hazardous fuel removals are not undertaken.
The Wildfire simulations assume that everything burns in the same treatment year. As with No Action this assumption is also historically unrealistic. However, modeling the comparative behavior of wildfire in the different risk classes of the two different forests provides valuable insights that substantiate estimates of the severity of fire event consequences. Such estimates could be helpful, for instance, to foresters attempting to balance risk of No Action against the costs and benefits of treatments.
There are four silviculture treatment alternatives that are used in this study. They were chosen to represent varying harvest intensities and to produce simulation outputs that could be readily comparable to those produced by other fuel reduction treatment research projects. Additional treatment alternatives could certainly be developed for more customized approaches to individual stand conditions. The treatment simulations presented in this thesis are used to demonstrate a useful modeling methodology to assist Forest Service silviculturalists and to assist better understanding of the treatment effectiveness sensitivities inherent in fuel reduction activities.
One treatment has a fixed density target of BA 45 that is independent of initial density condition. Another treatment has a variable density target of Half BA. Two other treatments are designed to take either small material from below (9 & under) or large material from above (12 & over). By comparing the outcomes of these treatment alternatives, multiple insights may be gained. It is clear, for example, that for some stands the 9 & under does not reduce risk as effectively as the Half BA or the BA45. This would indicate that on some stands, in order to insure successful fuel reduction treatment, more trees (some that are larger) than just the 9" and smaller DBH trees will need to be removed. The simulations in this investigation show that in many cases the additional numbers of stems that are removed to meet the Half BA or BA 45 targets are only a few more trees than the lighter touch treatment of 9 and under. Depending upon the initial pretreatment basal area, the Half BA or BA 45 may be more successful at achieving density and risk reductions. For example, when initial basal area is less than 90 sqft./acre, Half BA will result in greater density reductions (lower risk) than the fixed target of 45 sqft/acre. But when initial BA is greater than 90 sqft./acre then the BA 45 will likely result in greater density reductions. In cases where there are few TPA greater than 9" DBH, the 9 and under will result in the greatest density reduction. Conversely the 12 and up would result in greatest density reduction if most trees are over 12" DBH. The inventory data for both of the study forests indicates that the high and moderate risk areas of both forests have a majority of trees/acre with DBH less than or equal to 9". The pretreatment mean QMD for high and moderate risk areas of the FNF is 6.4". The pretreatment mean stems per acre for the high and moderate risk areas of the Fremont equals 940 TPA of which 93% are less than or equal to 9". The pretreatment mean QMD for high and moderate risk areas of the ONF is 5.3'. The pretreatment mean stems per acre for the high and moderate risk areas of the Okanogan equals 1153 TPA of which 94.3% are less than or equal to 9".
![]()
In some areas of forest the 9 and under treatment appears to be effective in reducing risk (22.1% of high and moderate stands in the FNF were reduced to low risk with this treatment and 35.0% of high and moderate stands in the ONF were reduced to low risk with this treatment). For a few stands, 9 and under may even generate positive economic returns although the mean economic returns for both forests with this treatment for either high or low cost assumptions were negative (Low cost FNF -$134/acre, Low cost ONF -$287/acre, High cost FNF -$374/acre, High cost ONF-$345/acre) . In stands where the 9 and under treatment is effective this treatment could be a desirable alternative to the other options. However, this treatment is costly and does not appear to be as effective for overall risk reduction as either the Half BA or the BA 45 treatment.
Thinning to a variable density target of half the pretreatment basal area (Half BA) proved to be an effective treatment in many of the stands (55.4% of high and moderate stands in the FNF were reduced to low risk with this treatment; 56.2% of high and moderate stands in the ONF were reduced to low risk with this treatment). Economic performance for this treatment differed by forest. The FNF showed a modest positive return ($139/acre) for low cost assumptions but had a negative return (-$319/acre) for high cost assumptions. Half BA has negative returns (Low cost -$39/acre, High cost -$265/acre) for both cost assumptions on the ONF.
Half BA performed better than the 9 and under treatment for both risk reduction and economic return but did not do as well as BA 45 for either performance metric. Thinning to a target BA 45 appears to be generally the most effective and cost conservative approach to fuel reduction treatments. When treated with the BA 45 alternative the high and moderate risk stands had 63.8% of stands reduced to low risk on the Fremont and 72.6% of total stands reduced to low risk on the Okanogan. With low cost assumptions BA 45 resulted in positive economic returns on both forests (Low cost FNF $529/acre, Low cost ONF $291/acre) but with high cost assumptions this treatment had negative returns on both forests (High cost FNF -$168/acre, High cost ONF -$169/acre).
The 12 and over treatment was simulated with little expectation that this treatment alternative would be very effective for fire risk reduction. This treatment does not remove any small diameter ladder fuels. In many respects this treatment resembles the historic harvest practices from the late 19th century to mid 20th century that have contributed to the present risk condition. However, the 12 and over simulations are very useful to reveal some interesting characteristics of these forests. While risk reductions successes were few the mean economic returns that resulted from this treatment were considerable (Low cost FNF $2198/acre, Low cost ONF $1953/acre, High cost FNF -$1244/acre, High cost ONF -$1025/acre). The positive revenues that result from this treatment may be considered as a conservative estimate of the value of forest resources that could be lost to wildfire. By multiplying the number of plots for each forest by the CVS acreage expansion factor of 1849.6, the total acreage represented by the data for each forest can be determined. When this acreage estimate is multiplied by the mean economic returns/acre generated by the 12 and over simulation an estimated range of forest value that is at risk from wildfire can be calculated. Since no value is credited for trees smaller than 12" DBH this methodology should produce a very conservative value estimate. Based upon such calculation, the high and moderate risk areas of the Fremont National Forest (721,344 acres represented by 390 plots) would have a resource value of between $900 million and $1.6 billion while the high and moderate risk areas of the Okanogan National Forest (586,323 acres represented by 317 plots) would have a resource value of between $600 million and $1.2 billion.
Also of interest; the additional trees removed in Half BA and BA 45 (both of which are from below with the exception that the BA 45 leaves all ponderosa pine on the FNF and all ponderosa pine and western larch on the ONF) beyond the number of trees removed in the 9 and under treatment, amount to only 23 TPA and 3 TPA respectively for Half BA and BA 45 in the high and moderate risk areas on the FNF. For the mean change represented here, the analysis would indicate that the additional trees are less than 12" DBH for most cases and that the 40-60 largest diameter TPA in each stand remain standing post treatment. The data indicate that the number of leave trees in Half BA and BA 45 treatments is greater than the number of 12' and larger trees indicating that in the average stand all 12' and larger trees are left standing. These few extra harvested trees appear to result in much greater risk reduction and better economics.
On the high and moderate areas of the Okanogan, the mean post treatment TPA for Half BA when compared to 9 and under is reduced by 3 TPA, however, for the BA 45 the mean TPA of leave trees is actually 51 trees more than the 9 and under indicating that in this case less stems may have been taken. Also the median post harvest TPA for BA 45 is 24 trees less than 9 and under, suggesting a skewed distribution has obscured results. It is important to remember as well that the BA 45 treatment requires that all ponderosa pine and larch be left to develop into a desired future condition. In some cases leaving these species will mean that more and possibly larger overstory trees of other species are taken in order to save the desired leave trees and still meet the BA target. This analysis appears to indicate that on both forests some combination of the three thin from below treatments, customized to individual stand conditions, could remove much of the present forest fire risk at low cost or even positive return. Other studies such as, "A strategic assessment of fire hazard in Montana" (Fiedler et al. 2001) have found similar results.
There is a difference between "with regeneration"
and "without regeneration" simulation results. The "without
regeneration" simulates the effectiveness of each treatment
with an assumed management strategy, such as control burning or
follow up thinning treatment, to prevent risk build-up from the
development of understory ladder fuels resulting from regeneration.
The "with regeneration" simulation is to represent the
forest risk response with no follow up treatments to control ingrowth
after the initial fuel reduction. The "with regeneration"
simulation shows that risk reduction effectiveness lasts for about
10 years before the risk level increases again. Maintenance of forests
in lower risk status will require fuel removal treatments or controlled
burns as a necessary component of landscape planning. While the
specific implications of ingrowth control are beyond the scope of
this study, it is important to recognize that continuing and possibly
costly management will be required to keep forest fire risk levels
under control.
Treatment planning may be assisted by use of these model results
to align the risk reduction, the duration of reduction, and the
economic results to achieve the most effective combination of treatments
across the landscape over time.
![]()
5.2 Economics
Thinning to reduce fire risk has been considered to be costly because of the low value of small diameter logs (Wagner et al. 1998). The economic results in this analysis show that thinning treatments such as BA 45 and Half BA that are most effective for risk reduction may also be cost neutral or revenue positive in many situations
Table 7 and Table 8. The fire risk reduction results from the FFE output and economic analysis developed for this investigation show that lighter touch fuel reduction treatments such as 9 and under may be costly and are not as effective at reducing risk as less costly alternatives such as BA 45 and Half BA.
These results also show the Half BA and BA 45 thinning treatments have the potential to effectively reduce fire risk while returning timber revenues to the government. Under present market conditions, completing low intensity treatments such as the 9 and under will likely require some form of compensating contract or service agreement to carry a high cost of treatment.
When some stand treatments prove to be unavoidably costly, stands with negative returns can be paired with other stands that will yield positive returns. The potential package could be treated as a stewardship contract in which the cost to treat some stands is offset by the returned value of treating other stands.
Another strategic management option for the negative revenue stands could be as a focus for retention areas if such stands provide desirable environmental benefits for wildlife habitat, recreation, or aesthetic values. It will be important to identify those high and moderate risk stands that because of such special circumstances will not be selected for risk reduction treatments. To protect these sensitive areas it may be desirable to prioritize revenue generating fuels removals in adjacent stands to create protective fire breaks.
 |
 |
|
A
|
B
|
| Figure 22 A and B FNF ONF High and Moderate Net Return Low and High costs | |
Results show BA 45 to generally be the most effective risk reduction treatment at the least cost. On the Fremont National Forest the high and moderate risk stands have a higher average net return of $529/acre Table 7. On the Okanogan National Forests the high and moderate fire risk stands average $291/acre revenue with low logging costs.
![]()
Small Diameter Fuel Removal Infrastructure
Sustainability of risk reduction strategies will be dependent upon viable log markets, local harvest contractors and accessible manufacturing infrastructure. In many areas of the inland west these resources may be in decline. For example longer haul distances in the Okanogan area increase operations costs and reduce ability of the Forest Service to treat some areas that are at risk. The development of needed local infrastructure to harvest and utilize logs from fuel reduction activities will require confidence from local investors that raw material supplies and operational opportunities will be available in the future. Assurances from the federal government that fuel reduction activities levels will be sufficient and enduring will be a necessary part of a multiple-year fuel reduction strategy.
Long term stewardship contracts are one vehicle that might be useful. A steady supply of work and contracts will reduce costs of fuel removal and improve local economies. Presently some mills in the Fremont area shut down and send the employees home for part of the year when there is not a consistent supply of raw material to run the mill (local interviews 2002). In the Okanogan area, many mills have closed as harvest activity has slowed.
The infrastructure available to remove wood in these two inland communities is constantly changing. Many small mills, and loggers report that work opportunities are sporadic and shut downs are common. Interview respondents suggest such circumstances are due to several factors including high costs of operation and an inconsistent supply of contract opportunities for operating on Forest Service land. Interviews with USFS personnel and the local workforce suggest that respondents believe there to be untapped opportunities to save costs and perform environmentally sensitive and economically profitable thinning operations for fire risk reduction. Local interviews and government reports agree; harvest operations are needed to reduce fuel loads and treatments will need follow-up ingrowth controls such as controlled burns to reinitiate shorter fire return cycle.
There were a variety of related experiences and opinions collected during the course of interviews for this investigation. One consensus among respondents familiar with the federal timber sale program is that USFS timber sales sometimes receive no bids because of the bidder concerns about cruise volume accuracies and/or high minimum bid requirements. In contrast, the USFS foresters suggested that some timber sales do not receive bids because market conditions are poor. Both groups agree, however, that there are untapped costs savings available with better collaboration on sale design between the Forest Service and harvesting contractors. Interviews results indicate that contractors suggest that operations on other ownerships that are more flexible such are likely to achieve landowner objectives better and at less cost than present Forest Service timber sales or service contracts. However, the Forest Service has recently begun to experiment with innovative contract designs directed toward greater contract flexibility as part of what is being called End Result Stewardship Contracting.
Prescribed Burning Costs
There are additional costs associated with managing high fire risk forests beyond an initial mechanical fuel removal treatment. The cost of maintaining a reduced fire risk includes prescribed burning costs. For example, assume the Fremont National Forest prescribed fire cycle should be about every 10 years or before risk levels begin to increase. Assuming $90/acre to treat stands with prescribed fire every 10 years after treatment at a 5% discount rate the net present cost of prescribed burning is $143/acre for FNF. Perhaps the wetter Okanogan National Forest does not require as frequent of a prescribed fire cycle. Assuming $100/acre to treat stands every 20 years at a 5% discount rate the net present cost of prescribed burning for ONF would be $60/acre. These anticipated costs should be important considerations for long-term forest planning such as reforestation has been considered in the past. Since 1930, the Forest Service has maintained the Knutson-Vandenberg Fund (KV Fund) from which funds deposited by timber sale purchasers are used to cover the costs of reforestation, timber stand improvements, and special cultural measures to improve renewable resources. Contributions into an enduring funding mechanism, such as the KV Fund held, within each ranger district for expenditures as necessary to control fuel loads, will be needed from fuel reduction harvest revenues or Congressional appropriations if a stable long-term program to avoid catastrophic forest fires is to be successful.
![]()
Small Diameter Timber Products
There are many potential small diameter timber (SDT) uses available to process material from fuel removal thinning treatments. The analysis in this investigation only assesses the product value associated with the merchantable logs removed and sold into existing current markets. The majority of stems removed to reduce fuel loads are from overstocked stands which predominately produce small-diameter timber with low value that may not be greater than costs to harvest, transport and process (Wagner et al. 1998). SDT has variable size limits dependent on the local market. However, there are markets for effective use of small-diameter and underutilized wood, such as traditional sawn lumber, engineered wood products, biomass to energy, local crafts industries, and others. Processing costs can be low for products such as roundwood SDT (Levan-Green and Livingston 2001). There are also evaluations of the value of SDT compared with larger wood to understand the cost or value of thinning an overstocked stand (Chmelik et al. 2003). There are several methods for valuing a log. Three methods of calculating gross product value of logs evaluated in the Pacific Northwest are the direct, intermediate and detailed method (Nagubadi et al. 2003).
It is important to understand the relationship of the wood products that may be available in each overstocked forest, the distance to the market, and silvicultural treatment needed to improve forest health. By assessing these three important variables before thinning each treatment of SDT may be more efficiently and economically distributed. There are three product categories that use SDT: 1)energy/chemical, 2)fiber/particle, and 3)solid products (Barbour and Fight 2002).
Marketing and standardized processing of SDT may determine the long-term success of utilizing large volumes of this material over the next several decades. Value-added wood products such as doors, windows, molding, and flooring, may provide opportunities to make processing SDT profitable if marketed effectively (Punches 2002). It is important to understand the uses and grading standards of SDT to market the products effectively (Stern 2001). Guidelines need to be developed and agreed upon for use and specifications of SDT for construction (Wolfe 2000). These factors are all practical business issues that influence the value and demand for small-diameter timber.
Biomass to energy facilities are another potential use of small diameter timber. Clean and sustainable sources of energy that are available from utilization of wood biomass as an alternative to fossil fuels are needed in the inland west. There may be opportunities to develop biomass to energy facilities in rural communities if consistent supplies of wood biomass are available. The Collins Pine Company which owns a sawmill in Lakeview, Oregon has expressed interest in building a cogeneration plant to use small diameter wood from the FNF. A $30 million investment requiring a 20 year return on investment will be needed to build a 30 megawatt plant. Such a facility could create jobs, clean electricity, and create a market for wood biomass from forest fuel reduction treatments. However, investments of this magnitude are unlikely without federal biomass supply assurances. Additional local economic development opportunities are created through demand for jobs in the woods to remove excessive fuel loads. According to a Fremont National Forest Report issued on 12/19/2002, estimated job multipliers for harvest activities are 8 direct and 16 indirect jobs created per MMBF/year of logs that are harvested (Fremont National Forest 2002). Table 9 shows the opportunities for job creation around FNF based on the amount of merchantable and pulp wood removed from the most conservative thinning, 9 and under, for moderate and high risk stands.
Table 9 FNF
MMBF available/year and direct and indirect jobs from fuel reductions
|
MMBF Available/Year
|
Direct Jobs/Year
|
Indirect Jobs/Year
|
|
| All volume for 10 years |
107
|
858
|
1716
|
| All volume for 20 years |
54
|
429
|
858
|
| Pulp volume only for 10 years |
79
|
630
|
1260
|
| Pulp volume only for 20 years |
39
|
315
|
630
|
![]()
Non-Market Benefits of Fuel Removal Thinning
The economic results of this analysis do not include non-market benefits. However, there are several important factors which impact the community and forest when the fire risk is reduced and the negative impacts of wildfire are avoided. The first six benefits should be readily recognized results of reducing high fire risk in western forests through fuel removal treatments. The additional benefits are variable based on the proximity of the forest to communities, the intensity of the wildfire, and the perceived public value of water, carbon accounting, and green electricity.
- Additional Jobs provided from fuel removal activities
- Reduced fire fighting cost
- Reduced fatalities
- Reduced facility loss
- Reduced loss of timber and habitat
- Regeneration and restoration cost savings
- Carbon sequestration
- Green energy credits
- Electrical transmission cost savings
- Water saved from reduced density
- Rural community value of fire risk reduction
- State tax receipts from economic activity
6. Conclusion
USFS models FFE and FVS were used to assess fire risk and the cost per acre of hazardous fuel reduction treatment alternatives for Fremont and Okanogan National Forests. Results indicate that some fuel removal treatments can produce positive net revenue in many high and moderate fire risk stands. The Null Hypothesis (There is little potential for positive net revenue from logs sales that will result from harvest activities designed to reduce fire risk in moderate to high risk inland west forests), should be rejected based on the results of this study.
- Fuel removal thinning to reduce fire risk may produce positive net revenue
- New Stewardship Contracting authorities such as long term contracts and designation by description are two examples of many potential opportunities to reduce fuel removal costs and sustain local infrastructure.
- Long term supply assurances will encourage investment in infrastructure
- There are market and non-market benefits from fuel reductions that are not generally considered when assessing federal expenditures for risk reduction.
- When all costs and benefits are considered what may appear as short term losses actually may be investments in positive long term savings.
The USFS employees and contractors have many of the same insights
and suggestions for local solutions to reduce fuel in high fire
risk forests. There is general agreement that streamlining the process
and the contract requirements could result in improved operations
at less cost (Kauffman 2001). For example many contractors are confident
that hazardous fuel reductions can be performed with operator selection
of take trees to conform to silvicultural descriptions stipulated
in a contract description. The Forest Service is experimenting with
this approach and others as it develops new strategies for stewardship
contracting, recently authorized by congress (The Pinchot Institute
for Conservation 2002). Historically, opportunities for innovative
approaches to fuel removals have been limited by inflexible contracting
constraints for both timber sales and service contracts (local interviews
2002).
Without available raw material supplies, mills close. Manufacturing infrastructure is needed to utilize logs developed by fuel reduction activities. Prices paid by the manufacturing sector for logs are important to cover costs of fuel reduction treatments. An increasing number of mill closures will require transportation of logs greater distances to fewer mills. Greater haul distances mean greater costs for hazardous fuel reductions. Greater costs for hazardous fuel reductions ultimately mean less acres get treated and forest fire risks remain high. Development of new infrastructure such as biomass-to-energy facilities to utilize otherwise non merchantable wood biomass represents an important environmental and economic opportunity. However, there must be confidence that consistent biomass volumes will be available in order to attract new investments in biomass conversion opportunities. Long term contracts are a possible opportunity to support investment.
Based on the results of the simulations on the Fremont National Forest and Okanogan National Forest the high fire risk stands could be treated at no cost to the government. Break even or positive net revenue treatment results could be further insured with increased investment in local harvest and manufacturing infrastructure.
Present levels of fuel loads are historically unprecedented resulting in increased frequency and intensity of wildfire. Results of this study show that in the FNF 77.8% of forests are at high to moderate risk and that 76.6% of Okanogan forests are at high to moderate risk. However, some hazardous fuels reduction treatments can effectively reduce the risk of wildfires that kill the overstory trees and on many stands can generate positive revenues from timber sales. Appropriate thinning and burning treatments may provide economic opportunities for rural communities, protect habitat for threatened and endangered species of wildlife, reduce carbon emission, improve carbon sequestration, and reduce the threat of wildfire to the forest ecosystem and surrounding communities.
An additional goal of this investigation has been to present a technical methodology to assist forest managers in quick evaluation of forest fire risk distributions and potential treatment alternatives across broad landscapes. Without technology to assist such analysis, the complexity of forest planning for hundreds of thousands of acres is daunting. Technical modeling capabilities provide beneficial assistance to foresters that must communicate management choices to involved lay publics so that they might better understand the consequences of treatment alternatives or no action.
![]()
7. Future work
Future work, outside of the scope of this project, could utilize the technological capabilities showcased in this thesis to develop a process to prioritize stands that need treatment immediately. This prioritization could include a series of queries such as:
- What are the most strategic configurations of treated stands across the landscape?
- What spatial intensity and proximity of treatment is required to restore and maintain frequent low intensity understory fire regimes?
- Could using the FFE fire risk classification results to identify high priority treatment areas help to identify stands most in need of treatment?
- Will FFE, when combined with economic analysis, assist foresters in crafting innovative approaches to greatest risk reduction at least cost?
Findings from simulations will need to be cross referenced with insights from field foresters familiar with the forest. Additional decision support tools are also needed to assist a fire scientist, forester, or harvest planner to integrate management goals and more effectively interact with interested publics. Such tools might include wildlife, hydrological, soil, weather and carbon models that are linked together for integrated forest management planning. For example, GIS tools that combine the topography and climate data with the inventory information to model the interactions of spatial characteristics such as wind direction, soil conditions, aspect, etc. with crowning index risk assessments against treatment costs will help to integrate management targets most effectively.
Developments in technology such as the World Wide Web create opportunities
for broader and higher quality communication about forest management
alternatives with interested publics. An investment in standardized
web delivery of information could increase the outreach capabilities
of the USDA Forest Service while reducing the costs and time associated
with the public review process. A transparent planning process will
be needed to restore public confidence in Forest Service management
capabilities.
![]()
Bibliography
- Agee, J. K. 1993. Fire Ecology of Pacific Northwest Forests.
Island Press, WA D.C.
- Arno, S. F. 1996. The seminal importance of fire in ecosystem
management. In: hardy, C.C.; Arno, S.F., eds. The use of fire
in forest restoration. GTR-INT-341. USDA Forest Service. 3-5.,
USDA Forest Service.
- Arno, S. F. 2000. Fire in Western Forest Ecosystems: Chapter
5 in: Brown, James K.; Smith, Jane Kapler, eds. 2000. Wildland
fire in ecosystems: effects of fire on flora. Gen. Tech. Rep.
Gen. Tech. Rep. RMRS-GTR-42-vol. 2. . 257p, USDA Forest Service,
http://www.fs.fed.us/rm/pubs/rmrs_gtr42_2.html.
- Babbitt, B., and D. Glickman. 2000. Managing the Impacts of
Wildfires on Communities and the Environment; A Report to the
President. http://www.fs.fed.us/fire/nfp/president.shtml.
- Barbour, J. B., and R. D. Fight. 2002. Financial Analysis and
Processing Options for Hazardous Fuel Reduction Integrated with
Silviculture, Harvesting and Evaluation of Business Opportunities.
02.PNW.B.1, USDA Forest Service PNW research station, Portland,
OR.
- Beukema et al. 2002. Fire and Fuels Extension to FVS. in,
USDA Forest Service, Intermountain Forest Range and Experiment
Station.
- Beukema, S. J., D. C. Greenough, C. E. Robinson, W. A. Kurtz,
E. D. Reinhart, N. L. Crookston, J. K. Brown, C. C. Hardy, and
A. R. Stage. 1997. An introduction to the Fire and Fuels Extension
to FVS. Pages 191-195 in R. Teck, M. Moeur, and J. Adams, editors.
Proceedings of the Forest Vegetation Simulator Conference, 1997
February 3-7. USDA Forest Service, Intermountain Forest Range
and Experiment Station, Fort Collins, CO.
- Burdick, J. 2002. email correspondence 2/10/02 with Burdick,
Jim. Assistant Fire Staff in Fire Planning for Okanogan &
Wenatchee National Forest.
- Chmelik, J. T., R. D. Fight, and J. B. Barbour. 2003. Softwood
Lumber Prices for Evaluation of Small-Diameter Timber Stands in
the Intermountain West. Research Note FPL-RN-0270, USDA Forest
Service Forest Products Laboratory.
- Cochran, P. H., and J. W. Barrett. 1998. Thirty-five-year growth
of thinned and unthinned ponderosa pine in the Methow Valley of
northern Washington. Res. Pap. PNW-RP-502., USDA Forest Service.
- Cooper, C. F. 1960. Changes in vegetation, structure, and growth
of southwestern pine forests since white settlement. Ecol. Monogr.:129-164.
- Crookston, N. L. 1990. User's Guide to the Event Monitor: Part
of Prognosis Model Version 6. GTR INT-275. GTR INT-275, USDA Forest
Service, Intermountain Research Station, Ogden, UT.
- Crookston, N. L., S. J. Beukema, and C. E. Robinson. 2002. Chapter
3 Users's Guide in The Fire and Fuels Extension to Foreste Vegetation
Simulator. RMRS-GTR-000, USDA Forest Service, Rocky Mountain Reseach
Station, Ogden, UT.
- Everett, R. L., R. Schellhaas, D. Keenum, D. Spurbeck, and P.
Ohlson. 2000. Fire history in ponderosa pine/Douglas-fir forests
on the east slope of the Washington Cascades. Forest Ecology and
Management:207-225.

- Fiedler, C., C. Keegan III, C. Woodall, T. Morgan, S. Robertson,
and J. Chmelik. 2001. A strategic assessment of fire hazard in
Montana. Bureau of Business and Economic Research, Missoula, Montana,
http://www.bber.umt.edu/forestproducts/pdf/MTfirereport.pdf.
- Fremont National Forest. 2003. Interviews with Norm Michaels
and Mike Evans and website research.
- Huggard, C. J., and A. R. Gomez. 2001. Forests under fire. University
of Arizona Press, Tucson, AZ.
- Kauffman, M. 2001. The USDA Forest Service National Stewardship
Pilot Projects in the Pacific Northwest: The FY 2001 Report of
the Pacific Northwest Regional Multi-party Monitoring and Evaluation.
The Watershed Research and Training Center, Hayfork, CA, http://www.pinchot.org/pic/cbf/PNW_regional_FY01.PDF.
- Lake county. 2003. http://www.oregonsoutback.com/.
- Levan-Green, S. L., and J. Livingston. 2001. Exploring the Uses
for Small-Diameter Trees. Forest Products Journal 51:10-21.
- local interviews. 2002. Forest Service: Woody Woodell,
Sue Puddy, Norm Michaels, Richy Harrod, Michael Daugherty, Jody
Perose, Frank Puddy, Doug Coon, John Townsley, Tom Ketchum, Arlo
VanderWoude, Chris Anderson, Brad Flatten, Jan Flatten, Bob Gibbs,
Dave Azuma, Mike Evans, Richard Stubbs, David Eitner, James Burdick,
Myrna Duke, John Daily and Sally Estes.
- State land managers: Washington Department of Natural
Resources-John Calhoun, Dave Christenson, George Shelton, John
Tweedale, Roy Henderson, Judy Cline, Oregon Department of Forestry-Ed
Scheink, John Brown, John Pellissier.
- Private land managers: Whiskey Creek, Collins Pine, Hampton
tree farms, Boise Cascade
- Mills: Fremont Sawmill, Crown Pacific, and 7 mills who
wished to remain nameless.
- Contractors: John Lass Logging, Vargas Timber Cutting,
Dave Harmon Logging, M & L enterprises, John Shepard Logging,
Yankee Group, Bill Neubert Logging, Holly Mountain Resources,
11 contractors who wished to remain nameless.
- Industry, Environmental and Local Organizations: Ecosystem
Workforce Program-Charles Spencer and Cassandra Moseley, Sustainable
Northwest: Marcus Kauffman, Okanogan Communities Development Council-Mike
Ferris, Lake County Resources Iniative-Jim Walls and Bill Duke,
Defenders of Wildlife-Rick Brown, American Forest Resource Council-Chuck
Burley, Oregon Associated Loggers-Jim Giessinger, Washington Contract
Loggers Association-Bill Pickell, Chelan County PUD-Brett Bickford.
in.
- McCarter, J. B. 1997. Integrating forest inventory, growth and
yield and computer visualization into a landscape managment system.
Pages 159-167 in R. Teck, M. Moeur, and A. J., editors.
Forest Vegetation Simulator Conference. USDA Forest Service, Intermountain
Research Station, Ogden, Utah.
- McCarter, J. B. 2001. Integrating forest inventory, growth and
yield, and computer visualization into a landscape management
system. Dissertation University of Washington.
- McCarter, J. B., J. S. Wilson, P. J. Baker, J. L. Moffett, and
C. D. Oliver. 1998. Landscape Management through Integration of
Existing Tools and Emerging Technologies. Journal of Forestry
96:17-23.
- Michaels, N., and M. Evans. 2003. Fremont National Forest interview
2/25/03. in, Lake County, Oregon.
- Nagubadi, R. V., R. D. Fight, and J. B. Barbour. 2003. Valuing
a Log: Alternative Approaches. Research Note PNW-RN-541, USDA
Forest Service, Portland, OR.
- National Interagency Coordination Center. 2002. National Interagency
Coordination Center 2002 Statistics and Summary. in. National
Interagency Coordination Center, http://www.nifc.gov/news/2002_StatsSumm/intro_summary.pdf.
- Northeastern Cascades Late-Successional Reserve Assessment Team.
1998. An Assessment of the Northeastern Cascades Late-Successional
Reserves. USDA Forest Service Methow Valley Ranger District, Okanogan,
WA.
- Okanogan National Forest. 1989. Final Environmental Impact Statement,
Land and Resource Management Plan, Okanogan National Forest. USDA
Forest Service, Pacific Northwest Region, Okanogan, WA.
- Okanogan National Forest. 2003.
http://www.fs.fed.us/r6/okanogan/.
- Omi, P. N., and E. J. Martinson. 2002. Effect of Fuels Treatment
on Wildfire Severity. Joint Fire Sciences Program Report, http://www.cnr.colostate.edu/FS/westfire/FinalReport.pdf.
- Pfilf, R. J., J. F. Marker, and R. D. Averill. 2002. Forest
Health and Fire: An overview and evaluation. National Association
of Forest Service Retirees, Chantilly, VA, www.fxs.org/NAFSRforesthealth.pdf.
- Powell, D. C., V. A. Rockwell, J. J. Townsley, J. Booser, S.
P. Bulkin, T. H. Martin, B. Obedzinski, and F. Zensen. 2001. Forest
Density Management Recent History and trends for the Pacific Northwest
Region. R6-NR-TM-TP-05-01, USDA Forest Service.
- Punches, J. 2002. Evaluation of Small-Diameter Timber for Value-Added
Manufacturing: AN Integrated Approach. Oregon State University
Department of Wood Science and Engineering, Roseburng, OR.
- Pyne, S. J. 1982. Fire in America: Cultural History of Wildland
and Rural Fire. Princeton University Press.
- Pyne, S. J. 1997. America's Fires, Management on Wildlands and
Forests. Forest History Society, Durham, NC.
- Scott, J. H., and E. D. Reinhardt. 2001. Assessing crown fire
potential by linking models of surface and crown fire behavior.
Research Paper RMRS-RP-29, USDA Forest Service, Rocky Mountain
Research Station, Fort Collins, CO.
- Stage, A. R. 1973. Prognosis model for stand development. Research
Paper INT-137. Research Paper INT-137, USDA Forest Service, Intermountain
Forest and Range Experiment Station, Odgen, UT.
- Stern, G. E. 2001. Construction with Small-Diameter Roundwood.
Forest Products Journal 51:71-82.
- Stewart, J. L. 1988. Forest insects and disease research: what
is needed. Presentation to Western Forestry and Conservation Association
Pest Committee. in, Seattle, WA.
- Strohmaier, D. J. 2001. The seasons of fire. University of Nevada
Press, Las Vegas, NV.
- Swan, L. 2002. USDA Forest Service. in, Medford, OR.
- The Office of the President. 2002. Healthy Forests An Initiative
for Wildfire Prevention and Stronger Communities, http://www.whitehouse.gov/infocus/healthyforests/toc.html.
- United States National Interagency Fire Center. 2002. Wildland
Fire Statistics. in. http://www.nifc.gov/stats/wildlandfirestats.html.
- US Census Bureau. 2003. Oregon and Washington Statistics. http://www.census.gov/.
- USDA Forest Service. 2002a. Fire risk in East-side forests.
Pacific Northwest Research Station Science Update:11.
- USDA Forest Service. 2002b. The Process Predicament: How Statutory,
Regulatory, and Administrative Factors Affect National Forest
Management. USDA Forest Service, Washington, DC.
- USDA Forest Service U.S. Dept. of Interior and Western Governors'
Association. 2001. A Collaborative Approach for Reducing Wildfire
Risks to Communities and the Environment, Ten Year Comprehensive
Strategy. USDA Forest Service, U.S. Dept. of Interior, and Western
Governors' Association.
- USDA Forest Service USDI and Western Governors' Association.
2001. A Collaborative Approach for Reducing Wildfire Risks to
Communities and the Environment, Ten Year Comprehensive Strategy.
USDA Forest Service, U.S. Dept. of Interior, and Western Governors'
Association.
- Van Dyck, M. 2000. Keyword Reference Guide for the Forest Vegetation
Simulator. USDA Forest Service, WO-TM Service Center, Fort Collins,
CO.
- Wagner, F., C. E. Keegan, R. D. Fight, and S. Willits. 1998.
Potential for Small-Diameter Sawtimber Utilization by the Current
Sawmill Industry in Western North America. Forest Products Journal
48:30-34.
- Western Governors Association. 2001, 2002. Western Governors
Association: A Collaborative Approach for Reducing Wildlnad Fire
Risks to Communities and the Environment 10-Year Comprehensive
Strategy Implementation Plan.
- Wolfe, R. 2000. Research Challenges for Structural Use of Small-Diameter
Round Timbers. Forest Products Journal 50:21-29.
- Wykoff et al. 1982. Forest Vegetation Simulator model. in, Fort Collins, Colorado.
![]()

