 |
 |
 |
 |


Automating Contour-Based Route Projection
for
Preliminary Forest Road Designs Using GIS
|
Luke W. Rogers
University of Washington
AbstractAutomating Contour-Based Route Projection for Luke W. Rogers Chair of the Supervisory Committee: By evaluating alternative routes in the office using a pegging
routine, days or even weeks can be saved of valuable field time
and ultimately, a better design can emerge. Initial road design
in forested landscapes often includes pegging roads on large-scale
contour maps with dividers and an engineer’s scale. An automated
GIS based road-pegging tool (PEGGER) was developed to assist in
initial road planning by automating the road pegging process. PEGGER
is an extension for the commonly available GIS software ArcView®.
PEGGER imports topography as digital contours. The user identifies
the origin of the new road, clicks in the direction they want to
go and PEGGER automatically pegs in road at a specified grade.
Through the use of PEGGER, many alternatives can be quickly analyzed
for alignment, slope stability, grades and construction cost using
standard GIS functionality. The resulting cuts and fills are then
displayed in ROADVIEW, a road visualization package for ArcView®.
This paper looks at the algorithm used, evaluates it’s usefulness
in an operations planning environment and suggests additional methods
which might be incorporated into PEGGER to further assist the forest
engineer. Table of ContentsClick here for a PDF Version of this Thesis
List of Figures
PrefaceAs an undergraduate forest engineering student at the University of Washington I had the opportunity to spend two summers working for Washington’s largest forest products company. At Weyerhaeuser, I was impressed by the scale and depth of their geographic information system, but perplexed as to why the field foresters and engineers had relatively little access to these tools. Any request for information from the GIS specialists came back as hard-copy maps, even though the Company was willing to install desktop GIS software on the engineers’ computers. In my training as a forest engineer I learned how valuable tools like geographic information systems could be in guiding management decisions. I was exposed to many tools including clinometers, relaskopes, laser range-finders, geographic information systems, optimization programs, and much more. I soon became very interested in how all of these tools could work together to provide more informed decisions about how to better manage the forest and the necessary systems that support forest management. It was while working for those two summers that I realized there was a large disconnect between university research tools, optimization routines, and the needs of the field forester. This could not have been more apparent than in the manner in which roads were initially designed and subsequently located in the field. Typically, the engineer would look at a 1:4800 scale map (printed from a GIS), briefly glance at a stereo photo set, and then head to the field to locate a route in a trial and error method. While these engineers were very good at doing this, based on their many years of experience, I though there might be a better way. I thought it would be valuable to take advantage of desktop GIS software and provide some simple tools to help the forest engineer with initial route location. With that concept in mind, and a generous funding offer from the newly created UW Rural Technology Initiative, I started a masters program to design a tool that I would call PEGGER AcknowledgementsI would like to acknowledge Bruce Lippke and Larry Mason at the Rural Technology Initiative for their support of my work in designing PEGGER. The funding of my masters work through the Rural Technology Initiative encouraged me to design software that could be used by family forest land owners and their consultants. Creating complex tools with intuitive user-interfaces that can be used with little or no training is quite challenging. Far too often, University researchers forget the potential patrons of their research and create monstrous programs that rarely get used after their departure. So, I would like to thank the folks at RTI, and individuals like those at Google, for demonstrating that University research can be transformed into easy-to-use products. I would also like to acknowledge the dedication and hard working nature of both my masters committee chair Peter Schiess and my GIS mentor, Phil Hurvitz. Both of these gentlemen gave their time and knowledge freely to me over the years. I recall many late nights at Pack Forest and many long hours in the office working though both engineering and GIS challenges. It is the combination of these two guys experience and their willingness to share it that led me to design PEGGER. Thank you both for your interest in my education. Last, but certainly not least, I must thank my family for their support over the years. The financial support of my parents, Bill and Susie Rogers, and the emotional support of my wife Heather cannot be measured. It is one thing to commit your own time in pursuit of a goal, but to have others around you give their time on your behalf is quite another. Heather, this degree belongs to you as much as it does to me, thanks. I could not have done it without you!
DedicationI would like to dedicate this work to all of the wonderful men and women that work in forestry around the world. While there will always be controversy around the management of forests, it has become clear to me that the managers of those lands are the real environmentalists of the 21st century.
|
 |
| Figure 1 - A Daratech study summarized the top nine GIS firms' market share based on worldwide GIS revenue (software only) in 2001. |
ArcView GIS provides the Avenue programming language to write add-ons and scripts which can be packaged and installed as extensions. An extension written for ArcView using the Avenue programming language can be used on any platform that ArcView runs on. ArcView 3 products run on Microsoft Windows, Sun Solaris, SGI IRIX, Macintosh, IBM AIX, HP-UX and Compaq/Digital Tru64 UNIX. Taking advantage of the write once, run anywhere functionality of ArcView and the Avenue programming language is an attractive feature of writing an ArcView Extension.
With ArcView it is easy to integrate custom content into the help system to make a professional product which seamlessly integrates with ArcView. Seamless integration into the existing help system of ArcView means that if a user knows how to use ArcView they will be able to use an ArcView extension. Another reason to use ArcView and build this as and extension to ArcView rather than as a stand alone product was to take advantage of the data management and display functionality that is designed into any GIS. It also allows for the integration of other tools and datasets inherently. This allowed for more design time to be spent on ease of use and functionality rather than designing a new piece of software from scratch.
![]()
Pegging
With the growing availability of LIDAR and other high-resolution
topographic data, locating roads in the office is becoming a more
realistic and practical exercise. Within the GIS framework many
tools exist to locate geographic features, examine spatial relationships
among natural elements and act as a foundation for a decision support
system. Watson and Hill (1983) define a decision support system
as an “interactive system that provides the user with easy
access to decision models and data in order to support semi structured
and unstructured decision making tasks.” It is with the intention
of providing an initial decision support system that PEGGER was
developed.
PEGGER is an ArcView GIS extension that automates the route projection (“road pegging”) process for use by engineers and forest planners. One of the goals of the PEGGER project was to make the program as usable as possible for as many people as practical. One of the problems with technology is training users to use the software. Forestry professionals responsible for fieldwork have been slow to adopt new technology into their work largely due to the complexity of the software and the time commitment of training. The PEGGER program was designed to avoid these common pitfalls, requiring no training, minimal setup time and a simplified user interface. Included with the software are detailed and seamlessly integrated help files and a complete tutorial with sample datasets.
PEGGER imports topography as digital contours much like using a paper contour map. Standard tools available within ArcView GIS allow the user to import the contours from Shapefiles, ESRI coverages, AutoCAD dwg and dxf, and Microstation dgn files. In addition to importing data as digital contours, users can use the ArcView Spatial Analyst extension or other publicly available tools to convert USGS digital elevation models or LiDAR elevation models to contours. Contours were chosen as the preferred method of storing topographic surface information primarily because in using a vector based dataset, the user was not required to have either the ArcView Spatial Analyst or 3D Analyst Extensions. In addition, every attempt was made to automate the paper-based route projection process and avoid the perception of a black box technology. By simply automating a manual routine, it is possible that forest engineers and planners will have more confidence in their results.
 |
| Figure 2 - The simple PEGGER user interface in ArcView GIS 3. |
Once digital contours have been imported into ArcView the user must supply a few parameters, the road theme they would like to edit, the contour theme they would like to use as well as confirm the detected contour interval (Figure 3). In addition to the contour and road themes the user can have any number of other layers available in the GIS such as soils, slope classes, streams, wetlands, unstable slopes and property lines. Optionally, the user can maintain attribute information about the grade of the pegged segment and a road name.
![]()
 |
| Figure 3 – The simple PEGGER setup dialog where users specify the contour theme, elevation attribute, contour interval, and attribute preferences. |
The next step is to locate the desired beginning and/or endpoints of the new road given operational parameters. Using standard tools available in the GIS (ruler and identify) the user can estimate the necessary grade for the road. To start a road the user shift-clicks on the location where they wish to begin and enters the desired grade. To “peg” the road the user only has to click in the general direction they wish to go in order to project the route into the GIS. Successive clicks peg in additional segments of road from contour to contour as fast as the user can press the mouse buttons. Grade changes can be accomplished by using the Roads pull-down menu, using the PEGGER toolbar (Figure 4) or by right clicking the mouse and selecting Increase or Decrease Grade.
 |
| Figure 4 - The simple PEGGER toolbar where users can change the grade of the desired road segments and the name of the road. |
If the road fails to reach the desired end point, the previously pegged segments can be quickly deleted and a new grade can be tried. This method of trial and error that used to mean changing the divider spacing and erasing undesirable segments from the map can now be accomplished in the GIS in a fraction of the time.
![]()
Analytical Description
PEGGER works by identifying contour lines that meet a specific
set of criteria (Figure 5). Every projected route segment must
begin and end on a contour line. To project a segment the user
enters a desired grade and PEGGER looks for a point on an adjacent
contour line at a distance computed by:
d = ci / (g / 100)
where d = the distance,
ci = the contour interval, and
g = the desired grade.
NOTE: For pegging on paper maps, the distance would need to be multiplied by the map scale (ie: 1/4800) to get the appropriate divider width.
 |
| Figure 5 - Flow chart of the PEGGER design and decision process for route location on a vector based contour dataset. |
![]()
If a point is found, a new route segment is created in the GIS (Figure 6). If a point is not found, the user is notified that the desired grade is not feasible and potential solutions are proposed. Unlike ROUTES, which allowed for a grade tolerance (+/- some tol), PEGGER gives an exact solution in the GIS.
 |
| Figure 6 - Locating a new route with PEGGER. |
After a desirable route location has been found the user can merge the segments into one long road, dissolve adjacent segments based on a common attribute or spline to smooth sharp corners (much like a finalized design). An attempt was made to produce tangents and curves from the initial design but ArcView’s lack of a true curve feature type made the possibility impractical.
Survey
PEGGER is designed as a preliminary route location tool that
can inform a more detailed analysis. Using the ArcView extensions
Spatial
Analyst or 3D Analyst, users can digitally survey a preliminary
location and export the survey to RoadEng. The survey technique
used by PEGGER closely mimics the methods used by field crews
when surveying a P-line with a Criterion laser range finder.
Survey
parameters such as the elevation model to use, the number and
density of side-shots, and the distance between turning-points
can be specified
in the simple survey dialog shown in Figure 7. An option to densify
the survey and gather additional topography ground points as
shown in Figure 8, allows the user to replicate field procedures
or maximize
topographic input into RoadEng. This option allows direct comparison
between field based and PEGGER digital surveys for accuracy assessments
and research.
![]()
 |
| Figure 7 - The PEGGER survey dialog where users can specify survey parameters to either match field procedures for comparison purposes, or maximize topographic input into RoadEng with the densify function. |
 |
| Figure 8 - The PEGGER survey function allows users to generate survey data for RoadEng so that it mimics field procedures or so that it maximizes topographic input. Three different survey densities are shown above with the one of the left most closely representing typical field survey methods. |
PEGGER is designed as a tool to quickly evaluate many alternative routes. PEGGER was not designed to optimize or even suggest optimal route locations. However, it has been shown that once a route location has been chosen RoadEng can be used to produce an optimal design (Heralt 2002). RoadEng can produce a final road design that considers earth work, horizontal alignment, vertical alignment, super-elevation, and materials. By quickly pegging multiple routes and analyzing them in RoadEng (Figure 9), a preferred alternative can be selected based on environmental, economic, or visual concerns.
 |
| Figure 9 - A PEGGER surveyed road in RoadEng. The digital survey can be imported into RoadEng using the Criterion .pol unit survey format. |
![]()
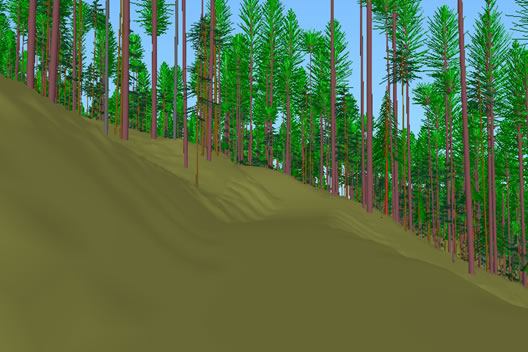
Visualization
Complementing PEGGER is a companion program ROADVIEW that takes
the preliminary route location generated by PEGGER and creates
an approximate 3-dimensional model of the road’s cuts,
fills and running surface (see Figure 10). Using the 3-D model
and a visualization program such as EnVision, professionals can
look at the road as it might be constructed and effectively communicate
with non-forest professionals regarding scenic and environmental
impacts. Utilizing the Landscape Management System (LMS) in combination
with EnVision can produce realistic representations of the visual
impacts associated with right-of-way clearing and road construction
(see Figure 11).
|
| Figure 10 - ROADVIEW visualization in ArcView 3 of a route located with PEGGER. |
|
| Figure 11 - ROADVIEW visualization in EnVision can be used to create a video of driving down a pegged road. |
![]()
Analytical Description
ROADVIEW works by constructing four surfaces based on the location
of an existing or pegged road. First a grid is constructed that
represents the distance from the road centerline. Each cell in
the distance grid represents the distance at that point from
the road centerline. Second, a road surface grid is constructed
from the road using elevation data from the digital elevation
model. To construct this grid the line feature in the GIS is
broken down into points. At each point an elevation value is
extracted from the digital elevation model. These points are
then splined into a continuous surface that represents the roadbed.
Third, both cut and fill grids are created for the entire length
of the road. The cut and fill grids are created from user specified
cut and fill slope ratios and the distance to road centerline
grid. Using these 4 grids, a cell-by-cell analysis chooses the
appropriate surface based on the order in which those grids overlay.
The value of each cell in the visualization grid can be calculated
by the following pseudo-code:
| Select Case | |
Case ([DIST] < w) |
|
[ROAD] |
|
Case ([CUT] < [DEM]) |
|
[CUT] |
|
Case (FILL] > [DEM]) |
|
[FILL] |
|
Else |
|
[DEM] |
|
| End Select |
| where | w = road width, |
| cs = cut slope percent, | |
| fs = fill slope percent, | |
| [####] = A GRID: | |
| [DIST] = Euclidean distance to road centerline grid, | |
| [ROAD] = Splined road point elevation values extracted from DEM, | |
| [CUT] = (([ROAD] - (cs * 0.5 * w)) + ([DIST] * cs)), | |
| [FILL] = (([ROAD] + (fs * 0.5 * w)) – ([DIST] * fs)), | |
| [DEM] = digital elevation model of topography |
Currently, ROADVIEW does not adjust the road location or vertical alignment to balance cuts and fills or construct a full-bench segment. ROADVIEW simply visualizes the road as if it were built exactly as represented in the GIS. While the method is fairly crude, it quickly gives the user an idea of how a particular road will look when constructed. Any future work on ROADVIEW should attempt to visualize roads based on templates for balanced cut/fill and full-bench sections in different side-slope conditions.
![]()
Discussion
Ease of Use
To ensure the software was intuitive a usability test was conducted.
All users had some familiarity with ArcView 3 GIS. Users were asked
to download and install the PEGGER ArcView extension and then follow
the included tutorial to learn how to use the software.
Monitoring of the users behavior and suggestions made directly
by the users resulted in a streamlined and improved design. Since
PEGGER’s introduction in 2001 many comments have been received
from users. Most have commented on the programs ease of installation,
well documented tutorial, and simple user interface (personal communication
with Dudek 2004; personal communication with Khan 2004; personal
communication with Romberg 2005).
There were two main issues identified from users. First, they were
looking for the installed program under the Microsoft Windows start
menu even though ArcView extensions are not accessed that way.
In order to address this behavior there was a program folder set
up to appear in the start menu for easy access to the program after
installation. Second, the help documentation did not include information
for PEGGER because the ArcView help was separate so the PEGGER
help documentation was integrated with the ArcView help documentations
files. These simple changes to the installation and user interface
have made the program much more intuitive and user-friendly.
Downloads
Since PEGGER was first published as an ArcGIS extension in 2001
many users from all over the globe have downloaded and, based
on their comments to the author, successfully used it. As of
April
2005 there have been over 670 downloads of the software from
the Rural Technology Initiative website at http://www.ruraltech.org/tools/pegger.
As shown in Figure 12, there still appears to be a demand for
the
UNIX versions of the PEGGER software which further supports the
decision to use ArcView 3 as the platform.
![]()
|
| Figure 12 - Downloads of the PEGGER software from the Rural Technology Initiative Website from 2002 to 2004 with projected downloads for 2005. |
Applications to Management
Pegging roads in the office before heading to the field can save
considerable time. In has been shown that by using PEGGER, feasible
preliminary routes can be identified for larger areas in less
time than was possible using manual methods alone. In addition
to analyzing more alternative routes in less time PEGGER was
extended by analyzing side slope data as roads were pegged. By
using slope information from a digital elevation model and the
distance to the nearest rock-pit, a rough cost estimate could
be calculated for each alternative road design (Schiess and Tryall
2002; Schiess and Tryall 2003).
Another application of PEGGER is the ability to create field maps once a route has been chosen. PEGGER keeps track of grade information as a road is pegged. Using the dissolve feature of PEGGER along with the grade information, adjacent segments of pegged road can be dissolved together to create lengths of road that have the same grade. Pegged roads can then be printed on a contour map with grade and length information as shown in Figure 12.
![]()
|
| Figure 13 - A dirty and well-used field map produced from a road designed using PEGGER. The road grade and stationing information can be used to locate the proposed road in the field with just the map and a clinometer. |
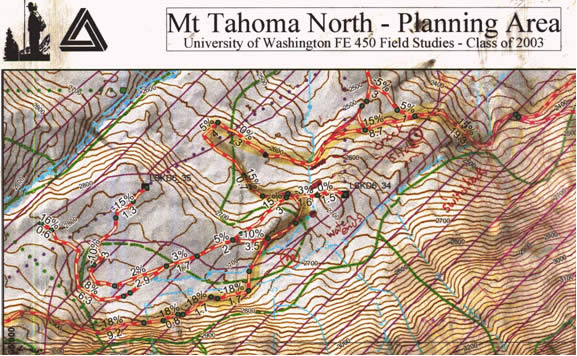
The advantage of using maps like the one above are that the only tool needed to locate the PEGGER designed road is a clinometer. Reading the grade and distances off of the map, roads can be flagged in by simply starting at a known point and pacing the required distance at the indicated grade. Placing flagging along the way, a single person can locate many miles of road in a single day. This method has been used by the University of Washington Forest Engineering Capstone students very successfully over the past few years and is considered to be their preferred method for forest road grade-line location.
Limitations
The PEGGER program relies on digital topographic information to
identify potential road locations. To be of value to the forest
professional, the topographic information must accurately represent
the actual ground conditions. Steve Reutebuch (1988) noted about
ROUTES that “the accuracy of the 30-meter (USGS) DEM’s
available at the time were insufficient for accurate route projection.” With
the availability of 10-meter digital elevation data and the current
popularity of LIDAR data, route projection has become more feasible
but discrepancy between the data and actual field conditions
should be expected.
High-resolution LIDAR datasets can also be problematic. Contours generated from high-density LIDAR can be very “rough” or “noisy”. While this may accurately represent the ground surface, it can be too detailed and confuse PEGGER. Small rocks, bushes and stumps can appear in the contour data and provide misleading information to the PEGGER algorithm. To mitigate this effect, very high resolution LIDAR contours should be smoothed in the GIS or elsewhere before use with PEGGER.
The PEGGER program is a tool for quickly identifying possible route location alternatives given grades specified by the user. The tool does not evaluate additional environmental and economic constraints that must be considered by the forest professional such as soil types, hydrology, property lines and slope classes. The GIS provides a framework where these analyses can be implemented but it is outside the scope of the PEGGER program.
The algorithm that PEGGER uses to identify a segment is dependant on the contour interval of the dataset, and the desired grade of the road. At steeper grades, this works very well as pegged segments are short. However, as the grade of interest decreases, as shown in Figure 13, PEGGER must make the pegged segments longer and longer. At a 1% grade on a 20 foot contour interval dataset, the segment length becomes 2000 feet. At such long segment lengths, the topography is not being accurately represented. Therefore, at shallow grades, it is necessary for the engineer to use standard GIS functionality to locate roads manually and only rely on pegged segments as a guide for freehand placement of a preliminary route location.
![]()
|
| Figure 14 - At shallow grades, PEGGER creates very long segments of road which may not represent the topography properly. |
Users must also be careful crossing incised stream valleys (or draws) when using PEGGER. Figure 15 demonstrates the problems than can be encountered when using PEGGER in steep mountainous terrain where incised stream valleys are common. The straight red segments were placed using PEGGER with a -5% grade. These segments, because of the long segment length, skip over the topography of the incised stream. At the highest point, the road is over 100 feet above the stream! In reality, this road would be built more like the curvy green segments that more closely follow the topography of the stream valleys. The road that was initially pegged at -5% grade when built would come out to something more like -3.7%. This difference in grade can be considerable depending on site specific conditions. The effect of having a more relaxed grade in complex topographic situations can be appropriate however. Pearce (1960) suggests relaxing grade the grade in the field when locating grade lines across draws. While it may be appropriate in this situation for a more relaxed grade through the turns, if the grade were critical it would be important to look out for these circumstances.
|
| Figure 15 - Care must be taken when pegging across stream valleys. Here, the red road was located using PEGGER, however, the road would likely be constructed more like the green road. This difference in road length can significantly affect the grade of the road. |
![]()
To mitigate these effects, a 5 or even 2 foot contour interval should be used. These smaller contour intervals help to alleviate the problems with valleys and ridges and provide a much more realistic road alignment of the pegged road. While the traditional 20 foot contours can still be displayed in the GIS, the smaller contour interval data can be used for pegging.
Conclusions
While computerized route location has been used by forest professionals for many years, it has never become a widely used technology to evaluate initial road locations. With PEGGER, the forest planner can quickly evaluate route locations within a GIS framework, giving the planner access to additional GIS functionality. PEGGER was designed with simplicity and minimal investment cost as primary objectives. Through the use of a carefully designed user interface and extensive tutorial, a typical user can be locating roads in a few minutes on their own PC taking full advantage of forest technology. The automation, rather than optimization, of route location gives the forest planner more confidence in their designs since it incorporates their knowledge in the process.
In the past few years, this tool has been downloaded (and hopefully well used) by hundreds of forestry professionals from all over the world. As shown by the number of downloads of the product, and the responses received from users, PEGGER is another valuable tool that forest planners can add to their toolbox.
Bibliography
- (1985). FORPLAN version 1. Washington, D.C., U.S. Dept. of
Agriculture, Forest Service, Land Management Planning Systems
Section.
- Akay, A. E., I. R. Karas, et al. (2004). Using
High-Resolution Digital Elevation Model for Computer-Aided Forest
Road Design.
Geo-Imagery Bridging Continents, Istanbul, Turkey, The International
Society for Photogrammetry and Remote Sensing.
- Anderson, A. E.
and J. Nelson (2004). "Projecting vector-based
road networks with a shortest path algorithm." Canadian
Journal of Forest Research 34(7): 1444-1457.
- Becker, G. and D.
Jaeger (1992). Integrated design, planning and evaluation of
forest roads and logging activities using GIS-based
interactive CAD-systems. Computer Supported Planning of Roads
and Harvesting Workshop, Feldafing, Germany, International Union
of
Forestry Research Organizations.
- Berry, J. K., D. J. Buckley,
et al. (1998). Visualize Realistic Landscapes: 3-D Modeling Helps
GIS Users Envision Natural Resources.
GeoWorld.
- Boyland, M. (2003). Hierarchical Planning in Forestry.
Vancouver, B.C., University of British Columbia, Canada: 7.
Burke, D. (1974). Automated analysis of timber access road alternatives. Pacific. U. P. N. F. a. R. E. Station, USDA Forest Service. GTR-PNW-27: 1-40.
- Carson, W. W. and S. E. Reutebuch (1997). A Rigorous Test
of the Accuracy of USGS Digital Elevation Models in Forested
Areas
of
Oregon and Washington. 1997 ACSM/ASPRS Annual Convention & Exposition,
Seattle, Washington, American Congress of Surveying and Mapping
(ACSM); American Society for Photogrammetry & Remote Sensing
(ASPRS).
- Cha, D. S., H. Nako, et al. (1991). "A Computerized
Arrangement of Forest Roads Using a Digital Terrain Model." Journal
of the Faculty of Agriculture 36(1-2): 131-142.
- Coulter, E. D.,
W. Chung, et al. (2001). Forest road earthwork calculations for
linear road segments using a high resolution digital
terrain model generated from LIDAR data. First Precision Forestry
Symposium, University of Washington, College of Forest Resources,
Seattle, Washington.
- Dudek, S. (2004). Personal communication
with Sebastian Dudek a Resource Information Systems Analyst with
Rayonier. Hoquiam, WA.
- Dürrstein, H. (1992). Detailed Road
Planning Using Microcomputers. Computer Supported Planning of
Roads and Harvesting Workshop,
Feldafing, Germany, International Union of Forestry Research
Organizations.
- Dvorscák, P. and M. Hríb (1992).
Development and Present State of Utilizing Computing Technique
in Projecting
of Forest Roads in Slovakia. Computer Supported Planning of Roads
and Harvesting Workshop, Feldafing, Germany, International Union
of Forestry Research Organizations.

- Epstein, R., J. Sessions,
et al. (2001). PLANEX: A System to Identify Landing Locations
and Access. 11th International Mountain Logging
and Pacific Northwest Skyline Symposium, Seattle, Washington,
USA, University of Washington.
- Heralt, L. (2002). "Using
ROADENG system to design an optimum forest road variant aimed
at the minimization of negative impacts
on the natural environment." Journal of Forest Science 48(8):
361-365.
- Kent, B., B. B. Bare, et al. (1991). "Natural Resource
Land Management Planning using Large-Scale Linear Programs: The
USDA
Forest Service Experience with Forplan." Operations Research
39(1): 13-27.
- Khan, B. (2004). Personal communication with
Babar Khan, Geomatics Engineering Department, Regional Power
Inc. Toronto,
Ontario, Canada.
- Kobayashi, H. (1973). A Study on Automatic Processing
in Forest Road Design Mainly Concerning the Earthwork, Government
Forest
Experimental Station. Tokyo, Japan. 249.
- Krogstad, F. and P. Schiess
(2004). The Allure and Pitfalls of Using LiDAR topography in
Harvest and Road Design. Joint Conference
of IUFRO 3.06 Forest Operations in Mountainous Conditions and
the 12th International Mountain Logging Conference, Vancouver,
B.C.,
Canada.
- McCarter, J. B. (2001). Landscape management
system (LMS): background, methods, and computer tools for integrating
forest
inventory, GIS,
growth and yield, visualization and analysis for sustaining multiple
forest objectives. College of Forest Resources. Seattle, WA,
University of Washington. Doctor of Philosophy.
- McGaughey,
R. J. (2000). EnVision - Environmental Visualization System.
Seattle, WA, USDA Forest Service, Pacific Northwest Research
Station: EnVision is designed to be a full featured rendering
system for stand- and landscape-scale images.
- McGaughey, R. J.
and R. H. Twito (1988). VISUAL and SLOPE: Perspective and quantitative
representation of digital terrain models. USDA,
USDA Forest Service. PNW-GTR-214: 1-26.
- Pearce, J. K. (1960).
Forest Engineering Handbook. B. o. L. M. United State Department
of the Interior: 220.
- Pereira, L. and L. Janssen (1999). "Suitability
of laser data for DTM generation: a case study in the context
of road planning
and design." ISPRS Journal of Photogrammetry and Remote
Sensing 54(4): 244-253.
- Reisinger, T. W. and C. J. Davis (1985).
A Map-Based Decision Support System for Operational Planning
of Timber Harvests. Winter Meeting
of the American Society of Agricultural Engineers, Chicago, Il,
American Society of Agricultural Engineers.
- Reutebuch, S. (1988).
ROUTES: A Computer Program for Preliminary Route Location. U.
D. o. A. Pacific Northwest Research Station,
Forest Service. PNW-GTR-216: 18.
- Reutebuch, S., R. J. McGaughey,
et al. (2003). "Accuracy of
a high-resolution digital terrain model under a conifer forest
canpoy." Canadian Journal of Remote Sensing 29(5):
527-535.
- Romberg, W. (2005). Personal communication with
Wes Romberg, a Forester at Pacific Forest Management, Inc. Port
Hadlock, WA.
- Schiess, P. and A. Arntzen (2001). Assessment
of Operational Feasibilities
for Implementing the OESF Conservation Strategy. Seattle, WA,
University of Washington.
- Schiess, P. and L. M. O'Brien (1995).
The Application of Geographic Information Systems to Forest Operations:
The Integration of Cable
Setting Design into GIS. 2nd Brazilian Symposium on Timber Harvesting
and Forest Transportation, Salvador, Bahia, Brazil.
- Schiess, P.
and L. W. Rogers (1999). A Watershed and Transportation Plan
for the North Hoodsport Planning Area. Seattle, WA, University
of Washington.
- Schiess, P. and L. W. Rogers (2000). A Thinning
and Access Strategy for Accelerated Stand Habitat Creation -
Burnt Mountain. Seattle,
WA, University of Washington.
- Schiess, P. and J. Tryall (2002).
Transportation & Road Management
Requirements to Facilitate Habitat Restoration in the Tyee South
Planning Area. Seattle, WA, University of Washington: 106.
- Schiess,
P. and J. Tryall (2003). Developing a Road System Strategy for
the Tahoma State Forest. Seattle, WA, University of Washington.
- Sedjo,
R. A. (1987). FORPLAN, an evaluation of a forest planning tool:
proceedings of a symposium, November 4-6, 1986, Denver, Colorado
/ Thomas W. Hoekstra, A.A. Dyer, Dennis C. Le Master, technical
editors. Fort Collins, Colo., U.S. Dept. of Agriculture, Forest
Service, Rocky Mountain Forest and Range Experiment Station.
- Sessions,
J. (1987). A Heuristic Algorithym for the Solution of the Variable
and Fixed Cost Transportation Problem. The 1985 Symposium
of System Analysis in Forest Resources, University of Georgia,
Athens.
Sessions, J. and J. B. Sessions (1988). SNAP - A Scheduling and Network Analysis Program for Tactical Harvest Planning. International Mountain Logging and Pacific Northwest Skyline Symposium.
- Sessions,
J. and J. B. Sessions (1992). Tactical Harvest Planning Using
SNAP 2.03. Computer Supported Planning of Roads and Harvesting
Workshop, Feldafing, Germany, International Union of Forestry
Research
Organizations.
- Thompson, M. (1988). "Optimizing spur road
spacing on the basis of profit potential." Forest Products
Journal 38(5): 53-57.
- Thrall, G. I. and M. Campins (2004). Mapping
the Geospatial Community. Geospatial Solutions. 14: 46-52.
- Watson,
H. J. and M. M. Hill. (1983). "Decision support
systems or what didn’t happen with MIS." Interface
13(5): 81-88.
- Xu, S. (1996). Preliminary planning of forest roads
using ARC GRID.
Department of Forest Engineering. Corvallis, OR, Oregon State
University: 112.

