 |
 |
 |
 |


Rural Technology Initiative
|
***(Read,
save or print the PDF of this Report!)*** Read the University of Washington press release
titled: Watch the streaming video presntation!
Investigation of Alternative Strategies for Design, Layout and Administration of Fuel Removal ProjectsC. Larry Mason
|
|||||||||||||||||||||||||||||||||||||||||||||||||||||||||||||||||||||||||||||||||||||||||||||||||||||||||||||||||||||||||||||||||||||||||||||||||||||||||||||||||||||||||||||||||||||||||||||||||||||||||||||||||||||||||||||||||||||||||||||||||||||||||||||||||||||||||||||||||||||||||||||||||||||||||||||||||||||||||||||||||||||||||||||||||||||||||||||||||||||||||||||||||||||||||||||||||||||||||||||||||||||||||||||||||||||||||||||||||||||||||||||||||||||||||||||||||||||||||||||||||||||||||||||||||||||||||||||||||||||||||||||||||||||||||||||||||||||||||||||||||||||||||||||||||||||||||||||||||||||||||||||||||||||||||||||||||||||||||||||||||||||||||||||||||||||||||||||||||||||||||||||||||||||||||||||||||||||||||||||||||||||||||||||||||||||||||||||||||||||||||||||||||||||||||||||||||||||||||||||||||||||||||||||||||||||||||||||||||||||||||||||||||||||||||||||||||||||||||||||||||||||||||||||||||||||||||||||||||||||||||||||||||||||||||||||||||||||||||||||||||||||||||||||||||||||||||||||||||||||||
| Post-treatment risk reduction in FNF high risk stands |
| Treatment |
High risk |
Moderate Risk |
Low risk |
| No action | 100% |
0% |
0% |
| 9 & under | 37% |
48% |
15% |
| Half BA | 7% |
66% |
27% |
| 45 BA | 2% |
27% |
71% |
| 12 & over | 80% |
20% |
0% |
| Wildfire | 0% |
0% |
100% |
Thinning 9 inch and under trees leaves 85% of the beginning high
risk stands in a moderate or high risk category whereas retaining
45 BA almost eliminates the high risk with 29% in a moderate or
high risk. Removing trees over 12 inches converts a few stands
from high to moderate risk but none to low risk. Selection of
best treatment alternatives can be customized to site conditions;
however, removing some trees in the 9-12 inch diameter range is
usually required for a substantive reduction in fire risk. With
overstory trees retained and the understory re-established, fire
risks return within 15-20 years.
Market Economics
Cost estimates for logging operations and treatment yield volumes are both site and equipment specific. As a result there is a significant range of variability in net revenue across all stands for the same treatment strategy. In addition, harvesters report that operations under federal contracts are uniquely costly indicating that refinements in federal contract requirements could reduce costs. Although the BA 45 treatment failed to generate the net economic returns of the 12 and over treatment, it produced the greatest risk reduction and, with low cost assumptions, provided a positive net return.
| FNF average net revenue by treatment per acre |
| Treatment | High cost |
Low cost |
| 9 & under | ($374) |
($134) |
| Half BA | ($319) |
$139 |
| 45 BA | ($168) |
$529 |
| 12 & over | $1,244 |
$2,198 |
The range of net revenues per acre across all stands and treatments
is quite large ($-2,015 to +11,414) indicating opportunities to
customize treatments to specific conditions. Stands with positive
revenues offset losses on other stands in this analysis of average
impacts. A simple tradeoff between fire risk reduction and economics
suggests treatment strategies can use positive revenue sites to
compensate for revenue negative stand treatments. However, there
may be other environmental considerations of importance as well.
Habitat and carbon sequestration are both considered of high value
by society. Additionally, there may be other economic values that
are not reflected in treatment costs. Consideration of broader
values of fire risk reduction provides a much more powerful motivator
for fire risk reduction than looking only at net market revenue.
![]()
Wildlife Habitat
Treatments can substantially affect stand structure and, as a consequence, the habitat quality. Fires generally have a more extreme impact on habitat than any treatment. While the No action alternative might seem to benefit some species of wildlife, it assumes an unlikely eventuality of no fire and implicitly produces overstocked conditions different from pre- settlement forests with frequent fire return intervals. The impacts of the other treatments on habitat are mixed with some species benefiting at the expense of others. Habitat strategies associated with fire risk reduction are inherently local and need to be integrated into other objectives. Goshawks favor high-risk forests that are neither sustainable nor characteristic of pre-settlement conditions but their habitat can benefit from light thinnings and from avoidance of crown fires. The Lewis woodpecker can benefit from heavy thinnings if the largest trees and snags are retained. The Williamson's sapsucker needs soft snags making it very susceptible to fires. Pileated woodpeckers favor multi-story old forests, which are currently uncommon in the ONF or FNF. Retention of large trees and snags over time would eventually improve habitat for woodpeckers. The grizzly bear avoids stem exclusion structures and would favor a mix of treatments that reduces the dominance of overly dense stands. Analysis of the alternatives provides the opportunity to identify better habitat strategies in concert with other objectives and local conditions.
Carbon Analysis
Carbon is sequestered in the forest, and contributes undesirable emissions with fire, but is also stored in wood products for long periods. When biomass is converted to energy it displaces fossil fuels reducing carbon emissions. The 12 inch & over treatment produces the most flow of products and hence the most carbon sequestration but does not reduce the fire risk and is not sustainable. The BA 45 treatment produces the next highest level of carbon sequestration, reduces fire risk and is sustainable; in addition, much of the carbon is stored in products displacing energy-intensive substitute products like concrete and steel. As carbon credit markets are developed, they may contribute to treatment costs, paying for otherwise unprofitable treatments. Carbon is just one of the non-market benefits that result in positive values from fire risk reduction strategies.
Value Changes Associated with Fire Risk Reduction
While it is generally recognized that there are
many non-market values that should be associated with fire risk
reduction treatments, they are rarely articulated. With numerous
outputs tabulated for each management strategy, it is possible
to begin to put numbers on many non-market values. The tables
below provide a conservative comparison of values and costs per
acre for fire risk reduction in high and moderate risk forests.
The benefits appear to far outweigh the costs, providing motivation
for more aggressive fire risk reduction efforts than have been
undertaken to date.
| Market and Non-Market Values of Fire Risk Reduction/acre | Moderate |
High |
| Reduced fire fighting cost | $231 |
$481 |
| The value of reduced facilities losses | $72 |
$150 |
| The value of reduced fatalities | $4 |
$8 |
| The value of lost timber amenities | $371 |
$772 |
| Habitat losses | ? |
? |
| The community value of fire risk reduction | $63 |
$63 |
| Carbon credits | $20 |
$41 |
| Green energy credits | ? |
? |
| Electrical transmission cost reductions | ? |
? |
| Regeneration and rehabilitation costs | $58 |
$120 |
| Water quantity and quality | $86 |
$86 |
| Regional economic benefits | $386 |
$386 |
Total Benefits |
$1,291 |
$2,107 |
| Costs of Fire Risk Reduction/acre | Moderate |
High |
| Operational costs | $374 |
$374 |
| Forest Service contract preparation costs | $206 |
$206 |
| Soil compaction | ? |
? |
| Sedimentation | ? |
? |
| Impacts to wildlife habitats | ? |
? |
Total Costs |
$580 |
$580 |
![]()
While some non-market values have not been estimated, most appear to have lower order impacts and would probably not affect conclusions. While the value society places on habitat should be at least as high as the market revenue foregone, which can be roughly estimated from the 12 inch & over treatment revenue, habitats are more likely protected by treatments that avoid fire than by No action and should be significantly positive with more sustainable management.
Cogeneration Opportunity
Applying non-market values to motivate increased fire risk reduction treatments or selecting treatments that come close to breaking even does not by itself create a use for the lowest valued small diameter material harvested. Cogeneration in any number of forms adds value in the conversion of low-valued biomass to energy and can be considered a default use of material when higher-use markets are unavailable. Forest inventory analyses indicate that opportunities for cogeneration development exist on both forests. The primary limitation is assured access to sufficient biomass to warrant cogeneration investments. This raises the importance of contracting relationships and the sustainability of fire risk reduction planning.
Sustainability and Contracting
The Forest Service has generally been stymied in the process of completing environmental reviews and arranging contracting where costs and revenues are not directly related to positively valued timber markets. Stewardship End Result Contracts are being developed to allow negative revenue risk reduction operations that provide benefits such as contract longevity to support investments of risk capital in needed infrastructure.
Uses of the Report
This report provides parametric data on treatments that reduce fire risk, including their costs, market values, non-market values, and contracting issues. Specific examples can be used to customize strategies for a wide range of forest, infrastructure and market conditions. The information is also useful in training operators on how to design and layout fuel reduction treatments.
This report also demonstrates how an integrated forestry software package can assist federal agencies and other interested users in gaining greater efficiencies in planning fire risk reduction treatments to achieve multiple values with less conflict and less cost. The Landscape Management System (LMS) provides a sophisticated user-friendly software environment from which professional and public users with little training can participate in analysis of complex data to better understand the consequences of management alternatives. The results from case study analysis of two National Forests, presented in this report, demonstrate that fire risk can be effectively reduced while creating and protecting other positive environmental, economic, and social values.
TABLE OF CONTENTS
***(Read, save or print the PDF of this Report!)***
ACKNOWLEDGEMENTS
EXECUTIVE SUMMARY
LIST OF FIGURES
LIST OF TABLES
1. BACKGROUND
1.1 The Forest
1.2 The Risk
1.3 The Imperative
1.4 Better Information
and Technology
2. METHODS
2.1 Study Sites
2.2 Technical Tools
2.2.1 The Landscape Management System
2.2.2 Forest Vegetation Simulator
2.2.3 Fire and Fuels Extension to the Forest
Vegetation Simulator
2.2.4 Carbon Sequestration Model
2.2.5 Wildlife Habitat Models
2.3 The Data
2.3.1 Current Vegetation Survey
2.3.2 Literature and Reports
2.3.3 Personal Interviews
2.4 Assessments
of Initial Forest Conditions
2.4.1 Fire Risk Classification
2.4.2 Forest Structure
2.4.3 Forest Type
2.5 Growth, Treatment,
and Wildfire Simulation
2.6 Analysis of
Economics
2.6.1 Conversions
2.6.2 Logging and Hauling Costs
2.6.3 Mill Log Values
2.6.4 Net Revenue Calculation
2.6.5 Market and non-market values of fire risk
reduction
3. CASE STUDY SITE DESCRIPTIONS
3.1 Fremont National
Forest
3.2 Okanogan National
Forest
4. RESULTS
4.1 Fire Risk Results
4.1.1 Fremont National Forest
4.1.2 Okanogan National Forest
4.2 Economic Results
4.2.1 Fremont National Forest
4.2.2 Okanogan National Forest
4.3 Cost to Fight
Fire on the Fremont and Okanogan National Forests
4.4 Wildlife Habitat
4.4.1 Fremont habitat analysis results
4.4.1.1
No-action
4.4.1.2
Wildfire scenario (without regeneration)
4.4.1.3
Thinning treatments (without regeneration)
4.4.1.4
Wildfire scenario (with regeneration)
4.4.1.5
Thinning treatments (with regeneration)
4.4.1.6
Species summaries for FNF
4.4.2 Okanogan habitat analysis results
4.4.2.1
No-action
4.4.2.2
Wildfire scenario (without regeneration)
4.4.2.3
Thinning treatments (without regeneration)
4.4.2.4
Wildfire scenario (with regeneration)
4.4.2.5
Thinning treatments (with regeneration)
4.4.2.6
Species summaries for ONF
4.5 Carbon sequestration,
displacement, and substitution
4.5.1 Fremont
4.5.1.1
No-action
4.5.1.2
Wildfire
4.5.1.3
Treatments
4.5.1.4
Regeneration
4.5.2 Okanogan
4.5.2.1
No-action
4.5.2.2
Wildfire
4.5.2.3
Treatments
4.5.2.4
Regeneration
4.6 Market and Non-Market
Values of Fire Risk Reduction
4.6.1 Reduced fire fighting cost
4.6.2 The value of reduced facilities losses
and fatalities
4.6.3 The value of lost timber amenities
4.6.4 Habitat losses
4.6.5 The community value of fire risk reduction
4.6.6 Carbon credits
4.6.7 Green energy credits
4.6.8 Electrical transmission cost reductions
4.6.9 Regeneration and rehabilitation costs
4.6.10 Water quantity and quality
4.6.11 Regional economic benefits
4.6.12 Summary of Market and Non-Markets Values
of Fires Risk Reduction
4.7 Cogeneration
Analysis
4.8 Contracting
and Public Outreach
4.8.1 Excessive analysis
4.8.2 Ineffective public involvement
4.8.3 Management inefficiencies
4.8.4 Stewardship Contracting
APPENDICES-
( read , print or save the PDF
version.)
APPENDIX
A. FIRE RISK CLASSIFICATION
APPENDIX
B. FREMONT NATIONAL FOREST
APPENDIX
C. OKANOGAN NATIONAL FOREST
APPENDIX
D. WILDLIFE MODELS
APPENDIX
E. EQUIPMENT INVESTMENT AND OPERATIONS COST E
![]()
LIST OF FIGURES
| Fremont National Forest Boundaries | |
| Figure 3.2 | FNF Forest Type Distribution |
| Figure 3.3 | FNF Elevation Class Distribution |
| Figure 3.4 | FNF Canopy Structure Distribution |
| Figure 3.5 | FNF Dominant Species Distribution |
| Figure 3.6 | FNF TPA Class Distribution |
| Figure 3.7 | FNF QMD Class Distribution |
| Figure 3.8 | FNF BA Class Distribution |
| Figure 3.9 | FNF Risk Distribution |
| Figure 3.10 | Okanogan National Forest Boundaries |
| Figure 3.11 | ONF Forest Type Distribution |
| Figure 3.12 | ONF Elevation Distribution |
| Figure 3.13 | ONF Canopy Structure Distribution |
| Figure 3.14 | ONF Dominant Species Distribution |
| Figure 3.15 | ONF TPA Class Distribution |
| Figure 3.16 | ONF QMD Class Distributions |
| Figure 3.17 | ONF BA Class Distribution |
| Figure 3.18 | ONF Risk Distribution |
| Figure 4.1 | FNF High Risk Species Distributions |
| Figure 4.2 | FNF High Risk Structure Distributions |
| Figure 4.3 | FNF Low Risk Species Distributions |
| Figure 4.4 | FNF Low Risk Structure Distributions |
| Figure 4.5 | FNF High Fire Risk Response to Six Simulations with Regeneration |
| Figure 4.6 | FNF High Fire Risk Response with No Regeneration after Treatment |
| Figure 4.7 | ONF High Risk Species Distributions |
| Figure 4.8 | ONF High Risk Structure Distributions |
| Figure 4.9 | ONF Low Risk Species Distributions |
| Figure 4.10 | ONF Low Risk Structure Distributions |
| Figure 4.11 | ONF High Fire Risk Response to Six Simulations with Regeneration |
| Figure 4.12 | ONF High Fire Risk Response with No Regeneration after Treatment |
| Figures 4.13 and 4.14 | FNF Net Revenue High and Moderate Risk Stands with Low Costs |
| Figures 4.15 and 4.16 | FNF Net Revenue High and Moderate Risk Stands with High Cost |
| Figures 4.17 and 4.18 | ONF Net Revenue for High and Moderate Risk Stands with Low Cost |
| Figures 4.19 and 4.20 | ONF Net Revenue High and Moderate Risk Stands with High Cost |
| Figure 4.21 | Fremont National Forest Fire Suppression Average Costs/Acre by Magnitude for 1992-2002 |
| Figure 4.22 | Okanogan-Wenatchee National Forest Fire Suppression Average Costs/Acre by Magnitude for 1990-2002 |
| Figure 4.23 | Source Habitat (ICBEMP; Wisdom et al. 2000a) Structural Stage Classifications Identify both of these Stands as Being Within the Same Stage - 'Stem exclusion (open canopy)' |
| Figure 4.24 | Initial Habitat Distributions for Selected Species in Moderate to High Risk Areas in the FNF |
| Figure 4.25 a,b,c | Initial Habitat Distributions for Selected Species Displayed by Risk Class in the FNF |
| Figure 4.26 | Initial Habitat Distributions for Selected Species in Moderate to High Risk Areas in the ONF |
| Figure 4.27 a,b,c | Initial Habitat Distributions for Selected Species Displayed by Risk Class in the ON |
| Figure 4.28 | Present Value Estimations of Future Fire Fighting Costs |
| Figure 4.29 | Present Value of a Perpetual Annual Series |
| Figure 4.30 | The Landscape Management System Provides Visual, Tabular, and Graphical Capabilities |
LIST OF TABLES
| Table 2.1 | Interviews |
| Table 2.2 | Fire Risk Classifications |
| Table 2.3 | Tons per Thousand Board Feet (MBF) for Eastern Washington and Oregon |
| Table 2.4 | FNF and ONF Low and High Logging, Hauling/MBF and PCT Costs per Acre |
| Table 2.5 | Regional Log Sort Values $/MBF Used for Economic Valuation |
| Table 3.1 | Acres in Initial Fire Risk Class for Forests on FNF and ONF |
| Table 4.1 a,b,c | FNF Post-treatment Conditions for Stand Originally in High and Moderate Risk Classes |
| Table 4.2 a,b,c | ONF Post-treatment Conditions for High and Moderate Risk Classes |
| Table 4.3 | FNF Mean Net Revenue for Thinning Treatments on High and Moderate risk forests with High and Low Logging Costs |
| Table 4.4 | ONF Mean Net Revenue for Thinning Treatments on High and Moderate risk forests with High and Low Logging Costs |
| Table 4.5 | Average Metric Tons per Acre of Carbon in the Forest by Treatment for the FNF |
| Table 4.6 | Average Metric Tons per Acre of Carbon in Products by Treatment from the FNF |
| Table 4.7 | Average Metric Tons per Acre of Carbon in the Forest, Products, and Displacement by Treatment in the FNF |
| Table 4.8 | Average Metric Tons per Acre of Carbon in Forest, Products, Displacement, and Substitution by Treatment in the FNF |
| Table 4.9 | Average Increase in Metric Tons per Acre of Carbon with Regeneration |
| Table 4.10 | Average Metric Tons per Acre of Carbon in the Forest by Treatment for the ONF |
| Table 4.11 | Average Metric Tons per Acre of Carbon in Products by Treatment from the ONF |
| Table 4.12 | Average Metric Tons per Acre of Carbon in the Forest, Products, and Displacement by Treatment in the ONF |
| Table 4.13 | Average Metric Tons per Acre of Carbon in Forest, Products, Displacement, and Substitution by Treatment in the ONF |
| Table 4.14 | Average Increase in Metric Tons per Acre of Carbon by 2030 by Treatment with Regeneration |
| Table 4.15 | Parametric Present Value Estimations of Fire Risk Costs with Assumptions of $1000/acre to Fight Fire and 5% as the Discount Rate |
| Table 4.16 | Present Value (PV)/acre of Theoretical WTP Annual Contributions from Households for Protection from Wildfire on the FNF and ONF (Note that PV is Less for FNF because of Less Population and More Acres at Risk) |
| Table 4.17 | Summary of Total Values/Acre Estimations of Benefits Associated with Fire Risk Reductions |
| Table 4.18 | Summary of Estimated Costs that Might be Associated with Fire Risk Reduction Treatments |
![]()
1. BACKGROUND
1.1 The Forest
Changes in forest composition and structure due to a century of fire suppression, grazing, and past harvest practices have been widely documented (Pyne 1997, Arno 2000). Where once frequent fire return intervals resulted in savanna-like forest conditions, now dense understories of shade-tolerant species have become established (Pfilf et al. 2002). Outbreaks of insects and of root disease have resulted in large areas of tree mortality (Stewart 1988). Dead trees and multiple layered canopies have become ladder fuels and increase risk of destructive wildfires. Concerns about large areas of National Forest lands in the inland west that are overstocked with small diameter suppressed trees are not new (Cooper 1960, Pyne 1982). However, increases in forest fire severity, extent, and costs in recent years have served to focus public attention on the widespread and urgent nature of this problem (Agee 1993, Western Governors Report 2001 and 2002). In 2002, Interior Secretary Norton estimated that 2/3 of public lands (more than 120 million acres) are at moderate to high risk of catastrophic fire (Norton 2002).
1.2 The Risk
While the average annual population growth over the last two decades in the United States has been about 1%, western states have experienced growth rates ranging from 2.5 to 13% (Riebsame 1997, Babbitt and Glickman 2000). As a result, development has occurred adjacent to federal lands in what has become known as the "wildland/urban interface". Consequently, risk from forest fires to private property and human life has increased making fire fighting more complicated, expensive, and dangerous (Babbitt and Gickman 2000).
In the period between 1990 and 1998, 133 individuals died while involved in fighting wild fires (Mangan 1999). Loss of life resulting from fire fighting activities is not the only health hazard associated with forest fires. Because of the fine particulate matter and other pollutants present in the smoke, forest fires can pose a significant health threat to people living in the "wildland-urban interface" (GAO/RCED-99-65 1999, Norton 2002). Smoke from forest fires increases atmospheric carbon associated with global warming (Buchanan and Keye 1997). Intense forest fires create other undesirable environmental consequences such as destruction of wildlife habitat and pollution of surface waters (Camp 1995, Laverty and Williams 2000, Hill 1998). Without intervention, these burned lands recover slowly and may be susceptible to vegetation changes that result in undesirable ecological consequences (Babbitt and Glickman, 2000).
Economic impacts from forest fires are considerable. Costs to fight forest fires reached record breaking proportions in 2000 when the federal government spent $1.5 billion on 8.3 million acres only to have the record broken again in 2002 when costs reached $2.2 billion on 7.2 million acres (The Office of the President 2002). However, these costs do not reflect other economic impacts at the federal level that result from losses of valuable timber resources or from post-fire expenditures such as forest regeneration. In addition to federal costs from fires are losses incurred by state and local governments or by the private sector. For example, after the 2000 fire season, Montana Governor Racicot estimated that businesses had lost about $3 million a day because of fire. Idaho Governor Kempthorne estimated losses in Idaho at $54.1 million overall, of which $15 million came from about 500 small businesses (Babbitt and Glickman 2000).
1.3 The Imperative
In 2000, the USDA Forest Service outlined a strategy to address forest health and wildfire in the forests of the inland west entitled Protecting People and Sustaining Resources in Fire-Adapted Ecosystems; a Cohesive Strategy (Laverty and Williams 2000). This report states that, "Without increased restoration treatments in these ecosystems, wildland fire suppression costs, natural resource losses, private property losses, and environmental damage are certain to escalate as fuels continue to accumulate and more acres become high-risk." The report goes on to identify the key components of a national strategy to deal with unprecedented wildfire risk:
Improve fire prevention and suppression
Reduce hazardous fuels
Restore fire-adapted ecosystems
Promote community assistance
![]()
1.4 Better Information and Technology
The challenge of developing long term strategies to reduce wildfire risks across tens of millions of acres of inland west forest is daunting. The body of information to be considered is huge and the planning process may be formidable. Infrastructure is limited, funding is scarce, costs high, and conflicts rampant (USDA Forest Service 2002). Strategies to help professionals, publics, and policy-makers gain better understanding of the present circumstances and the future possibilities of forest fire risk could be helpful. Areas of greatest risk will need to be prioritized for immediate attention. Predictive capabilities will be needed to assess future effectiveness of alternative treatment strategies for the achievement of risk reduction and other multiple-use management objectives. Development of efficient fuels reduction treatments at the least cost customized to local conditions will be necessary. Interested members of the lay public must be informed of present conditions and future possibilities such that choices for action are not confusing and subject to distrust.
This project will demonstrate how emerging modeling and data analysis technologies can assist the planning of fuel removal treatments for the achievement of multiple management goals. This project will also provide suggestions on how forest treatments to reduce fire risk might be customized to local conditions in order to lower costs and increase effectiveness. The project findings will provide the basis for developing technical tools, instructional materials, and training modules for creation of educational materials to assist the Forest Service and cooperating publics in the collaborative development of effective management strategies for the reduction of risk from catastrophic wildfire within dry site National Forests. The technologies useful for planning today will provide enduring benefit as the technologies used to assist monitoring and evaluation in the future.
2. METHODS
This project has developed a parametric sensitivity analysis to be used in tandem with existing modeling capabilities to assess the relative costs and benefits of alternative fuels reduction strategies. Additional information needed to gain better understanding of the opportunities and obstacles associated with fuel removal activities on federal lands has been gathered from the scientific literature, government publications, and personal interviews with forestry professionals and community representatives.
2.1 Study Sites
The Okanogan National Forest (ONF) in Washington and the Fremont National Forest (FNF) in Oregon were selected as case-study areas for this project. Both of these National Forests are located within the dry interior portion of the western United States. Both the Okanogan and the Fremont National Forests contain substantial acreages of overstocked forests that are considered to be at risk from wildfire. Both National Forests have experienced destructive wildfires in recent years. The rural communities surrounding these National Forests have double-digit unemployment and have experienced economic declines due to job losses associated with reductions in federal timber harvest volumes. Individuals, organizations, and businesses from both areas demonstrated interest in this investigation and contributed valuable reference information through personal interviews.
![]()
2.2 Technical Tools
2.2.1 The Landscape Management System
The effects of forest management alternatives on fire risk reductions, forest product outputs, economic metrics, wildlife habitat, and carbon sequestration were simulated using the Landscape Management System (LMS). LMS is an evolving computer-based, landscape-level forestry analysis software tool developed at the University of Washington College of Forest Resources (McCarter1997, McCarter et al. 1998, McCarter 2001). LMS offers a software platform for the integration of component capabilities that include growth and yield models, interactive stand treatment simulation programs, tabular and graphical analytical outputs, and stand and landscape visualization programs. Data sources necessary for LMS include stand inventory information (tree-based measurements), landscape data (slope, aspect, elevation, site quality), and Geographic Information System (GIS) spatial data (stand boundaries, streams, roads, etc.). LMS can be used to project stands and landscapes forward in time to predict potential future stand and landscape forest conditions, while virtually treating stands through harvesting, regeneration, and other activities to simulate potential management practices. The user interface within LMS is designed to provide a user-friendly "click and go" command format. The intended result is that this powerful forestry software is available for use by individuals with minimum computer skills and limited financial resources. Consequently, LMS has proven to be beneficial not only as a powerful analysis support tool for forestry professionals but also as a communication tool for use with stakeholder groups embarked on the often conflict-vulnerable process of consensus building (Courtmanche 2002). LMS is available for download and provided at no charge through a forestry research partnership between the University of Washington and Yale University. The web site address is http://lms.cfr.washington.edu/.
2.2.2 Forest Vegetation Simulator
The Forest Vegetation Simulator (FVS) is an individual-tree, distance-independent growth and yield model (Crookston 1990, Van Dyck 2000). FVS will simulate growth and yield for most major forest tree species, forest types, and stand conditions. FVS can simulate a wide range of silvicultural treatments. Variants of FVS provide growth and yield models for specific geographic areas of the United States. Prognosis (Stage 1973) is the original model that evolved into the Forest Vegetation Simulator. Stage developed Prognosis for use in the Inland Empire area of Idaho and Montana. In the early 1980s, the National Forest System's Timber Management Staff selected the individual-tree, distance-independent model form as the nationally supported framework for growth and yield modeling. Over the following years, the Forest Management Staff's Growth and Yield Unit incorporated much of the Prognosis modular structure and capabilities into the national model framework. This model framework is the Forest Vegetation Simulator, or FVS (Wykoff et al. 1982). There are 21 different FVS variants. Each is calibrated to a specific geographic area of the United States. Various extensions are available for some of the variants. These extensions provide the ability to estimate the influence of other agents upon tree growth (such as insects, disease, and fire), extend FVS modeling capabilities, and permit multiple stand simulation. For the simulations needed for this investigation the East Cascades Variant (EC) of FVS and the South Central Oregon and Northeastern California Variant (SORNEC) of FVS were selected for use within LMS to contribute growth-modeling capabilities for the Okanogan National Forest and the Fremont National Forest respectively. More information and a suite of FVS regional variants are available for download at no charge from the USFS web site at: http://www.fs.fed.us/fmsc/fvs/.
2.2.3 Fire and Fuels Extension to the Forest Vegetation Simulator
The Fire and Fuels Extension to the Forest Vegetation Simulator (FFE-FVS) links existing FVS models, that represent fire and fire-effects, with newly developed fuels dynamics and crowning submodels (Beukema et al. 1997, Scott and Reinhardt 2001). The Fire and Fuels Extension (FFE) has been developed to assess risk, behavior, and impact of fire in forest ecosystems (Beukema et al. 2002). FFE can produce reports of changes in various indices of potential fire severity as a result of alterations to stand characteristics resulting from simulated management alternatives. More information and downloadable FFE for use with selected variants of FVS are available for download at no charge from the USFS web site at: http://www.fs.fed.us/fmsc/fvs/.
![]()
2.2.4 Carbon Sequestration Model
A life cycle assessment process has been developed to serve as an accounting system for the carbon consequences of forest management alternatives (Manriquez, 2002). Estimates of changes in the amount of carbon stored over time in the standing forest are calculated using biomass to carbon conversion factors specific by species for tree bole, bark, foliage, limbs, and roots. Estimates of carbon stored in harvested wood products are also calculated. Estimates of carbon emitted to the atmosphere from harvesting and manufacturing operations are considered as reductions to carbon stored in wood products. Estimated as well is the amount of carbon not emitted due to displacement of fossil fuels in energy generation by wood used in a wood boiler, and substitution of wood for steel for construction materials. The model is implemented in Microsoft Excel and designed to work in tandem with LMS, allowing a comprehensive estimate of forest carbon storage, substitution, and displacement over time for different management alternatives. This carbon assessment process is based on studies of wood biomass (Gholz, 1979), carbon content (Birdsay, 1992), decomposition (Harmon, 1993), product utilization (Bowyer et al, 2002), harvesting and manufacturing emissions (Franklin Associates, 1998), fossil fuel displacement (Bowyer et al, 2002), and construction material substitution (Bowyer et al, 2002). Changes in forest biomass from growth (simulated with a growth model) and decomposition are simulated and converted to stored carbon estimates. Carbon amounts are moved from the forest to the products pool following a silvicultural operation, simulated in LMS. The model calculates log utilization to determine amounts of short-term and long-term products. These products are either decomposed through time or used in displacement (short-term) or substitution (long-term). Emissions from harvesting and manufacturing are determined from the types of silvicultural treatments done and the amount of harvest volume removed and processed.
2.2.5 Wildlife Habitat Models
Wildfires and forest management activities result in changes to wildlife habitat quality. When fuel removal treatment alternatives are compared to the potential impacts of wildfire, it is important, therefore, to consider the implications for wildlife habitats. Habitat suitability modeling provides an estimate of habitat quality (an index from 0.0-1.0) and quantity (i.e. area of the landscape) consolidated into a single metric known as a 'habitat unit' for each species of interest. Wildlife habitat models are analyzed to assess the tradeoffs in habitat units associated with various management alternatives. For some species, Habitat Suitability Index (HSI) models are available from the U.S. Fish and Wildlife Service (USFWS 2001); for others, habitat models developed by the U.S. Forest Service (Wisdom et al. 2000b) for the Interior Columbia Basin Ecosystem Management Project (ICBEMP) are used. Wildlife species analyzed differed between the two National Forests due to geographic ranges, model availability, and species of concern. Lists of species identified as important for consideration in this project were obtained from Kent Woodruff, Okanogan National Forest biologist, and Brent Frazier, Fremont National Forest biologist.
Changes to wildlife habitat conditions resulting from treatment
simulations were analyzed for nine species on the Okanogan National
Forest:
northern goshawk (Accipiter gentilis)
Lewis' woodpecker (Melanerpes lewis)
white-headed woodpecker (Picoides albolarvatus)
Williamson's sapsucker (Sphyrapicus thyroideus)
Canada lynx (Lynx canadensis)
grizzly bear (Ursus arctos)
pileated woodpecker (Dryocopus pileatus)
northern flying squirrel (Glaucomys sabrinus)
Townsend's big-eared bat (Corynorhinus townsendii)
Changes to wildlife habitat conditions resulting from treatment simulations were analyzed for seven species on the Fremont National Forest (all of above except lynx and grizzly bear):
pileated woodpecker (Dryocopus pileatus)
northern flying squirrel (Glaucomys sabrinus)
Townsend's big-eared bat (Corynorhinus townsendii)
northern goshawk (Accipiter gentilis)
Lewis' woodpecker (Melanerpes lewis)
white-headed woodpecker (Picoides albolarvatus)
Williamson's sapsucker (Sphyrapicus thyroideus)
Habitat Suitability Index (HSI) models were developed by the U.S. Fish and Wildlife Service for use in Habitat Evaluation Procedures (USFWS 1980a, 1980b). These predictive models estimate the habitat quality of particular patches or units (i.e. stands) for a given wildlife species based on a combination of variables (e.g. canopy closure, snag density, basal area). For species of concern for which HSI models are not available, a second category of habitat models is used. These species habitat models are referred to as forest structural stage models or "species source habitat matrix" models and were developed by the U.S. Forest Service (Wisdom et al. 2000b) for use with the Interior Columbia Basin Ecosystem Management Project (ICBEMP). These ICBEMP models are based upon matrix tables that provide the source habitat types (combination of cover type and structural stage) for 91 terrestrial vertebrate species within the interior Columbia River basin. Source habitats are defined as, "those characteristics of macrovegetation that contribute to stationary or positive population growth for a species in a specified area and time." A stand is categorized as either being a source habitat or not. There is no consideration of marginal habitat.
![]()
HSI models for four bird species were used on both Forests:
| Northern Goshawk |
|
| Lewis' Woodpecker |
|
| White-headed Woodpecker |
|
| Williamson's Sapsucker |
|
Documentation of these models, including variable thresholds and
HSI equations, can be found in Appendix D. For the Lewis' woodpecker
(Sousa 1982) and Williamson's sapsucker (Sousa 1983), models were
available from the USFWS (2001). Modifications were made to both
of these models to facilitate their use in this project. The changes
are documented in Appendix D. The goshawk and white-headed woodpecker
models were developed using available scientific literature and
discussions with species experts throughout the region (Weber
and Cannings 1976; Bull et al. 1986; Milne and Hejl 1989; Blair
and Servheen 1993; Garrett et al. 1996).
Source habitat models for five species were used on the Okanogan and three were used on the Fremont:
Canada lynx (Okanogan only)
grizzly bear (Okanogan only)
pileated woodpecker
northern flying squirrel
Townsend's big-eared bat
Documentation of these models can be found in Wisdom et al. (2000b). The matrix tables provide information on whether or not a given cover type/structural stage combination is source habitat for each species. Two of the seven structural stages (stem exclusion - open canopy and old forest - single canopy layer) are omitted from some of the cover types in the tables, therefore some interpolation is required to assign these stages as source habitat or not. For example, in the interior ponderosa pine cover type (the only one to include all seven structural stages), stem exclusion - open canopy and stem exclusion closed canopy are the only stages that are not considered source habitat for the grizzly bear. Therefore, stem exclusion - open canopy is not considered source habitat for this species in the cover types where this stage is omitted. Appendix D shows the source habitats for all five species, including the assumptions that were made for some structural stages.
For the HSI models, LMS spatial and inventory stand attributes are used to calculate the HSI score for each stand for every combination of wildlife species, treatment, and time period. LMS stand attributes are used to calculate the cover type/structural stage for each stand for every combination of treatment and time period. An interface to LMS inventory files has been constructed to calculate whether or not each stand was source habitat based on its cover type/structural stage for every combination of wildlife species, treatment, and time period.
![]()
2.3 The Data
2.3.1 Current Vegetation Survey
Forest inventory data used in this project has been downloaded from the USFS's Region 6 Current Vegetation Survey (CVS) web site (URL http://www.fs.fed.us/r6/survey/). Since the 1930's, the U.S. Forest Service has been responsible for determining the extent, condition, volume, growth, and depletion of the Nation's forests on a periodic basis. CVS data collection locations with permanent plot clusters have been established on a 1.7-mile grid over all national forests in Region 6. Information available at the individual plot level includes inventory year, stand number, tree number, species, DBH, height, and crown ratio.
Conditions on the Fremont and Okanogan National Forests were represented, simulated, and analyzed using the Current Vegetation Survey (CVS) Occasion 1 data sets. Data for these national forests was collected during the period from 1994 to 1996. Re-measurements of many plots occurred during successive panels of CVS Occasion 2, but full re-measurement data was not available for both forests. As a result, CVS Occasion 1 data, with a base year of 1995, was selected to provide the forest inventory information used to undertake the simulation analysis required for this study. The 1995 data were "grown" forward within FVS for one growth period of five years to 2000 to bring data close to present time before treatment simulations were conducted.
The Fremont National Forest contains 601 total CVS plots. Plots with dominant species by basal area of lodgepole pine (Pinus contorta), ponderosa pine (Pinus ponderosa), or white fir (Abies concolor) were used in the analysis. Plots with other dominant species associated with higher-elevation long duration fire cycles or non-forested plots associated with grasslands, rocky outcrops, or water were not considered in this analysis. For the Fremont National Forest, 61 plots were dominated by juniper (Juniperus occidentalis). While these areas may well benefit from fuel reduction, presently there is no growth model for this species. For this reason the plots dominated by juniper were not used to conduct treatment response simulations. However, an estimate of available juniper biomass based upon representative volumes/acre is included in this report. Juniper harvests could augment feedstock supplies for biomass-to-energy projects and juniper removals are considered likely to reduce overall forest fire risk (Swan 2002). A total of 502 plots or 84% of the total plots for the Fremont National Forest (FNF) were selected as forested areas to be evaluated for treatment simulations.
A total of 663 CVS plots were available from the Okanogan National Forest. Plots used in the analysis were those in which the dominant species, determined by basal area, was ponderosa pine, lodgepole pine, Douglas-fir (Pseudotsuga menziesii), or western larch (Larix occidentalis). Plots with other dominant species associated with higher elevation long duration fire cycles and non-forested plots were considered not suitable and were removed from the data set used for this analysis. The number of plots used in the simulations for the Okanogan National Forest (ONF) was 413 or 62% of the total available CVS plots.
The selected 502 plots (FNF) and the 413 plots (ONF) from the CVS database were used to create two forest inventory datasets representative of the variety and distribution of forest age classes, densities, tree species, tree sizes, and crown characteristics present in the ONF and the FNF that would be subject to consideration for hazardous fuel reduction treatments. For purposes of conducting forest-wide simulations, the data from each plot has been assumed to represent the inventory of a one-acre forest stand. Subsequently, the simulated FNF will have a 502 acre "forest" and the simulated ONF will have a 413 acre "forest". To expand per acre volumes from CVS data for landscape inventory estimates, one would use 1849.6 as an expansion factor resulting from the 1.7 mile grid used to systematically distribute CVS sampling point locations. Harvest and growth simulations for these two "forests" will be conducted that have been designed to determine the relative performance of alternative fuel reduction strategies as assessed by a variety of metrics that include risk reduction effectiveness, economic performance, habitat displacement/creation, and carbon sequestration/release/offset.
2.3.2 Literature and Reports
An effort has been made to review pertinent elements of the scientific literature and various government reports in order to achieve several informational goals identified by the research team as important to the results of this project. In addition to general background information on the history and magnitude of wildfire risk associated with overstocked forests, other information including but not limited to logging and hauling costs, forest product types and values, Forest Service administration costs, Forest Service contracting authorities, community demographics and infrastructures, etc. has been assembled to best inform this investigation. It is the hope of the authors that referenced information collected as part of this project has broader educational utility to assist collaborative processes seeking better achievement of wildfire risk reduction.
2.3.3 Personal Interviews
Many individuals generously contributed information founded upon their professional and personal experiences. For example, operational cost estimates and log market reports provided by private contractors served to enrich the quality of cost data from other sources. Suggestions from local people on how to customize Forest Service contract offerings for increased efficiencies proved to be essential for better understanding of operational possibilities customized to local circumstances. The valuable insights provided to this project from personal interviews served to underscore a recurring theme in this project: solutions will likely be based upon integration of anecdotal and institutional knowledge that customizes treatment strategies to local conditions.
![]()
| Table 2.1. Interviews |
| Sector | Fremont |
Okanogan |
Total |
| Forest Service | 10 |
13 |
26 |
| State | 3 |
6 |
9 |
| Mills | 6 |
3 |
9 |
| Contractors | 11 |
8 |
19 |
| Organizations | 6 |
5 |
11 |
| Total | 36 |
34 |
71 |
2.4 Assessments of Initial Forest Conditions
2.4.1 Fire Risk Classification
High, moderate, and low fire risk was estimated for each CVS plot in the simulation dataset based on the Severe Crowning Index assessment from the Potential Fire Report produced by FFE. The Crowning Index indicates the estimated wind speed in miles per hour (mph) at 20 feet off the ground that would initiate an active crown fire assuming ignition of a surface fire. Assumptions required by the model include a temperature of 70 degrees Fahrenheit and 'very dry' moisture conditions (Crookston, Beukema et al. 2002). Results from the crowning index estimates for each stand were sorted into one of three risk classes. Lower wind speeds indicate greater risk. If the crowning index was less than or equal to 25 mph, then the plot was considered to be in the high fire risk category. Moderate risk stands were those with a Severe Crowning Index greater than 25 mph, but less than or equal to 50 mph. Low fire risk stands were those with a crowning index greater than 50 mph. Very young or clearcut stands function outside of the range of the model and subsequently record Severe Crowning Indices less than zero. To accommodate this model behavior, stands with a crowning index below zero are classed as low risk.
| Table 2.2 Fire Risk Classifications |
| Fire Risk Classification | Severe Crowning Index |
| Low | > 50 MPH & < 0 MPH |
| Moderate | > 25 |
| High | |
It should be noted that risk classifications are arbitrary thresholds useful and necessary for comparative analysis but that they may very well understate the risk at the margins. The word moderate properly segments a risk difference between high and low although the risk of a fire from wind speeds only slightly higher than 25 MPH might not be considered a moderate risk by many publics. It is in part for this reason that performance comparisons for treatment alternatives were reported in this investigation for high and moderate as separate risk classes and then combined as the total area to be considered for risk reduction treatments.
The initial 1995 fire risk distribution for the Fremont and Okanogan National Forests was reported as the percentage of CVS plots in each of the fire risk categories for 1995 prior to any treatment or growth simulation. Fire risk distribution was similarly reported for projected and treated plot inventories at each growth cycle. For purposes of simulations to demonstrate comparisons between treatment alternatives only the plots with high and moderate initial classification were treated. Low risk areas did not receive treatment simulations since treatments of low risk areas would logically be considered unnecessary or of low priority. While some low risk areas may experience increases in risk over time most low risk areas appear to be either very young small diameter forests or rangeland/forest interface with sparse distributions of forest inventories that are unlikely to require fuels reductions at the time of this study.
2.4.2 Forest Structure
Forest structure was determined using an approach utilized by the Business Bureau of Economic Research at the University of Montana in "A strategic assessment of fire hazard in Montana" (Fiedler et al. 2001). This canopy structure classification system identifies stands as being single-layered, two-layered, multi-layered, or scattered. Five potential layers could be present in a stand, based on a minimum amount of basal area in a diameter size class. The sapling size class required at least 5 square feet of basal area in trees with less than 5" DBH to be present. The pole, medium, large, and very large size classes included trees within a DBH range of 5-9", 10-15", 11-20", and greater than 20", respectively. These size classes required at least 10 square feet of basal area to be present to be considered as a canopy layer. Stands classified as single- and double-layered had one and two size class layers present, respectively. Multi-layered stands had more than two layers present. Scattered stands had no layers present and at least 25 square feet of basal area in the stand. Using this system, each plot was classified in 1995. The initial stand structure distribution for each landscape was determined as the percentage of plots in each category.
![]()
2.4.3 Forest Type
Forest type for the Fremont National Forest was determined based on criteria provided by the Sue Puddy, the Silviculturist at the Fremont National Forest. This classification system identified plots by dominant species and structure. The categories were Ponderosa Pine Closed, Ponderosa Pine Moderate, Ponderosa Pine Open, Ponderosa Pine Very Open, Juniper, Lodgepole Pine, Mixed Closed, and Mixed Open. Plots with at least 12 ponderosa pine trees per acre (TPA) with a DBH greater then 14" were classified as one of the Ponderosa Pine types. The canopy closure algorithm by Crookston and Stage (1999) was then used to distinguish Ponderosa Pine Closed (greater than 50% canopy closure), Ponderosa Pine Moderate (35-50%), Ponderosa Pine Open (25-35%), and Ponderosa Pine Very Open (less than 25%). Plots with greater than or equal to 70% of the TPA in juniper were classified as Juniper. The Lodgepole Pine forest type was defined by plots with greater than or equal to 50% of the total TPA in lodgepole pine and less than 15% of the total TPA in ponderosa pine trees with a DBH greater than 10". Plots in the Mixed forest types were classified as not meeting any of the above criteria. Mixed Closed plots had greater than 40% canopy closure. Mixed Open plots had less than or equal to 40% canopy closure. Forest type distribution for both the Fremont and Okanogan National Forests were reported as the percentage of plots in each structure type in 1995.
Forest type classifications for the Okanogan National Forest were used to sort the percentage of plots in Cold Dry, Dry, Mesic, and Moist conditions. Cold dry forests typically have mixed mortality fires in an elevation range from 6000-7200 ft. Dry forests have 7.5-50 year fire return intervals and are found from 1,200 to 5000 ft. Mesic forests experience weather driven catastrophic fire events every 100 or more years found in a wide elevation range from 1800-6000 ft. Moist forests are 100 to 300 year fire return interval found in mid elevations of 3000-4500 ft (Northeastern Cascades Late-Successional Reserve Assessment Team 1998). The forest type was determined using plot locations, which are UTM coordinates, for each CVS plot which were "joined" in the GIS with a forest type layer provided by John Townsley, the Silviculturalist at the Okanogan National Forest.
2.5 Growth, Treatment, and Wildfire Simulation
To analyze the relative effectiveness of alternate harvest treatment intensities on fire risk reduction and the subsequent economic results, four silvicultural prescriptions were developed to conduct harvest simulations for each CVS plot for the Fremont and Okanogan National Forests. A No-action simulation of growth without disturbance and a Wildfire simulation where all acres were ignited were conducted to represent opposite ends of a control spectrum to evaluate do nothing verses the consequences of potential fire disturbances verses effectiveness of the risk reduction treatments. The four harvest treatments were selected to span a range of removal intensities, removing various categories of trees from the very small to the very large and with both fixed and variable density targets. The treatment alternatives were selected, as well, to be readily comparable to simulation findings emerging from other fire risk reduction research projects. All harvest simulations growth projections were done using variants of FVS within LMS. The East Cascades (EC) Variant of FVS was used for the Okanogan inventories, and the South Central Oregon and Northeastern California (SORNEC) Variant of FVS was used for the Fremont inventories. Simulated treatments were conducted in 2000. Post-treatment inventories were grown forward to 2030 using 5-year growth simulation periods. A set of results were developed with and without ingrowth. Alternatives models included No-action (no treatment or disturbance within the study period), four different harvest treatments, and a wildfire simulation.
The six treatment prescriptions that were developed to investigate the response of different forest types to different treatment strategies include:
No-action (No action). This prescription assumes no harvest activities and no wildfire for the duration of the simulation period. While no wildfire seems an unrealistic expectation, this simulation is valuable to display increases in risk for the forest landscape over time.
Remove 9" and Under (9 and under). This prescription harvests all trees 9" in diameter at breast height (DBH) and smaller. This treatment represents an approach in use by the Forest Service and recommended by Babbitt and Glickman in 2000.
Remove 50% BA, From Below (Half BA). This treatment is a removal of half of the total basal area (BA)/acre by removing the smallest trees (thinning from below).
Leave 45 sqft BA, From Below (BA 45). This treatment is intended to simulate restoration of savannah-like conditions that are similar to what has been described in literature as the pre-settlement open-stand conditions that resulted from frequent but low wildfires (Agee 1993). In the FNF, all ponderosa pine were left standing, while in the Okanogan both ponderosa pine and western larch were favored as leave trees. In both cases, these species were selected for retention in order to help restore these forests to what is considered to be an open pre-settlement condition dominated by thick bark fire tolerant species. For an example of what BA 45 means as a management target consider that if trees are approximately 12" DBH then at BA 45 approximately 57 trees per acre (TPA) would be left after harvest. TPA = BA/DBH2*.005454
Remove 12" and Greater, From Above (12 and over). This treatment is to simulate harvest designed to maximize economic return by taking the largest and most valuable trees that are 12" DBH and larger. This practice was commonly known as "high grading" in the first half of the twentieth century. This simulation conservatively estimates the value of stand inventories at risk from wildfire.
Wildfire Simulation (Wildfire). This simulation
is undertaken to demonstrate the levels of mortality for different
stand inventories that might be associated with wildfire. The
wildfire was simulated using the FFE extension within FVS. Burn
conditions to be specified in the model were a temperature of
70 degrees Fahrenheit, a wind speed at 20 feet in the stand
of 20 miles per hour, and nominal moisture levels of "very
dry" (Crookston, Beukema et al. 2002).
All treatments and the wildfire simulation occurred in year
2000. The four thinning treatments modeled included a removal
of all trees with a DBH less than or equal to nine inches (9
and under); a thin from below removing 50% of the original basal
area (Half BA); a thin from below with a residual basal area
target of 45 square feet favoring ponderosa pine and western
larch (BA 45); and a removal of all trees with a DBH greater
than or equal to 12 inches (12 and over).
Results were produced for each alternative with and without regeneration to simulate either controlled burn fuel removal or fire risk impacts associated with accumulating fuel loads from ingrowth. Simulations with regeneration were modeled to have a stocking level of 500 trees per acre 4 years after a treatment or wildfire. The distribution of species for the new seedlings was based on the distribution of species by basal area in the residual stand. No-action simulations received no regeneration. All simulations including No-action utilize FVS to "grow" existing inventories (including regeneration where applicable) forward through time to the end of the simulations period at 2030.
![]()
2.6 Analysis of Economics
Each of the four harvest alternatives were also analyzed to examine the positive or negative net revenue that resulted when estimated harvest and hauling costs were subtracted from the gross revenues from sale of estimated log yields. Interviews provided a range of primary data regarding local logging and hauling costs and log values by grade and species per thousand board feet (MBF). Secondary data was also gathered from available Forest Service documents and market reports that show the current market opportunities and trends of historic log prices. The collected cost information for operational costs/acre, and average log values/MBF that were incorporated into the economic evaluation of the treatment alternatives examined in this project are described later in the text. Within LMS, a bucking algorithm was used to optimize estimates of log segments that result from trees harvested in simulated silvicultural treatments. Estimated volumes of logs by grade and species from harvest simulations were multiplied by delivered log prices to estimate gross harvest revenue for each stand (plot). The gross and net revenue per acre were computed based upon subtraction of local logging and hauling costs from local market log values by species and grade. In some cases, effective fuel reductions required the removal of non-merchantable small diameter trees. Where this was the case an additional operational cost/acre referred to in this study as pre-commercial thinning (PCT) was charged against gross revenues to complete the economic analysis for each stand. The gross log value/acre minus the logging, hauling, and (PCT) costs equals net economic return per acre. Estimates of preparation, administration, and litigation costs to the USFS are not considered in this economic analysis but have historically been significant as noted in the USFS publication "The Process Predicament" (USDA Forest Service 2002).
2.6.1 Conversions
To utilize the specific logging costs, hauling costs, and log value estimates that were gathered from interviews and publications, some numbers required conversion from tons to thousand board feet. Forestry professionals from both National Forests were interviewed for the appropriate conversion factor to use. Weight to volume conversion factors are by nature variable due to water content in log, tree species, and time since the log has been felled. A conversion rate of 7 tons/MBF was agreed to be most generally representative and was selected to be used to convert some costs and values based on tonnage into $/MBF. Table 2.3 shows the range of conversion factors that resulted from local interviews (local interviews 2002).
| Table 2.3. Tons per Thousand Board Feet (MBF) for Eastern Washington and Oregon |
| High |
Low |
Average |
| 5.6 |
8.6 |
7 |
2.6.2 Logging and Hauling Costs
Nineteen logging contractors were interviewed in Oregon and Washington. These loggers were willing to share information on the logging equipment mixes that they have, the costs to log with their equipment, and the cost to haul the wood to the mill. The haul costs were assigned based on the interview results according to the average haul the loggers suggested for each forest. Harvest operations costs estimates collected from these contractors include both cable and ground based logging operations. Table 2.4 shows the high and low logging, hauling, and PCT costs per acre. These costs were assigned by calculating an average of all the high and low operations costs collected from contractors for each forest. These figures were used for economic valuation of thinning simulations for the FNF and ONF. The PCT costs are included to estimate the range of costs required to thin some of the non-merchantable stems in conjunction with the removal of any merchantable material. A low PCT cost of $300/acre and a high of $500/acre were used to simulate treatment of non-merchantable material as part of fuel reductions in any stand with greater than 200 TPA 6" in diameter or smaller. The interviews with contractors and USFS employees suggested 200 TPA, of submerchantable material as the threshold of when PCT costs become a realistic addition to logging costs. PCT costs include removal of submerchantable material to the road or landing. This material could be used as biomass fuel for energy generation, but has historically not been economically feasible to remove to a conversion site.
![]()
| Table 2.4. FNF and ONF Low and High Logging, Hauling/MBF and PCT Costs per Acre |
| Harvest Type by Location | Low |
High |
| Fremont Cable | $160 |
$246 |
| Fremont Ground | $132 |
$217 |
| Okanogan Cable | $210 |
$296 |
| Okanogan Ground | $182 |
$267 |
| Pre-Commercial | $300 |
$500 |
There is a high degree of variability in logging and hauling costs suggested by interview respondents. To demonstrate a representative range of potential operations costs, simulated harvest yields were analyzed for both high and low cost for the four thinning treatments. Interviews with many employees in the Forest Service, Department of Natural Resources, and Oregon Department of Forestry served to confirm contractor cost estimates and validate the range of costs per acre. Several factors including equipment, terrain, contract specifications, and density of stand are known to influence operation cost variability. In addition, many of those interviewed commented on their experiences logging for the USFS compared to logging on private land. Some contractors reported that higher operations charges were necessary to profitably operate on federal forests as opposed to private or state owned forest lands. Other contractors reported that as a result of unfavorable experiences with USFS contracts that they only work on private land now. Interview comments suggested that the many complicated factors regarding contract requirements for harvest activities on federal lands have made such operations difficult and expensive.
2.6.3 Mill Log Values
Logs that are removed during fuel reduction thinnings, can
include a mixture of non-merchantable trees, pulp logs and sawlogs.
Interviews with mills around the FNF and ONF were combined with
log price market reports to estimate delivered log prices. Prices
in this study are current as of August 2002. Table 2.5 shows
the average prices by grade and species collected from nine
mills and three regional log value reports.
| Table 2.5. Regional Log Sort Values $/MBF Used for Economic Valuation |
| FNF Sorts | PP |
DF |
LP |
RC |
WP |
ES |
WF |
GF |
AF |
WL |
WH |
| Pulp | 100 |
122 |
122 |
122 |
|||||||
| Hewsaw | 452 |
||||||||||
| Saw 4 | 400 |
||||||||||
| Saw 3 | 530 |
||||||||||
| Saw 2 | 575 |
||||||||||
| Saw 1 | 625 |
270 |
300 |
||||||||
| ONF SORTS | PP |
DF |
LP |
RC |
WP |
ES |
WF |
GF |
AF |
WL |
WH |
| Pulp | 100 |
100 |
100 |
100 |
100 |
100 |
100 |
100 |
100 |
100 |
|
| Hewsaw | 350 |
350 |
322 |
377 |
343 |
350 |
336 |
336 |
350 |
336 |
|
| Saw 4 | 331 |
462 |
|||||||||
| Saw 3 | 487 |
525 |
|||||||||
| Saw 2 | 525 |
410 |
289 |
585 |
343 |
300 |
300 |
300 |
410 |
300 |
|
| Saw 1 | 800 |
479 |
375 |
711 |
628 |
428 |
330 |
330 |
479 |
330 |
![]()
2.6.4 Net Revenue Calculation
Volumes of harvest were simulated for alternative thinning treatments and divided to estimate potential yield volumes by species and grade estimated by the bucking algorithm in LMS. Estimates of merchantable volumes of pulp and sawlogs were divided by species and grade. Each species and grade volume was multiplied by the assigned price per MBF. Gross estimated revenues from log sales were determined for each stand and for each treatment alternative by summing species and grade returns for each stand. Treatment costs were subtracted from gross revenue from log sales to determine net revenue. The average net revenues for each treatment type by risk class were calculated for comparison with risk reduction success resulting from each treatment alternative. Risk reduction and the associated economic results when compared for each treatment alternative are presented to offer dual measures of effectiveness. Such comparisons are valuable to foresters planning treatments for maximum risk reduction at least cost. Since harvesting and hauling contractor costs are subtracted from gross revenues, the resultant positive or negative net return from each treatment simulation may be considered indicative of either potential timber sale revenues (theoretical bid maximums in excess of operational costs in the case of a positive returns) or stewardship costs for risk reduction (while logs may not be profitable from a timber sale prospective they do have sufficient value to discount fuel reduction costs when included in a combined goods and services transaction). Neutral returns mean that the value of the logs harvested will cover the risk reduction treatment costs but do not have sufficient value to warrant a timber sale offering. In some cases foresters may want to combine treatments and stands such that the positive revenues available from one stand fuel reduction harvest can be used to offset the negative revenues associated with another stand fuel reduction harvest. This may be done to create a service contract that is cost neutral or a timber sale where the harvest value of some stands carries the cost of fuel reductions for other stands and still yields positive revenue.
2.6.5 Market and non-market values of fire risk reduction
Removal of small diameter trees to reduce hazardous fuel conditions is known to be costly. Large trees can be removed for their lumber and other product values as reflected in the market; however, the market value for the smaller logs is often less than the harvest and hauling charges. However, failure to remove small diameter logs results in the retention of ladder fuels that support the transfer of ground fire to crown fire and aggravate negative wildfire impacts to the landscape.
Unfortunately, the market does not automatically reflect the value of negative environmental consequences that result from crown fires. If the negative impacts that result from crown fires were fully reflected in the market, there would be high motivation to avoid them, providing the necessary incentive to remove high fuel loads in spite of the cost. There are many non-market values associated with reduction of fire risk that should be important to forest owners and to society at large. For example, the cost of fighting fire could and should be considered a cost of not removing high fuel loads. Similarly, there is the value of avoiding facility losses and fatalities. Communities value a lower fire risk and reduced smoke. Habitats for threatened and endangered species are valued by many publics but may be lost to wildfires. Fires reduce the carbon stored in the forest and the opportunity to produce long lasting pools of carbon stored in products. Fires prevent the use of biomass for energy conversion and green energy credits. Regeneration after fires is problematic and costs are high. Post-fire rehabilitation is needed to avoid serious erosion and water contamination from excessive sediment. Surface water consumed by overly dense stands could be saved for other uses such as salmon habitat, municipal reservoirs, and irrigation. There are also forgone rural economic development benefits from the taxes and rural incomes that result from fuel reduction harvest and utilization. Since economic activity in these regions has been in decline as a consequence of the policies to lower federal harvests, any reduction in unemployment has higher than normal leverage on state and local finances by lowering assistance costs.
There may be some negative impacts from fire risk reduction activities offsetting these benefits such as root damage to the trees that are being left in the overstory. These factors need to be considered as possible offsets to the benefits of lowering the risk of infestations and decease caused by high stand densities. A complete benefit cost analysis would attempt to determine the broader benefits and costs of fire risk reduction treatments.
The purpose of this study has been to assemble technical tools
and methodologies to assist the design and management of fire
risk reduction activities for integration of a suite of public
values through strategies customized to local conditions. A
review of available literature has been undertaken to develop
estimates of non-timber market and non-market values to inform
a comprehensive cost/benefit analysis of fuels reduction treatment
alternatives.
3. CASE STUDY SITE DESCRIPTIONS
The Fremont National Forest (FNF) in Oregon and the Okanogan National Forest (ONF) in Washington were selected as study areas for this project. Both of these National Forests are located within the dry interior portion of the western United States. Both of these forests are thought to have had frequent fire return cycles, prior to European settlement, that created many areas that were dominated by open stands of ponderosa pine (Fremont National Forest 2003; Okanogan National Forest 2003). Both the FNF and the ONF contain substantial acreages of overstocked forests that are considered to be at risk from wildfire Table 3.1. Both National Forests have experienced destructive wildfires in recent years. The communities surrounding these two forests provide a variety of infrastructure options to remove fuel from overstocked stands. However, the logging, transportation, and processing of low value smaller wood has historically not been profitable. The rural communities surrounding these forests have experienced double-digit unemployment and economic declines due to job losses associated with reductions in federal timber harvest volumes. Individuals, organizations, and businesses from both areas demonstrated interest in this investigation and contributed valuable reference information through personal interviews. The citizens of these local Oregon (OR) and Washington (WA) communities appear eager to meet the challenge to remove the fuel from forests with a high fire danger.
| Table 3.1. Acres in Initial Fire Risk Class for Forests on FNF and ONF |
| National Forest | High |
Moderate |
Low |
Total |
| Fremont | 284,838 |
436,506 |
207,155 |
928,499 |
| Okanogan | 216,403 |
369,920 |
177,562 |
763,885 |
3.1 Fremont National Forest
The FNF is in the south central dry interior of the state of Oregon. There are several rural communities surrounding the FNF boundary. The forest lies roughly between the towns of Lakeview, Klamath Falls and Bend, Oregon just north of the California/Oregon border (Figure 3.1). The majority of the 1,198,301 acres within the boundary of the FNF are in Lake County which is 8,359 square miles. The population of Lake County is 7,470 and neighboring Klamath County is 64,116 (US Census Bureau 2003). The town of Lakeview is at the Southeastern corner of the FNF close to the California border and has a population of 2,800 (Fremont National Forest 2003). Lake County has .9 people per square mile. The unemployment rate for 2002 was 8.7% and it was 10.4% in 2001. The high for the 1990's was an unemployment rate of 12.2% (Lake county 2003). "Lake County was also the only county in the state that experienced a net job loss during the 1990's" (Kauffman 2001).
The forest includes wildlife and tree species adapted to the climate and elevation variation from 5,000 to 7,000 feet with mild terrain on slopes roughly 40% and less. About half the FNF is a mixed open forest type; see Figure 3.2, with multi-structured canopies. See Figure 3.3 with Elevation Class Distributions.
![]()
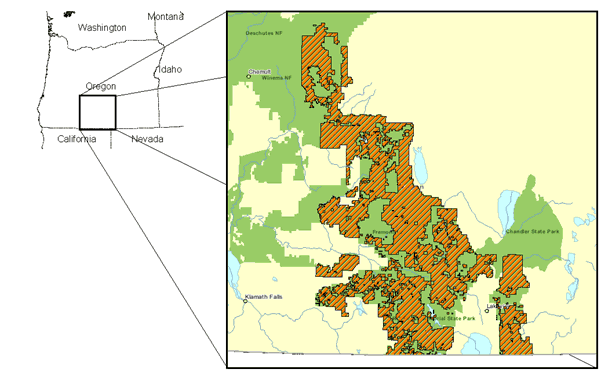 |
| Figure 3.1. Fremont National Forest Boundaries |
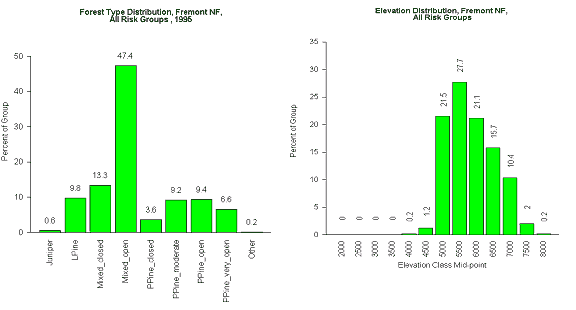 |
| Figure 3.2. FNF Forest Type Distribution | Figure 3.3. FNF Elevation Class Distribution |
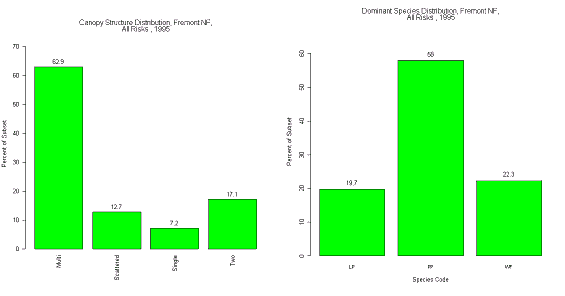 |
| Figure 3.4. FNF Canopy Structure Distribution | Figure 3.5. FNF Dominant Species Distribution |
![]()
Half of the forest plots have greater than 500 trees per acre
(TPA). The basal area per acre (BA) ranges from less than 50
ft2/acre to over 250 ft2/acre. The most
abundant quadratic mean diameter (QMD) class is four inches.
See Figures 3.6, 3.7, and 3.8. The major tree species include
ponderosa pine, juniper, lodgepole pine, and at higher elevations
white fir. Most of these trees are adapted to summer drought
and extreme temperature fluctuations due to the nature of the
arid region (Fremont National Forest 2003). The 10-20 inches
of average precipitation occur from the autumn through the spring
and as a result the summers are dry and hot. Of the 502 plots
on the FNF the fire risk distribution is 154 high, 236 moderate,
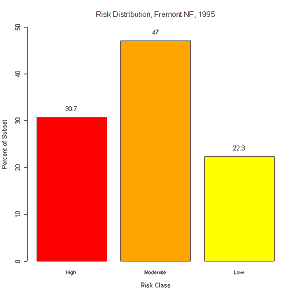
112 low risk. Figure 3.9 shows high (30.7%), moderate (47%),
and low fire risk (22.3%) as a percentage of total forest of
total forest acreage.
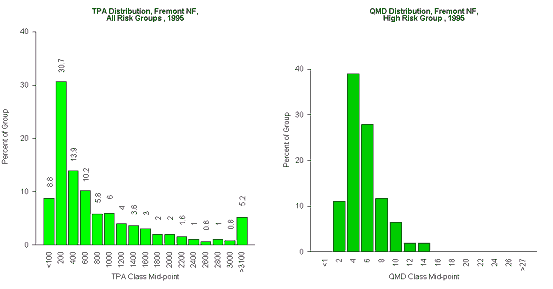 |
| Figure 3.6. FNF TPA Class Distribution | Figure 3.7. FNF QMD Class Distribution |
 |
 |
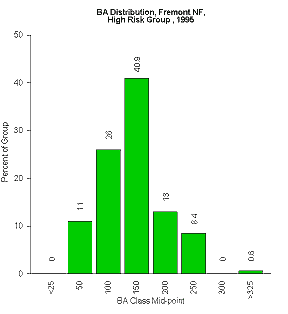
| Figure 3.8. FNF BA Class Distribution | Figure 3.9. FNF Risk Distribution |
The results of risk analysis conducted with FFE indicate that 77.8% (390 plots/stands) of FNF is presently in a moderate to high risk condition with 30.7% (154 plots/stands) of the FNF considered to be high fire risk forests. There is 22.3% (112 plots/stands) of FNF in the low risk classification. The FNF has experienced destructive wildfires in recent years. In 2002 over 125,000 acres of the FNF burned due to wildfire (local interviews 2002).
In 2001 22 MMBF were harvested from FNF (local interviews 2002). There is one mill in Lakeview, Oregon. However, as many as 4 mills in the surrounding area receive logs from the FNF. The Fremont National Forest also has a sustained yield unit, and a network of local publics and non-profit organizations working to maintain forestry infrastructure.
![]()
3.2 Okanogan National Forest
The Okanogan National Forest (ONF) is located in north central Washington. In 2000, the ONF was merged with the Wenatchee National Forest to become the Okanogan-Wenatchee National Forest. Okanogan is the northern portion of what is now the Okanogan-Wenatchee NF. Figure 3.10 shows the original Okanogan National Forest boundary. The Okanogan National Forest consists of 1,226,550 acres total that are spread across four counties including Skagit, Whatcom, Okanogan, and Chelan counties. The population is most concentrated around the towns of Omak and Okanogan. Several of the other towns close to the forest include Oroville, Tonasket, Twisp, Brewster, Winthrop, Chelan, and Leavenworth. The population in 2001 for Okanogan County was over 20,100 and for Chelan County 67,000 (US Census Bureau 2003). The unemployment rate for the past ten years has been over 10% for Okanogan County. In 2000 it was 11% and 2001 it was 10.8%.
ONF is predominately a dry forest type. The ONF has some rugged
terrain located from 3000 to 6000 feet in elevation. The Okanogan
National Forest is dominated by multi-structured Douglas-fir,
lodgepole pine, ponderosa pine, and western larch with a QMD
of less than 12". The BA per acre of the forest plots ranges
from less than 25 ft2/acre to more than 200 ft2/acre.
Tree densities for the majority of the forest plots range from
250 to 4000 TPA (See Figures below).
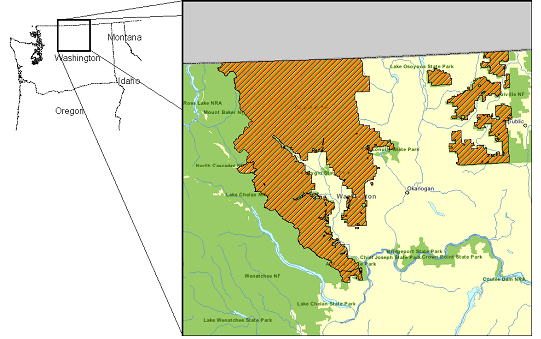 |
| Figure 3.10. Okanogan National Forest Boundaries |
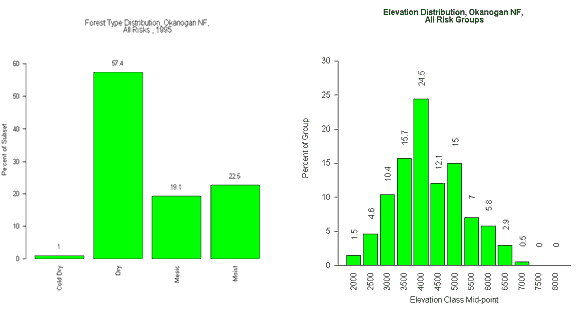 |
| Figure 3.11. ONF Forest Type Distribution | Figure 3.12. ONF Elevation Distribution |
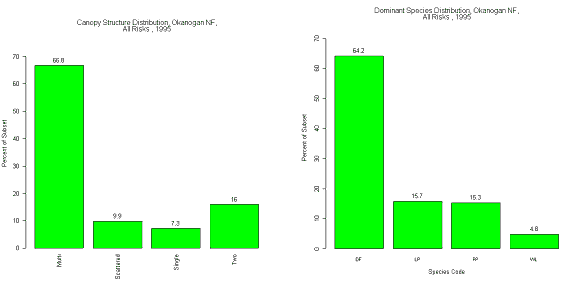 |
| Figure 3.13. ONF Canopy Structure Distribution | Figure 3.14. ONF Dominant Species Distribution |
![]()
Most of these trees in the ONF are adapted to summer drought; high summer temperatures of 90 degrees Fahrenheit are not uncommon (Okanogan National Forest 2003). The 20-40 inches average precipitation occurs from the autumn through the spring with summers that are dry and hot (local interviews 2002).
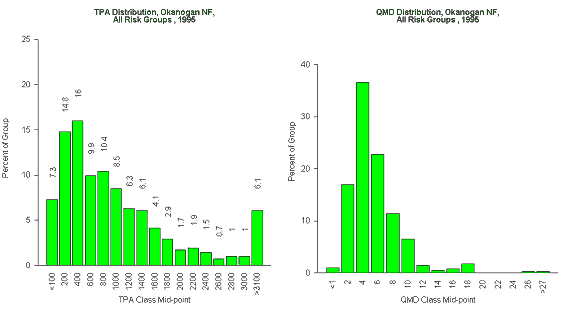 |
| Figure 3.15. ONF TPA Class Distribution | Figure 3.16. ONF QMD Class Distributions |
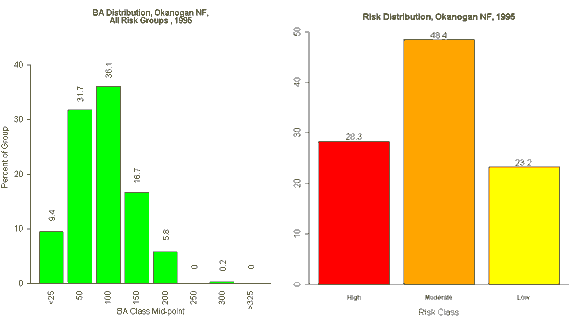 |
| Figure 3.17. ONF BA Class Distribution | Figure 3.18. ONF Risk Distribution |
Results of FFE analysis of the ONF data in Washington indicate that of the 413 stands total, 117 (28.3%) are classified as high risk, 200 stands (48.4%) are moderate risk, and 96 stands (23.2%) are low fire risk. There have been large fire years in the past decade in 2000 and 1994 on the ONF. The mills and infrastructure surrounding the ONF are further distances away from the forest as compared to the mills around the FNF. Subsequently, the haul distances and costs required to transport the wood to processing facilities are normally higher in the ONF than in the FNF. There are also a wider variety of species in ONF that, with fuel reductions treatments, may potentially be available for harvest yet may require long-distance hauling to a wide variety of mills. Federal harvest reductions have been more dramatic in the ONF than the FNF. Today the ONF harvest is only a fraction of a percent of the 10 year average reported in the 1989 Okanogan National Forest Plan. The total harvest on the ONF for 2001 was .1 MMBF. Whereas in 1989 the 10 year average harvest volume was 71 MMBF for the Okanogan National Forest (Okanogan National Forest 1989).
![]()
4. RESULTS
4.1 Fire Risk Results
4.1.1 Fremont National Forest
As shown in Figure 3.9, 30.7% (154 plots) of the 502 plots on the FNF are in high fire risk classification. There appear to be some common characteristics of high fire risk stands on the FNF. High risk stands have thin bark species and multi-layered canopies that are indicators of past fire suppression (Agee 1993). Figures 4.1 and 4.2 display the species and structure distribution within high fire risk stands on FNF. The majority of the stands designated as high fire risk are white fir dominated (53.2%) and have multi-layered canopies (94.2%). The presence of white fir, a thin barked shade tolerant and fire intolerant species, as well as, multi-layered canopies would indicate that wildfire has been successfully suppressed and that the current condition is not reflective of historic frequent
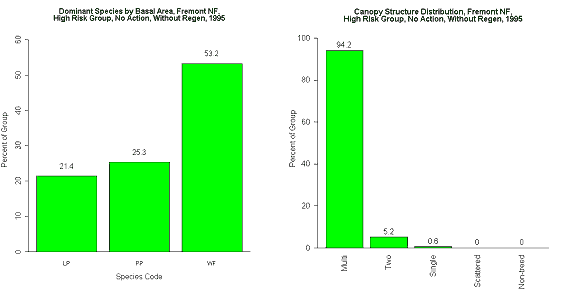 |
| Figure 4.1. FNF High Risk Species Distributions | Figure 4.2. FNF High Risk Structure Distributions |
Conversely, the low risk stands are dominated by ponderosa pine and scattered canopy structure. The presence of ponderosa pine (Figure 4.3) and scattered structures (Figure 4.4) might suggest that some low risk stands could be rangeland/forest interface with a low density of residual overstory trees. See the Appendix B for a full set of tables and charts that display initial and post-treatment forest conditions for FNF.
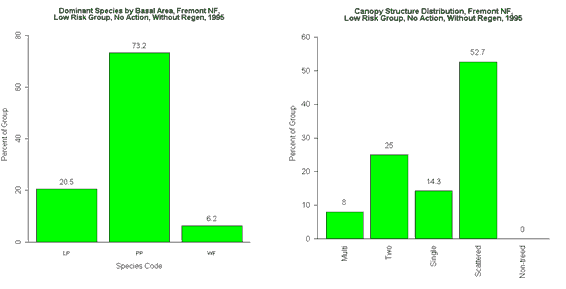 |
| Figure 4.3. FNF Low Risk Species Distributions | Figure 4.4. FNF Low Risk Structure Distributions |
Treatment simulations results indicate that the thinning treatments, Half BA and BA 45, may be the most effective in reducing fire risk in high and moderate risk forests. After the Half BA treatment, 55.4% of high and moderate risk forests were transitioned to low risk while after the BA 45 treatment, 63.8% of high and moderate risk forests were transitioned to low risk. This is compared with the 9 and under treatment which results in 22.1% of the high and moderate stands in the low fire risk category after treatment. The 12 and over treatment results showed a transition of 20.5% of high and moderate risk stands to low risk.
![]()
| Table 4.1 a,b,c. FNF Post-treatment
Conditions for Stand Originally in High and Moderate
Risk Classes |
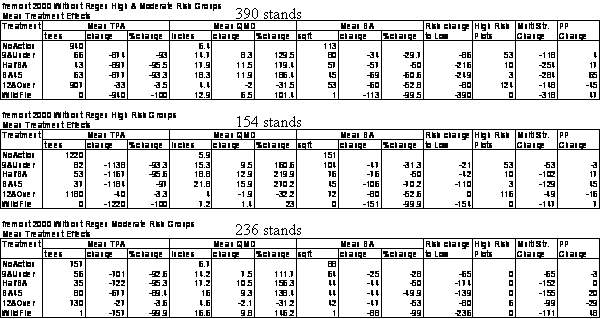 |
Table 4.1 a,b,c presents a tabular summary of the comparative results of treatment simulations for the FNF. On the Fremont National Forest, the Wildfire simulations for high and moderate risk stands resulted in close to 100% mortality as evidenced by post-treatment trees per acre (TPA) displayed in Table 4.1 a,b,c. Half BA and BA 45 resulted in the highest post-treatment quadratic mean diameter (QMD). For the high risk stands, BA 45 resulted in the greatest reduction in basal area (BA) other than Wildfire but coincidentally had approximately the same post-treatment BA for moderate risk stands as Half BA because mean initial BA was 88 ft2/acre. BA 45 resulted in the greatest number of stands from both high and moderate risk classes that after treatment were no longer in the multiple canopy structure. BA 45, because of its requirement to retain ponderosa pine, resulted in the largest number of stands dominated by ponderosa pine after treatment.
Stands designated as in a high risk forest condition logically represent those forested areas with the most opportunity and the greatest need for fire risk reduction. Figures 4.5 and 4.6 on the following pages are presented to demonstrate graphic presentation of post-treatment risk reduction comparisons for high risk stands. As graphic presentation of Table 4.1 b, Figure 4.6 shows that the greatest reduction of risk that results from fuel removal treatments in high risk forests occurs with the BA 45. Figure 4.5 shows the response to treatment with regeneration included in the simulations. This is equivalent to thinning and not planning any future fuels reduction treatments such as thinning or burning to control fuel build up from regeneration ingrowth. Subsequently, 15 to 20 years after fuel reduction treatments, fire risk begins to increase dramatically, suggesting that entries for ingrowth removals should commence 10-15 years after treatment to prevent future risk increases.
Conversely, Figure 4.6 is intended to display the forest risk through time as it might be with a control burn program to remove risk from ingrowth. Reductions in risk are maintained into the future by excluding regeneration from the simulations. Amongst the high risk stands both the BA 45 and the Half BA treatments reduce risk in most of the stands; 151 or 98.1% of the BA 45 and 144 or 93.5% of the Half BA treated stands moved from high risk to either moderate or low risk status. However, the BA 45 treatment resulted in many more stands dropping from high to low risk status than the Half BA treatment. 110 plots (71.4%) went from high to low risk for the BA 45 treatment while only 42 plots (27.3%) went from high to low risk as a result of the Half BA treatment. The post-treatment growth simulations without regeneration for stands originally at high risk indicate that the number of stands in low risk classification actually increase slightly in the first cycle (average 4-5% depending on treatment) over time for the FNF, see Appendix B. This may be due to reductions to ladder fuels associated with growth of leave trees. See Appendix B for the full set of fire risk response results for FNF.
All three thinning from below treatments result in substantive risk reduction as does the Wildfire simulation. The 12 and over treatment does result in some risk reduction but does not result in any stands changing from high risk to low risk. Post harvest risk after 12 and over treatments increases, even without regeneration, back to high risk classification. No-action simulations result in net risk increases on high and moderate stands in the FNF. The Wildfire simulations result in near total mortality from crown fires in both high and moderate fire risk stands on FNF.
![]()
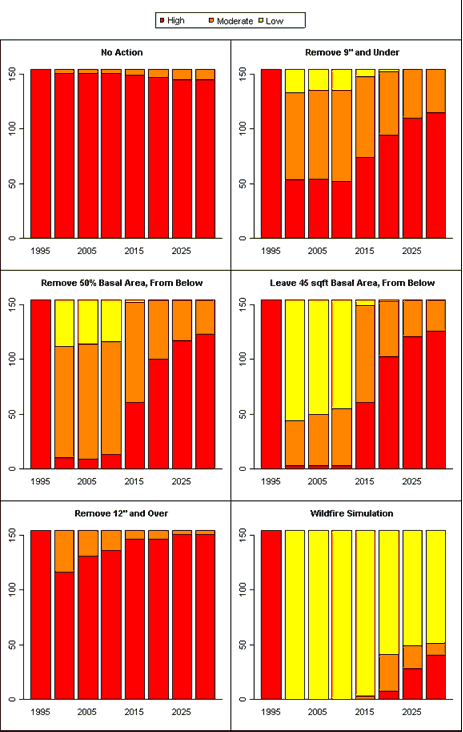 |
| Figure 4.5. FNF High Fire Risk Response to Six Simulations with Regeneration |
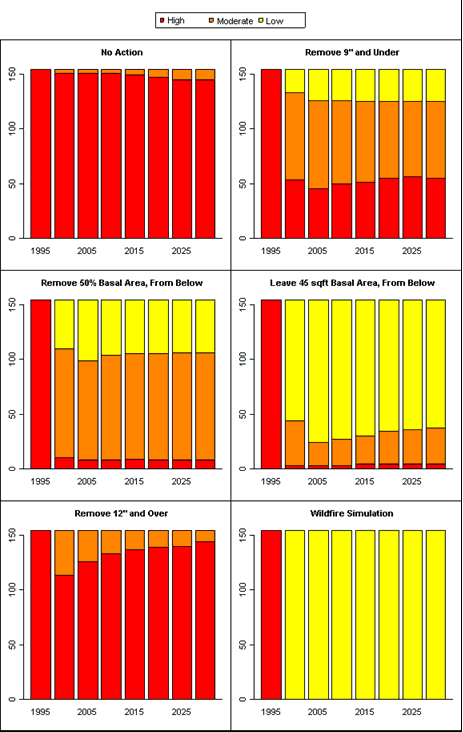 |
| Figure 4.6. FNF High Fire Risk Response with No Regeneration after Treatment |
4.1.2 Okanogan National Forest
As shown in Figure 3.18, high fire risk stands comprise 28.3% (117 plots) of the Okanogan National Forest stand data examined in this investigation. The most prevalent species in all ONF stands is Douglas-fir (64.2%). While Douglas-fir is not necessarily a thin barked species in inland west ecosystems it functions as a late seral shade tolerant species present when fire return cycles become infrequent (Agee 1993). Within high fire risk stands in the ONF, the percentage of stands dominated by Douglas-fir is (72.7%) and multiple canopy layers (89.7%) are the dominant forest structure. Both FNF and ONF appear to have high risk forest characteristics of multi-storied canopy and late seral dominant species that are likely a result of prolonged fire exclusion.
![]()
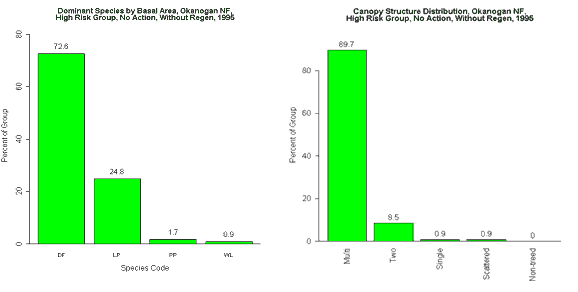 |
| Figure 4.7. ONF High Risk Species | Figure 4.8. ONF High Risk Structure Distributions |
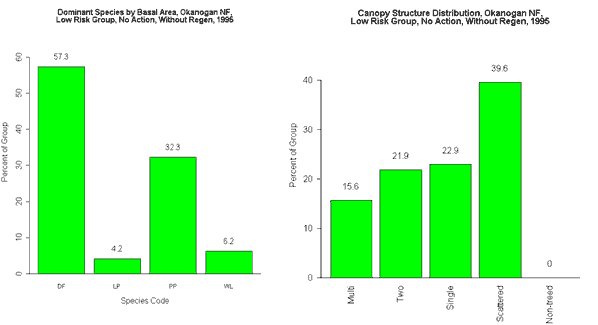 |
| Figure 4.9. ONF Low Risk Species Distributions | Figure 4.10. ONF Low Risk Structure Distributions |
While low risk stands in the ONF are also dominated by Douglas-fir they appear to have a higher percentage of ponderosa pine and western larch than high and moderate risk areas. The dominant canopy structure is scattered. See Appendix C for the full set of tables and charts that display initial and post-treatment forest conditions for ONF.
The response of the high and moderate risk classes to treatment simulations indicates that the treatment, BA 45, was the most effective in reducing the risk. Post-treatment results for BA 45 show 72.5% of high and moderate stands transitioned to low risk status. The Half BA treatment resulted in 56.2% of stands going to low risk after treatment. This is compared with the 9 and under which resulted in 35% of the stands in the low fire risk category. The 12 and over treatment resulted in 17.4% of high and moderate risk stands going to low risk, however, as with the FNF, most of these stands originate as moderate risk and rapidly return to higher risk. No-action resulted in increased numbers of stands in high risk over time.
![]()
| Table 4.2 a,b,c. ONF Post-treatment Conditions for High and Moderate Risk Classes |
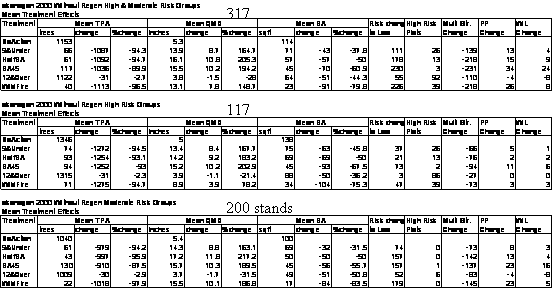 |
Due to the climate and inventory differences between the
ONF and the FNF, the Wildfire simulation on the ONF did
not result in total mortality to all forest inventories
as it did in the FNF. However, Wildfire simulations for
the ONF indicate that high and moderate risk classes did
experience a reduction in mean TPA of 96.5% and a reduction
in BA of 79.8%. High and moderate risk forests in the ONF
retained a mean TPA of 40 and a BA of 23 ft2/acre
after wildfire. Half BA and BA 45 resulted in the highest
post-treatment quadratic mean diameter (QMD). For the high
risk stands, BA 45 resulted in the greatest reduction in
basal area (BA) other than Wildfire. BA 45 resulted in the
greatest number of stands from both high and moderate risk
classes that after treatment were no longer in the multiple
canopy structure. BA 45, because of its requirement to retain
ponderosa pine and western larch, resulted in the largest
number of stands dominated by ponderosa pine and larch after
treatment. It is also a result of retention of ponderosa
pine and larch that BA 45 has larger post-treatment TPA
than either 9 and under or Half BA (Table 4.2 a,b,c).
High fire risk stands represent the highest level of fuel and the most critical opportunity for fire risk reduction. Figures 4.11 and 4.12 on the following pages are presented to demonstrate graphic presentation of post-treatment risk reduction comparisons for high risk stands. As with Table 4.2 b, Figure 4.11 and 4.12 show that the greatest reduction of risk that results from fuel removal treatments occurs with the BA 45. Figure 4.11 shows the response to treatment with regeneration included in the simulations. This is equivalent to thinning and not planning any future fuels reduction treatments such as thinning or burning to control fuel build up from regeneration ingrowth. Since the ONF is a wetter and colder forest, the increase in risk associated with accumulations of ingrowth may not be as rapid or as dramatic as the FNF. However, it is evident that without future entries for ingrowth removals risk levels will increase by the end of the simulation period.
Conversely, Figure 4.12 is intended to display the forest
risk through time as it might be with a control burn program
to remove risk from ingrowth. Reductions in risk are maintained
into the future by excluding regeneration from the simulations.
For example, BA 45 initially reduced 62.4% of the high risk
stands to low risk and another 35.9% from high to moderate
risk reflecting a 98.3% risk reduction to high risk stands.
Without ingrowth, only 4 stands treated with BA 45 returned
to high risk by 2030 while, with ingrowth, 52 stands had
returned to high risk during the simulation period. Amongst
the high risk stands both the BA 45 and the Half BA treatments
reduce risk in most stands; 115 or 98.3% of the BA 45 and
104 or 88.9% of the Half BA treated stands moved from high
to either moderate or low risk status. As with the FNF simulation,
the BA 45 treatment resulted in a higher percentage of risk
reductions dropping from high to low risk status than the
other treatments. Unlike the FNF, BA 45 on ONF high risk
forests resulted in greater post-treatment risk reduction
than the Wildfire treatment. The 12 and over treatment results
in little risk reduction (only 2.6% of high risk stands
went to low) and the risk for these stands returned quickly.
By the end of the simulation period 91.5% of stands treated
with 12 and over remained as high risk. Forests that were
not treated, the No-action simulation, remained as high
risk. See Appendix C for the full set of fire risk response
results.
All three thinning from below treatments result in substantive risk reduction as does the Wildfire simulation. The 12 and over treatment results in little risk reduction. No-action simulations result in net risk increases on high and moderate stands in the ONF. The Wildfire simulations result in surviving residual trees and with ingrowth risk levels elevate after 15 years.
There are response differences between Okanogan and Fremont
forests. Okanogan high risk stands that are treated do not
return to high risk as soon after treatment as Fremont stands.
The wildfire simulation on the ONF does not completely burn
up all the high risk stands as does the wildfire simulation
for the FNF. Forest stands on ONF have a cooler and moister
climate. As a result, the fuel moisture content in many
high fire risk ONF stands is likely to be higher and therefore
less susceptible to complete combustion from wildfire than
the stands in the FNF.
![]()
 |
| Figure 4.11. ONF High Fire Risk Response to Six Simulations with Regeneration |
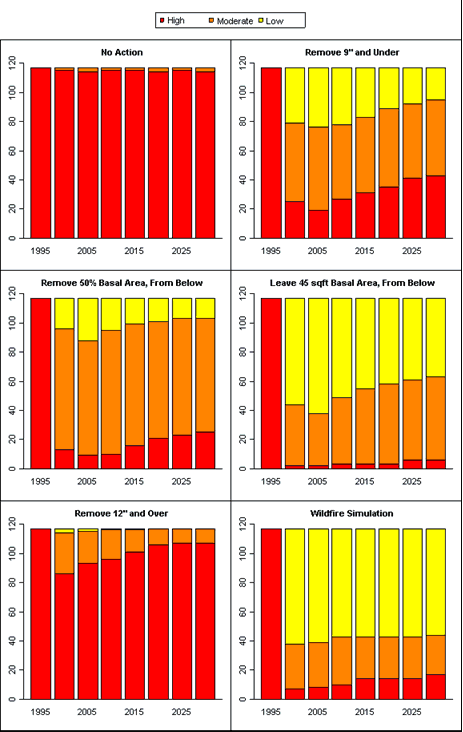 |
| Figure 4.12. ONF High Fire Risk Response with No Regeneration after Treatment |
![]()
4.2 Economic Results
4.2.1 Fremont National Forest
In Table 4.3 (see also Appendix B), the mean, minimum, and maximum net economic results from harvest treatment simulations are displayed in $/acre for low and high cost assumptions for all stands with high and moderate fire risk stands in FNF. Refer to Section 2.6, Analysis of Economics, Tables 2.4 and 2.5 for cost and price assumptions used for this analysis. The economic results of treatment simulations indicate that 9 and under has an average net cost to the USFS with both high and low logging costs assumptions on the FNF. The 12 and over treatment, however, provides significant mean revenue with both high and low logging cost assumptions. The other two thinning treatments, Half BA and BA 45, provide positive mean revenues with low logging costs on the FNF, but have negative revenues with high logging costs applied to treatment simulations.
| Table 4.3 | FNF Mean Net Revenue for Thinning Treatments on High and Moderate risk forests with High and Low Logging Costs |
| Treatment |
High
Cost Mean |
High
Cost Minimum |
High
Cost Maximum |
Low
Cost Mean |
Low
Cost Minimum |
Low
Cost Maximum |
| 9 and under | ($374) |
($1,132) |
$92
|
($134) |
($466) |
$240
|
| Half BA | ($319) |
($1,309) |
$1,270
|
$139
|
($569) |
$2,683
|
| BA 45 | ($168) |
($2,015) |
$3,885
|
$529
|
($770) |
$6,241
|
| 12 and over | $1,244
|
($1,857) |
$8,270
|
$2,198
|
($765) |
$11,414
|
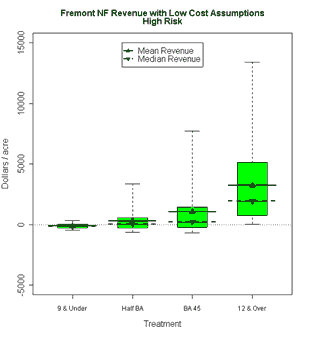 |
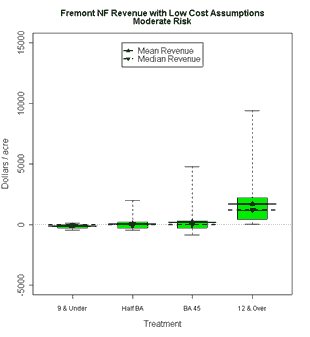 |
| Figures 4.13 and 4.14. FNF Net Revenue High and Moderate Risk Stands with Low Costs |
The economic analysis of net revenue for each thinning treatment simulation of high and moderate risk stands has a range of results that are displayed in Figures 4.13, 4.14, 4.15, and 4.16. See Appendix B for the full set of economic results for FNF. The high risk stands treated with BA 45 assuming high logging costs are very close to neutral mean revenue which indicates that, for many stands, the value of the logs removed will come close to covering the costs of the risk reduction (Figure 4.15). High risk stands treated with BA 45 and with low logging costs result in positive mean revenue with very few stands with negative net returns (Figure 4.13). The Half BA treatment appears to generate a modest positive mean return with low cost assumptions while the high cost assumptions result in negative mean net revenues. The 9 and under treatment results in a negative mean net revenue with both high and low costs for both high and moderate risk categories. These economic analysis results for the FNF show that treating the high risk stands is more likely to result in positive returns than treating the moderate risk stands. Generally treatments to high risk stands yield greater saw log volumes than do treatments to moderate risk stands.
![]()
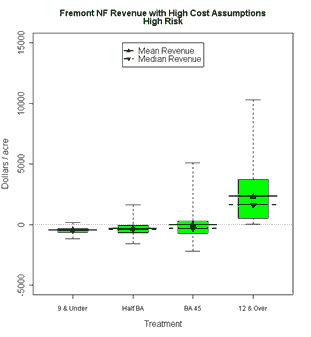 |
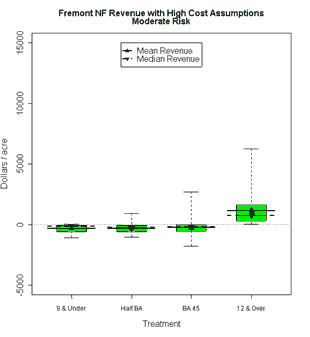 |
| Figures 4.15 and 4.16. FNF Net Revenue High and Moderate Risk Stands with High Cost |
4.2.2 Okanogan National Forest
In Table 4.4, the mean, minimum, and maximum net economic
results from harvest treatment simulations are displayed
in $/acre for low and high cost assumptions for all stands
with high and moderate fire risk stands in ONF. Refer to
Section 2.6, Analysis of Economics, Tables 2.4 and 2.5 for
cost and price assumptions used for this analysis. The economic
results of this analysis show for that high and moderate
risk stands on the ONF, the 9 and under and the Half BA
treatments result in an average net cost to the USFS under
both high and low logging costs scenarios. However, the
mean return from the Half BA treatment is close to breakeven
with low logging costs. The 12 and over thinning is the
only treatment that provides revenue with both high and
low logging costs used in this analysis. But all of the
other three thinning treatments have some stands with positive
net revenue. The BA 45 average net revenue is positive with
low logging costs on the ONF but has an average cost of
$169/acre with high logging cost assumptions (Table 4.4).
| Table 4.4 | ONF Mean Net Revenue for Thinning Treatments on High and Moderate risk forests with High and Low Logging Costs |
| Treatment | High Cost Mean |
High Cost Minimum |
High Cost Maximum |
Low Cost Mean |
Low Cost Minimum |
Low Cost Maximum |
| 9 and under | ($345) |
($892) |
$67 |
($287) |
($625) |
$270 |
| Half BA | ($265) |
($946) |
$953 |
($39) |
($618) |
$2,110 |
| BA 45 | ($169) |
($1,160) |
$2,660 |
$291 |
($598) |
$5,191 |
| 12 and over | $1,025 |
($331) |
$7,358 |
$1,953 |
$4 |
$11,113 |
The economic analysis of treatments to high and moderate fire risk stands on the ONF has produced a range of results displayed in Figures 4.17, 4.18, 4.19, and 4.20. See Appendix C for the full set of economic results. Only the 12 and over treatment has mean positive net revenue with both high and low logging costs for both high and moderate risk classes. BA 45 treatment has a mean positive net revenue with low logging costs for both high and moderate risk classes but not for high cost assumptions. The Half BA has negative returns for all cases, although, assuming low costs, are close to neutral. The 9 and under treatment generates average negative net revenues with high and low costs for both risk classes.
![]()
 |
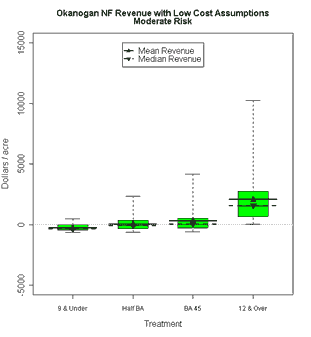 |
| Figures 4.17 and 4.18. ONF Net Revenue for High and Moderate Risk Stands with Low |
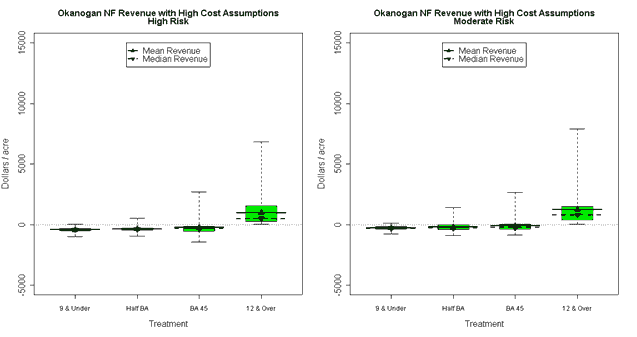 |
| Figures 4.19 and 4.20. ONF Net Revenue High and Moderate Risk Stands with High Cost |
4.3 Cost to Fight Fire on the Fremont and Okanogan National Forests
Every year during the forest fire season, National Forests must expend resources to fight forest fires. The FNF and ONF report that forest fire fighting costs can range from $300 to almost $11,000/acre depending upon fire size and conditions. These figures do not include suppression costs to states, counties, or municipalities nor do they include losses of forest resources and property. The closer to the wildland/urban interface generally the greater the fire fighting cost. Individual large forest fires may cost as much as $1,000,000/day due to large numbers of ground crews and expensive ground and air equipment (local interviews 2002). Fire fighting cost trends appear to be increasing as fires become more explosive and impossible to control (United States National Interagency Fire Center 2002). In addition to fire fighting costs, once the fire is out, regeneration and restoration projects can be problematic and add more costs. Individuals in the local communities and Forest Service agree that the alternative to thinning overstocked forests will be spending billions of dollars for decades to fight wildfire (local interviews 2002).
Average fire suppression costs/acre 1992-2002 for the FNF are presented in Figure 4.21. The need for expensive fire suppression efforts has resulted in increases to FS fire suppression budget. Ironically, however, forest management budgets (funding that is needed to support fire risk reductions through fuels removal treatments) are shrinking (Michaels and Evans 2003). In 2002, 125,000 acres of forest burned on the FNF. Forest silviculturalists and fire scientists report that where prior fuel reduction activities had been undertaken, forest fires dropped to the ground and burned with low intensity (Michaels and Evans 2003).
![]()
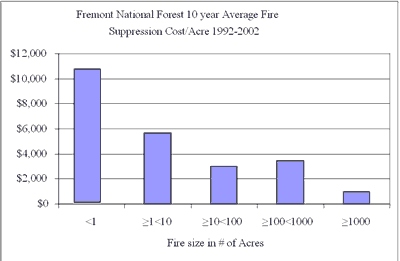 |
| Figure 4.21. Fremont National Forest Fire Suppression Average Costs/Acre by Magnitude for 1992-2002 |
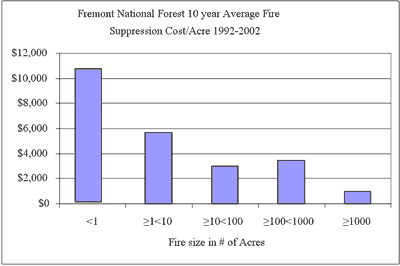 |
| Figure 4.22. Okanogan-Wenatchee National Forest Fire Suppression Average Costs/Acre by Magnitude for 1990-2002 |
Where fuel loads had not been reduced, fires burned forests with increased intensity and consumed the crowns (local interviews 2002). Anecdotal observations agree with wildfire simulations conducted as part of this investigation. Simulations predict that all stands in high and moderate risk classes (78% of the total FNF area studied) would experience near total mortality in the event of a wildfire. The total pre-commercial thinning budget for the Fremont Winema National Forest combined for thinning non-merchantable trees was $1,020,000 in contrast to much higher fire fighting costs (Michaels and Evans 2003).
The ONF has had similar costs associated with fighting fire as those reported by the FNF. Actual costs by fire size are shown in Figure 4.22 (Burdick 2002). Both forests display common trends of higher costs/acre for smaller fires, which are often in the wildland/urban interface. However, an increasing number of large forest fires has resulted in suppression costs in the $ millions/year for both national forests. The total fire suppression costs for the Forest Service for Okanogan-Wenatchee was $11,024,200 in 2001 and $12,552,000 in 2002. These figures do not account for the state, county and private fire suppression costs or loss of valuable resources. They do include the funding of the initial attack resources, heat and light, administration costs, fire management personnel, etc. Costs associated with the risk of forest fires are considered further in the Market and Non-Market Values section of this report.
![]()
4.4 Wildlife Habitat
Wildfires and forest management activities result in changes to wildlife habitat quality. When fuel removal treatment alternatives are compared to the potential impacts of wildfire, it is important, therefore, to consider the implications for wildlife habitats. Wildlife habitat models are analyzed to assess the tradeoffs in habitat units associated with various management alternatives. The intent of this investigation was to employ the use of wildlife models created by federal agencies to examine species of interest on federal lands. Two modeling approaches were identified that fit this intent. For some species, Habitat Suitability Index (HSI) models are available from the U.S. Fish and Wildlife Service (USFWS 2001); for others, habitat models developed by the U.S. Forest Service (Wisdom et al. 2000b) for the Interior Columbia Basin Ecosystem Management Project (ICBEMP) are used. Wildlife species analyzed differed between the two National Forests due to geographic ranges, model availability, and species of concern. Lists of species identified as important for consideration in this project were obtained from Kent Woodruff, Okanogan National Forest biologist, and Brent Frazier, Fremont National Forest biologist. Criteria for habitat designation are listed by species in Appendix D.
While habitat modeling provides insight into the potential responses of wildlife populations to management activities, there are some drawbacks and potential pitfalls with these types of exercises. One concern is that, due to the assumptions and cliff-like thresholds employed to support modeling mechanics, the accuracy level of habitat models is at best a coarse resolution estimate. Most HSI-type wildlife habitat models available have not been validated by an independent study in the area of interest. Successful use of habitat models for planning the management of forestlands, therefore, is reliant on the knowledge and professional judgement of experts with local understanding of each species habitat needs. The value of insights gained from habitat modeling exercises are more likely, therefore, to be relative and comparative rather than absolute, but are especially useful when planning alternative management options across broad landscapes.
A larger problem that was encountered in this project was
the broad range of inclusion that some of the source habitat
(ICBEMP) model structural stages displayed. For example,
'Stem exclusion' open canopy (SEO) functions as a "catch
all" category for forest structures that don't fit
other classifications. The result is that vastly different
structural conditions are all classified as SEO (Figure
4.23).
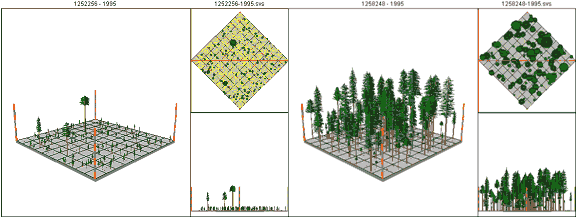 |
| Figure 4.23. Source Habitat (ICBEMP; Wisdom et al. 2000a) Structural Stage Classifications Identify both of these Stands as Being Within the Same Stage - 'Stem exclusion (open canopy)' |
'Stem exclusion' closed canopy (SEC), a common structural condition in second-growth forests, was virtually absent when stand inventories were classified according to the criteria in the source habitat models. Greater than 70% canopy cover is required to meet the definition of SEC. On the Okanogan, only 4 of 413 stands (1%) had at least 70% canopy cover before treatments. On the Fremont, none of the 502 stands met the 70% minimum. However, the ONF had 28.3% and the FNF had 30.7% of forest stand inventories that, after most of a century of fire suppression, have canopies dense enough to be considered overstocked and at high risk of forest fire.
Another important aspect of habitat modeling is the selection of species that are representative of a gradient of ecotypes. One could select a particular suite of species that would all respond favorably (or negatively) to proposed treatments in order to bias conclusions about potential impacts on the "wildlife community". While modeling the entire wildlife community is logistically prohibitive, it is important to have an unbiased reason for selecting species as most appropriate for forestry investigations. For this project, consultation with biologists from the Fremont and Okanogan National Forests drove the selection of species that are to be considered as indicators of diverse forest conditions and are of particular interest for planning management activities within these forest areas.
![]()
4.4.1 Fremont habitat analysis results
An assessment of pre- and post-treatment forest conditions using the wildlife habitat models mentioned above shows that results are varied for the diverse group of birds and mammals considered for the FNF part of this investigation: northern goshawk, Lewis'woodpecker, white-headed woodpecker, Williamson's sapsucker, pileated woodpecker, northern flying squirrel, and Townsend's big-eared bat. As would be expected, some species favor conditions created by one or more of the thinning alternatives, while others apparently benefit from a No-action or Wildfire alternative (see Appendix B).
Distributions of the initial habitat conditions for the
species of interest are irregular. HSI models predict an
abundance of habitat for open canopied species such as Lewis'
woodpecker and white-headed woodpecker with less habitat
available for moderate and closed canopied species such
as the northern goshawk. The small diameter of the majority
of the trees on the FNF results in basal areas/acre that
are low when compared to areas of very high basal area thought
to be preferred by northern goshawks (preferred BA >
220 ft2/acre). In contrast, the Williamson's
sapsucker would appear to have limited habitat probably
because of a lack of large snags (Figures 4.24 and 4.25).
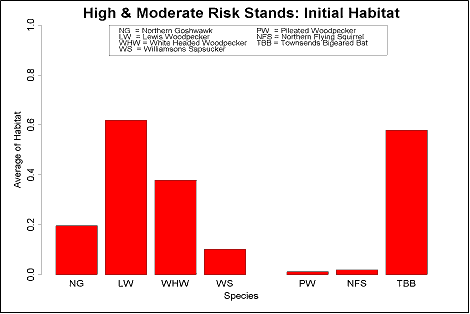 |
| Figure 4.24. Initial Habitat Distributions for Selected Species in Moderate to High Risk Areas in the FNF |
Pileated woodpeckers and flying squirrels are considered to have relatively narrow habitat ranges that are primarily comprised of older forest structures. While the northern flying squirrel may be found in older forests on the FNF dominated by ponderosa pine, lodgepole pine, or grand fir/white fir, in the case of the pileated woodpecker, habitat is limited on the FNF to grand fir/white fir dominated old forests. If a goal of forest management is to return large areas of the FNF to a pre-settlement condition dominated by large dispersed ponderosa pine, then habitat areas for the pileated woodpecker, as recognized by the ICBEMP model employed by this investigation, are likely to be few.
![]()
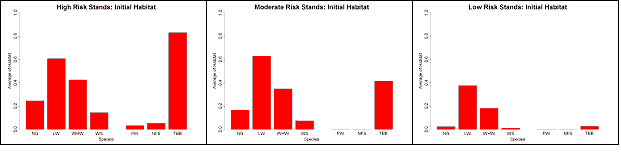 |
| Figure 4.25 a,b,c. Initial Habitat Distributions for Selected Species Displayed by Risk Class in the FNF |
Source habitat models predict an absence of pileated woodpecker and northern flying squirrel habitat in low and moderate risk stands, and very little (<5% of total possible habitat units) in high risk (Figure 4.25 a,b,c). Townsend's big-eared bat habitat, however, is relatively common in both high and moderate risk stands as they utilize all stands beyond the 'Stem exclusion' stage as source habitat.
The following text provides a summary of the modeled species habitat consequences of all growth and treatment simulations. A full set of output graphs for all species by risk class and treatment over time for the FNF can be referenced in Appendix B and will be useful for review of the following results.
-
Habitat increases over time for goshawks as No-action results in increases to basal area and QMD, both of which are important habitat considerations for goshawks.
-
Habitat decreases for Lewis' woodpeckers as canopy closure increases.
-
Habitat remains approximately stationary for white-headed woodpeckers and Williamson's sapsuckers in both high and moderate risk stands.
-
Habitat for pileated woodpecker and northern flying squirrel increases slightly in high risk stands under No-action. In moderate risk stands, habitat for pileated woodpecker and northern flying squirrel is absent and does not appear over the 35 year period with No-action.
-
Townsend's big-eared bat habitat decreases slightly in high risk forests as an increasing number of stands move into the stem exclusion stage. Habitat for Townsend's big-eared bat in moderate risk stands increases slightly with No-action as more stands move into the young forest stage.
-
In general, No-action results in more habitat for closed-canopied, mature forest species (e.g. northern goshawk), while decreasing habitat for more open-canopied specialists (e.g. Lewis' woodpecker).
-
The No-action treatment assumes no fires during the investigation period, however, No-action would likely result in catastrophic wildfire in many high and moderate risk stands.
-
Habitat for species that prefer older forests such as the northern goshawk and Williamson's sapsucker disappears following the Wildfire simulation.
-
Habitat for Lewis' woodpecker increases dramatically as a result of wildfire due to a post disturbance abundance of fire-created snags and substantial decreases in canopy cover.
-
Habitat suitability for white-headed woodpecker increases slightly in moderate risk stands and decreases slightly in high risk stands following Wildfire. While Wildfire increases the number of snags available (which are desirable for white-headed woodpeckers), it also reduces the number of large ponderosa pines, a key habitat component of white-headed woodpeckers. The modeling result is that one factor equalizes the other for the high and moderate risks combined.
-
Wildfire eliminates habitat for pileated woodpecker, northern flying squirrel, and Townsend's big-eared bat.
-
Habitat suitability for northern goshawks varied considerably among thinning treatments, particularly in high risk stands. The 9 and under treatment increases habitat suitability beyond that of No-action, while Half BA results in habitat increases similar to No-action. Conversely, both the BA 45 and 12 and over treatments reduce habitat below that of No-action and, while both increase after initial declines following treatment, neither regains the habitat suitability comparable to No-action. For the FNF, the HSI model for northern goshawks requires a minimum basal area of 60 ft2/acre with a preferred habitat basal area of greater than 220 ft2/acre.
-
Habitat for Lewis' woodpecker increased substantially under all three thin-from-below treatments due to decreases in canopy cover. The 12 and over treatment improved Lewis' woodpecker habitat to a lesser extent initially but habitat suitability declined rapidly following this treatment due to the re-closure of the overstory canopy.
-
Habitat for white-headed woodpecker did not differ from No-action over time for the three thin-from-below treatments, however, the 12 and over treatment reduced habitat suitability because of the removal of large ponderosa pines.
-
Habitat for Williamson's sapsucker was reduced by the thin-from-below treatments due to reductions in canopy cover. The 12 and over treatment, however, did not substantially reduce habitat suitability below that of No-action.
-
Habitat suitability for pileated woodpecker is very low in both high and moderate risk stands and is not increased very substantially with any of the treatments.
-
In high risk stands, northern flying squirrel habitat increases to its highest level using the 12 and over treatment due to the creation of some 'Understory Reinitiation' stage classifications for some stands. Initially, 12 and over reduces habitat below that of No-action, but over time it reaches nearly twice the level of No-action. All three thin-from-below treatments result in fewer habitats for northern flying squirrel than No-action. Habitat for northern flying squirrel is low in moderate risk stands and is not increased substantially with any treatments.
-
Habitat for Townsend's big-eared bat after the 12 and over treatment remains very similar to No-action, while habitat declines to near zero for all the thin-from-below treatments in both high and moderate risk stands. This modeling determination is because these treatments result in most of the forest being classified together as the 'Stem exclusion' open canopy (SEO) condition.
-
Including regeneration does not change the results for any wildlife species habitat evaluations under the Wildfire scenario.
-
With regeneration, goshawk habitat is lower compared to the Below 9 treatment without regeneration because the quadratic mean diameter (QMD) is reduced by the addition of many small trees. The modeled assessment of goshawk habitat quality is dependent upon QMD with the preferred QMD greater than 16 inches. Goshawk habitat in high risk stands is lower in the Half BA treatment when regeneration is included compared to simulations without regeneration. In moderate risk stands, however, goshawk habitat, after the Half BA treatment, improves with the inclusion of regeneration. This is due to the fact that the regeneration adds needed basal area to the stands in order to meet the minimum goshawk habitat basal area requirement of 60 ft2/acre for the Fremont. The BA 45 treatment with regeneration results in increases of goshawk habitat in both high and moderate risk stands after the first decade for this same reason. The 12 and over treatment does not differ substantially with the addition of regeneration with respect to goshawk habitat suitability.
-
In both high and moderate risk stands, habitat for Lewis' woodpecker declines slightly in the last decade of simulations due to an increased canopy cover caused by maturing regeneration.
-
Habitat for white-headed woodpecker remains constant with or without regeneration
-
The quantity of Williamson's sapsucker habitat resulting from treatments with regeneration differs from treatments without regeneration during the last three growth periods where habitat suitability increases slightly due to increases in canopy cover. Williamson's sapsucker habitat, however, remains below No-action for all the treatments even with regeneration.
-
Habitat suitability for pileated woodpecker and northern flying squirrel did not change when regeneration was included. Habitat for Townsend's big-eared bat, however, differed dramatically when regeneration was included. In both high and moderate risk stands, the 12 and over treatment created an abundance of 'Young forest, Multi-story' stands when regeneration was included. 'Young forest, Multi-story' is source habitat for Townsend's big-eared bat. Habitat suitability using 12 and over is greater than No-action for both high and moderate risk stands when regeneration is included.
-
The three thin-from-below treatments all improved Townsend's big-eared bat habitat substantially when regeneration was included; however only in moderate risk stands did habitat increases for thin-from-below treatments surpass No-action.
![]()
4.4.1.6 Species summaries for FNF
Information from the literature and the results of this investigation would indicate that northern goshawk habitat occurs in high and moderate risk stands and attempts to reduce fire risk with heavy thinning may decrease the quality of habitat for this species. Light to moderate thinning from below (e.g. 9 and under) may improve goshawk habitat in some stands, however. Goshawks require a relatively mature stand with high canopy cover and adequate flight space beneath the canopy. Goshawks also are thought to require large-diameter snags and logs that if retained in young managed forests could make these areas suitable as habitat. However, those management actions that maximize basal area while minimizing densities of small trees in the understory and midstory layers and retain large-diameter logs and snags appear to be best suited for goshawk habitat enhancement through management (Wisdom 2000a 2000b).
The best Lewis' woodpecker habitat occurs in open stands (< 30% canopy cover) with at least 1 snag per acre. High and moderate risk stands tend to have adequate amounts of snags but likely have too high a percentage of canopy closure. Low risk stands generally have open canopy conditions but may not contain enough snags. Management actions that thin heavily from below while leaving the largest trees and at least one snag per acre would best benefit Lewis' woodpeckers (Wisdom 2000a 2000b).
White-headed woodpeckers are thought to prefer relatively open stands, however, they are regularly found in stands with up to 60% canopy cover. An important component of white-headed woodpecker habitat is the presence of large ponderosa pine trees that provide opportunities to forage on seeds and bark-inhabiting invertebrates. Management for white-headed woodpecker habitat could include retention of medium and large ponderosa pines and retention of at least one large (>18 in.) diameter snag per acre. Snags may be short and still be suitable for white-headed woodpeckers which will nest in snag cavities relatively close to the ground (Wisdom 2000a 2000b).
Williamson's sapsuckers select habitat with moderate canopy cover (30-60%) and presence of soft snags. Canopy cover on the Fremont, however, is relatively low with a mean of 28%, therefore, retention of existing canopy in many stands is an important management objective for this species. The need for soft snags makes the challenge of managing for habitat particularly difficult for this species. Snags may take decades to soften up enough to be suitable for use by this species for nesting. Wildfire is particularly damaging to this species because, in addition to the destruction of needed canopy cover, heat from wildfires results in hard snags that generally fall over before becoming soft enough for use by Williamson's sapsuckers (Wisdom 2000a 2000b).
Source habitat for pileated woodpeckers occurs only
in 'Old forest, multi-story' and 'Old forest, single-story',
which are stands with ![]() 30% canopy cover of large trees (>53.2 cm dbh). These
structural stages are very uncommon in the Fremont and options
to develop them within a 35-year period are limited. Management
actions such as retention of large trees and snags would
benefit pileated woodpecker in the absence of 'Old forest'
stands (Wisdom 2000a 2000b).
30% canopy cover of large trees (>53.2 cm dbh). These
structural stages are very uncommon in the Fremont and options
to develop them within a 35-year period are limited. Management
actions such as retention of large trees and snags would
benefit pileated woodpecker in the absence of 'Old forest'
stands (Wisdom 2000a 2000b).
Source habitat for northern flying squirrel occurs in both 'Old forest' stages as well as 'Understory reinitiation'. While 'Old forest' conditions are difficult to develop within the short-term, results of this investigation would appear to indicate that over time management might produce 'Understory reinitiation' stands using the 12 and over treatment. However, using 12 and over treatments to produce northern flying squirrel habitat runs counter to the known ecology of northern flying squirrels (i.e. selection for stands with large trees and snags). 'Young forest, multi-story' can be northern flying squirrel source habitat if a sufficient number of large snags and trees (>53.2 cm dbh) are retained (Wisdom 2000a 2000b). 'Young forest, multi-story' is a very common stage on the Fremont, particularly if regeneration is part of a silvicultural treatment. A failure to consider 'Young forest, multi-story' as well as some of the areas classified by the source habitat model as 'Stem exclusion, open' as suitable flying squirrel habitat may result in an underestimation by source habitat models of northern flying squirrel habitat.
Source habitat for Townsend's big-eared bat occurs in all stages except for 'Stand initiation', and 'Stem exclusion' (open and closed canopy). Regeneration in thinned stands may be particularly important to this species, as growth of the young trees results in a beneficial habitat classification change from 'Stem exclusion open canopy' to 'Young forest, multi-story' (Wisdom 2000a 2000b).
![]()
4.4.2 Okanogan habitat analysis results
An assessment of pre- and post-treatment forest conditions using the wildlife habitat models mentioned above shows that results are varied for the diverse group of birds and mammals considered for the ONF part of this investigation: northern goshawk, Lewis'woodpecker, white-headed woodpecker, Williamson's sapsucker, pileated woodpecker, northern flying squirrel, Townsend's big-eared bat, Canada lynx, and grizzly bear. As would be expected, some species favor conditions created by one or more of the thinning alternatives, while others apparently benefit from a No-action or Wildfire alternative (see Appendix C).
Distributions of the initial habitat conditions for the
species of interest are irregular. HSI models predict an
abundance of habitat for open canopied species such as Lewis'
woodpecker and white-headed woodpecker with less habitat
available for moderate and closed canopied species such
as the northern goshawk. The small diameter of the majority
of the trees on the ONF results in basal areas/acre that,
while larger than the FNF, are relatively low when compared
to areas of very high basal area thought to be preferred
by northern goshawks (preferred BA > 240 ft2/acre).
In contrast to the FNF, the Williamson's sapsucker would
appear to have broader habitat opportunities than the white-headed
woodpecker. This may be because the white-headed woodpecker
prefers pine forests and the majority of the Okanogan forests
are dominated by Douglas-fir (Figures 4.26 and 4.27a,b,c.
See also Appendix C).
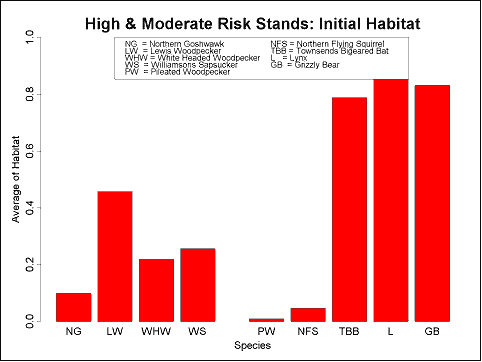 |
| Figure 4.26. Initial Habitat Distributions for Selected Species in Moderate to High Risk Areas in the ONF |
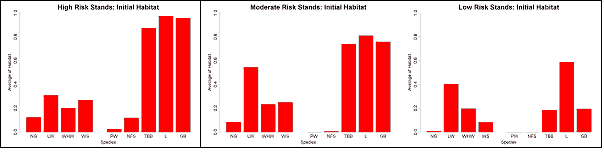 |
| Figure 4.27 a,b,c. Initial Habitat Distributions for Selected Species Displayed by Risk Class in the ONF |
![]()
Pileated woodpeckers and flying squirrels are considered to have relatively narrow habitat ranges that are primarily comprised of older forest structures. While the northern flying squirrel may be found in all the forest structural stages on the ONF that have grown beyond 'Stem exclusion' and are dominated by Douglas-fir or lodgepole pine, in the case of the pileated woodpecker, habitat is limited on the ONF to only the oldest Douglas-fir dominated old forests. Earlier successional stages or lodgepole pine forests, that may be suitable for flying squirrels, are thought to be unacceptable to the pileated woodpecker. If a goal of forest management is to return large areas of the ONF to a pre-settlement condition dominated by large dispersed ponderosa pine, then habitat areas for the pileated woodpecker, as recognized by the ICBEMP model employed by this investigation, are likely to be few. Source habitat models predict an absence of pileated woodpecker and northern flying squirrel habitat in low and moderate risk stands, and very little habitat for pileated woodpeckers in high risk although flying squirrel habitat appears in greater abundance in the ONF than the FNF (Figures 4.24, 4.25, 4.26, 4.27). Canada lynx, grizzly bear, and Townsend's big-eared bat habitats, however, are relatively common in all risk classes of forest as they utilize many of the structural stages of Douglas-fir and lodgepole dominated forests as source habitat.
The following text provides a summary of the modeled species habitat consequences of all growth and treatment simulations. A full set of output graphs for all species by risk class and treatment over time for the ONF can be referenced in Appendix B and will be useful for review of the following results.
-
Habitat increases over time for goshawks as No-action results in increases to basal area and QMD, both of which are important habitat considerations for goshawks.
-
Habitat decreases for Lewis' woodpeckers as canopy closure increases.
-
Habitat remains approximately stationary for white-headed woodpeckers and Williamson's sapsuckers in both high and moderate risk stands.
-
Pileated Woodpecker habitat appears to be very rare (<5% of total possible habitat units) in both high and moderate risk stands and is never consequentially developed under any of the treatment scenarios; either with or without regeneration.
-
Habitat for northern flying squirrel increases most dramatically over time under the No-action simulation in the high risk stands with increases that are less dramatic in moderate risk stands.
-
Townsend's big-eared bat, Canada lynx, and grizzly bear habitats remain stable and abundant with No-action as more stands move into older forest structures.
-
In general, No-action results in more habitat for closed-canopied, mature forest species (e.g. northern goshawk), while decreasing habitat for more open-canopied specialists (e.g. Lewis' woodpecker).
-
The No-action treatment assumes no fires during the investigation period, however, No-action would likely result in catastrophic wildfire in many high and moderate risk stands. However, wildfire simulations for the ONF do not result in the near total stem mortality as experienced with the FNF. In some stands wildfire performs in similar fashion to a heavy thin-from-below management treatment. Small trees are removed/killed and large overstory trees are left as living residuals. Wildfires also create snags that can be important to wildlife such as woodpeckers.
-
For northern goshawks, Wildfire reduces habitat below that of No-action in both high and moderate risk stands. Since the fire tends to kill the smaller trees the wildfire results produce goshawk habitat levels that are similar to the Half BA treatment simulation or about half of the level of No-action over time.
-
Wildfire substantially increases habitat over No-action for Lewis' woodpeckers and white-headed woodpeckers by reducing canopy closure and creating new snags. In contrast to the Fremont, Wildfire on the Okanogan did not destroy many of large ponderosa pines. This is a habitat element considered very important for white-headed woodpeckers.
-
Habitat for Williamson's sapsucker disappears following Wildfire. Wildfire removes too much canopy cover for Williamson's sapsuckers. The optimal range is 30-60% (Okanogan mean pretreatment = 36%). Additionally, Williamson's sapsucker requires soft snags, which are not created by wildfire. Wildfire removes the pre-existing soft snags and those new snags created by wildfire are not considered to be suitable for use by Williamson's sapsuckers.
-
Wildfire reduces habitat for northern flying squirrel, Townsend's big-eared bat, lynx, and grizzly bear in much the same way that the under-thinning treatments result in habitat reductions. Lynx habitat does not decline substantially (it goes from 95% to 80% of total possible habitat units), while habitat for northern flying squirrel, Townsend's big-eared bat, and grizzly bear all decline to small fractions of levels present with No-action.
-
Habitat suitability for goshawks varied considerably among thinning treatments, particularly in the high risk stands. The 9 and under treatment results in habitat suitability comparable to that of No-action, while Half BA and 12 and over result in reductions to habitat similar to those of Wildfire (about half the level of No-action over time). Conversely, BA 45 eliminates habitat due to the large basal area requirement for Okanogan forests to be considered goshawk habitat. Whereas 60 ft2/acre is the minimum basal requirement for the FNF to be goshawk habitat, 80 ft2/ac is required for the ONF and, to be considered preferred habitat, the forest must have a basal area of greater than 240 ft2/acre.
-
Habitat for Lewis' woodpecker increased substantially under all three thin-from-below treatments due to decreases in canopy cover. The 12 and over treatment improved Lewis' woodpecker habitat to a lesser extent initially but habitat suitability declined rapidly following this treatment due to a loss of canopy openings as the forest grew.
-
Habitat for white-headed woodpecker did not differ substantially from No-action over time as an effect of the thin-from-below treatments, while the 12 and over treatment reduced habitat suitability due to loss of large overstory ponderosa pines.
-
Habitat for Williamson's Sapsucker was reduced by the thin-from-below treatments due to reductions in the degree of canopy closure. The 12 and over treatment, however, did not substantially reduce habitat suitability below that of No-action.
-
Habitat suitability for pileated woodpecker is very low in both high and moderate risk stands and is not increased substantially with any of the treatments.
-
In both high and moderate risk stands, northern flying squirrel habitat remains below, but close to, No-action using the 12 and over treatment that results in the development of some 'Understory reinitiation' stand classifications. Initially, 12 and over reduces habitat below that of No-action, but over time it reaches close to the level of No-action. All three thin-from-below treatments nearly eliminate northern flying squirrel habitat.
-
Habitat for Townsend's big-eared bat and grizzly bear using the 12 and over treatment remains very similar to No-action, while habitat declines to near zero under all thin-from-below treatments in both high and moderate risk stands. Lynx habitat declines by approximately 20% from No-action when the thin-from-below treatments are used (comparable with 'wildfire'). The 12 and over treatment maintains habitat at similar levels as does the No-action.
-
Including regeneration does not change the results substantially for any of the HSI species (goshawk, Lewis' woodpecker, white-headed woodpecker, Williamson's sapsucker) or for the northern flying squirrel under the 'wildfire' scenario. Over time, however, regeneration has the effect of moving stands from 'Stem exclusion, open canopy' (a stage commonly created by 'wildfire' on the Okanogan) to 'Young forest, multi-story'. The result is that habitat increases for lynx, grizzly bear, and Townsend's big-eared bat when regeneration is included in the wildfire simulation.
-
With regeneration, goshawk habitat does not fare as well under most of the thinning treatments because QMD is reduced by the introduction of many small trees. Under the BA 45 scenario, however, goshawk habitat is increased slightly compared with no regeneration as a result of the addition of needed basal area provided by the young trees.
-
In both high and moderate risk stands, habitat for Lewis' woodpecker does not differ substantially when regeneration is included.
-
Habitat for both white-headed woodpeckers and Williamson's sapsuckers does not differ substantially when regeneration is included.
-
Habitat suitability for northern flying squirrel did not change substantially when regeneration was included.
-
Habitat for Townsend's big-eared bat, lynx, and grizzly bear, however, differed dramatically when regeneration was included. 'Young forest, multi-story' is source habitat for these species and including regeneration moves stands from 'Stem exclusion, open canopy' (a stage classification that commonly results from thinning treatments on the Okanogan) to 'Young forest, multi-story'.
-
Information from the literature and the results of this investigation would indicate that northern goshawk habitat occurs in high and moderate risk stands and attempts to reduce fire risk with heavy thinning may decrease the quality of habitat for this species. Light to moderate thinning from below (e.g. 9 and under) may improve goshawk habitat in some stands, however. Goshawks require a relatively mature stand with high canopy cover and adequate flight space beneath the canopy. Goshawks also are thought to require large-diameter snags and logs that if retained in young managed forests could make these areas suitable as habitat. However, those management actions that maximize basal area while minimizing densities of small trees in the understory and midstory layers and retain large-diameter logs and snags appear to be best suited for goshawk habitat enhancement through management (Wisdom et al. 2000a 2000b).
The best Lewis' woodpecker habitat occurs in open stands (< 30% canopy cover) with at least 1 snag per acre. High and moderate risk stands tend to have adequate amounts of snags but likely have too high a percentage of canopy closure. Low risk stands generally have open canopy conditions but may not contain enough snags. Management actions that thin heavily from below while leaving the largest trees and at least one snag per acre would best benefit Lewis' woodpeckers (Wisdom 2000a 2000b).
White-headed woodpeckers are thought to prefer relatively open stands, however, they are regularly found in stands with up to 60% canopy cover. An important component of white-headed woodpecker habitat is the presence of large ponderosa pine trees that provide opportunities to forage on seeds and bark-inhabiting invertebrates. Management for white-headed woodpecker habitat could include retention of medium and large ponderosa pines and retention of at least one large (>18 in.) diameter snag per acre. Snags may be short and still be suitable for white-headed woodpeckers which will nest in snag cavities relatively close to the ground (Wisdom 2000a 2000b).
Williamson's sapsuckers select habitat with moderate canopy cover (30-60%) and presence of soft snags. Canopy cover on the Okanogan, however, is relatively low with a mean of 36%, therefore, retention of existing canopy in many stands is an important management objective for this species. The need for soft snags makes the challenge of managing for habitat particularly difficult for this species. Snags may take decades to soften up enough to be suitable for use by this species for nesting. Wildfire is particularly damaging to this species because, in addition to the destruction of needed canopy cover, heat from wildfires results in hard snags that generally fall over before becoming soft enough for use by Williamson's sapsuckers (Wisdom 2000a 2000b).
Source habitat for pileated woodpeckers occurs only
in 'Old forest, multi-story' and 'Old forest, single-story',
which are stands with ![]() 30%
canopy cover of large trees (>53.2 cm dbh). These structural
stages are very uncommon in the Okanogan and options to
develop them within a 35-year period are limited. Management
actions such as retention of large trees and snags would
benefit pileated woodpecker in the absence of 'Old forest'
stands (Wisdom 2000a 2000b).
30%
canopy cover of large trees (>53.2 cm dbh). These structural
stages are very uncommon in the Okanogan and options to
develop them within a 35-year period are limited. Management
actions such as retention of large trees and snags would
benefit pileated woodpecker in the absence of 'Old forest'
stands (Wisdom 2000a 2000b).
Source habitat for northern flying squirrel occurs in both 'Old forest' stages as well as 'Understory reinitiation'. While 'Old forest' conditions are difficult to develop within the short-term, results of this investigation would appear to indicate that over time management might produce 'Understory reinitiation' stands using the 12 and over treatment. However, using 12 and over treatments to produce northern flying squirrel habitat runs counter to the known ecology of northern flying squirrels (i.e. selection for stands with large trees and snags). 'Young forest, multi-story' can be northern flying squirrel source habitat if a sufficient number of large snags and trees (>53.2 cm dbh) are retained (Wisdom 2000a 2000b). 'Young forest, multi-story' is a very common stage on the Okanogan, particularly if regeneration is part of a silvicultural treatment. A failure to consider 'Young forest, multi-story' as well as some of the areas classified by the source habitat model as 'Stem exclusion, open' as suitable flying squirrel habitat may result in an underestimation by source habitat models of northern flying squirrel habitat.
Source habitat for Townsend's big-eared bat occurs in all stages except for 'Stand initiation', and 'Stem exclusion' (open and closed canopy). Regeneration in thinned stands may be particularly important to this species, as growth of the young trees results in a beneficial habitat classification change from 'Stem exclusion open canopy' to 'Young forest, multi-story' (Wisdom 2000a 2000b).
Source habitat for Canada lynx occurs in all stages except for 'Old forest, single story' in Douglas-fir, Engelmann spruce-subalpine fir (Picea engelmannii, Abeis lasiocarpa), and western white pine (Pinus monticola) cover types; and in all stages except 'Old forest, single story' and 'Stem exclusion' (open and closed canopy) in grand fir-white fir (Abeis grandis, Abeis concolor), western larch, lodgepole pine, and western redcedar-western hemlock (Thuja plicata, Tsuga heterophylla) cover types. Therefore, habitat management for this species would include a mix of early and late successional stages interspersed throughout the landscape to provide denning (mid to late successional) and hunting (early successional) habitat in accessible proximity to one another. Retention of down wood may be important for dens (Wisdom 2000a 2000b).
Source habitat for grizzly bear occurs in all stages except 'Stem exclusion' (open and closed canopy). Therefore, habitat management should include strategies similar to lynx that includes a mixture of early and late successional stages interspersed throughout the landscape. Special attention should be paid to minimizing the amount of time stands spend in the stem exclusion stage (Wisdom 2000a 2000b).
![]()
4.5 Carbon sequestration, displacement, and substitution
Increasing concerns about global warming as a result of air pollution warrant an examination of the consequences for addition or subtraction of atmospheric carbon that are associated with the treatments, No-action, and wildfire simulations that have been conducted in this investigation. On both the FNF and ONF, the highest risk forests contain the most carbon in forest biomass. Please reference Appendices B and C for a full set of carbon output graphs for each forest.
The No-action alternative for all risk classes for both forests results in the greatest comparative sequestration and storage of carbon in the forest and products combined, however, this alternative assumes the unlikely eventuality that in the simulation period there will be no forest fire. The No-action simulation falls behind proactive management alternatives in the cumulative carbon assessment when substitution is considered. The No-action alternative fails to generate any products and therefore results in increased use of non-renewable building alternatives that are energy intensive in manufacture. Manufacture of materials such as steel that are used in the place of wood for building construction results in disproportionately high levels of carbon emissions (Bowyer et al. 2002).
Wildfire, a likely outcome during the simulation period for many stands without fuel reduction treatments, results in the least carbon stored. Some of the carbon stored in forest biomass is lost during the wildfire event and snags (trees killed by fire but still standing) decay relatively quickly and release sequestered carbon over time indicating a high carbon cost associated with wildfire.
For each forest and risk class, the 12 and over treatment results in the harvest removal of the most carbon (large logs) from the forest and subsequently results in the production of the most wood products. A comparison of the standing forest carbon after each treatment simulation with the No-action standing forest carbon will offer insights on the distribution of forest biomass within the forest inventory. These standing carbon estimates are available for review presented as metric tons/acre for each forest (Tables 4.5-4.10). For example, since the 12 and over treatment is the only harvest of larger trees from above, the relative amount of forest biomass in trees that are 12 inches DBH and larger can be determined by subtracting the 12 and over post-harvest standing carbon from the No-action standing carbon in 2000. The BA 45 apparently removes more biomass than the other two thin-from-below treatments (Half BA and 9 and under) except in the case of the moderate risk forests in the FNF. This information would indicate that average stands from this risk group have greater than 90 ft2/acre of basal area. Since all thin-from-below treatments appear to retain roughly equivalent to or greater than volumes of standing forest carbon than the 12 and over from above, it would appear that very few tree 12 inches DBH or larger were removed by any thin from below treatments. Conversely since the 9 and under treatment results in relatively little apparent biomass removal (albeit removal of many small stems; Tables 4.1 a,b,c, and 4.2 a,b,c), the forest carbon/biomass difference between this treatment and the BA 45 and Half BA treatments is likely found in 10-12 inch DBH trees. These observations serve to support earlier suspicions that substantive improvements in risk reduction and economic performance can be had by including some 10-12 inch DBH trees in fuels reduction treatments.
While standing forest biomass to carbon estimates are based upon a series of conversion relationships unique by species and tree component, the approximate relationship for quick estimates is that the carbon is roughly equivalent to 50% of the biomass. Beyond standing forest carbon, however, estimation of the carbon implications of harvest intensities becomes more complicated. The relationship between standing forest carbon and carbon in products shifts with treatment intensity. Summing the carbon in forest, products, and the credit from displacement, 9 and under generally stores the most carbon among the harvest treatment alternatives. When substitution is considered, however, the order of treatments assessed for effectiveness of carbon storage or offset is completely reversed. These relationships highlight the significance of avoiding the use of alternative building products that are non-renewable, energy intensive to manufacture, and a source of atmospheric pollution. The treatment simulations that produce the most wood products provide the greatest cumulative reduction to atmospheric carbon. From this perspective, 12 and over is the most effective treatment, followed by BA 45, Half BA, and 9 and under. The challenge to integrated forest management is to balance post- treatment goals, therefore, even though the 12 and over treatment simulations may provide the best cumulative carbon performance, the resultant fire risk reduction is inadequate and the likelihood of forest fire within these stands during the simulation period remains high. Whereas thin-from-below treatments may result in respectable carbon storage while more adequately reducing fire risk.
Regeneration adds between 2 and 8 metric tons per acre (MT) by 2030 in the FNF, and between 1 and 5 MT by 2030 in the ONF. Regeneration biomass has minimal influence on the cumulative consequences of carbon storage,
displacement, and substitution during the simulation period. However, regeneration increases future fire risk which may have undesirable carbon consequences.
![]()
4.5.1 Fremont
The range of treatment alternatives developed and analyzed for fuel reduction effectiveness had differing impacts on carbon sequestration and storage. Results are presented for each risk class on the FNF at four progressive stages in the complete carbon analysis. The first two results for each risk class present the amount of carbon stored in the forest and in products minus harvesting and manufacturing emissions. The third result presents the amount of carbon in the forest and long-term products, plus the amount of potential carbon emissions displaced from producing energy by burning the short-term products to generate electricity as a substitute for natural gas. The last result in each set presents the carbon from the third stage plus the amount of potential carbon emissions displaced by substituting the long-term products for steel construction materials. All results are presented as average per acre metric tons (MT) of carbon after each cycle.
High risk stands in the FNF contained a mean of 41 MT of forest carbon per acre at the beginning of the simulation period. This was significantly more then the initial conditions for the Moderate risk stands, which contained 21 MT/acre of carbon. The High and Moderate risk classes combined averaged 24 MT/acre before treatments.
-
The No-action treatment for all risk classes stores more carbon in the forest, products, and displacement than all other treatment alternatives.
-
Because the No-action alternative generates no products and because steel emits large amounts of carbon during the manufacturing process, when substitution is considered, all treatment alternatives result in less carbon released to the atmosphere than the No-action alternative. The No-action treatment assumes that there are no forest fires during the investigation period.
-
Wildfire simulation represents the likely outcome for many moderate and high risk stands during the period of investigation.
-
Wildfire simulation provides useful estimate of the carbon costs of wildfire. The carbon released to the atmosphere from wildfire is high for all risk classes, as the amount of carbon per acre at the end of the simulation period is significantly lower than the No-action or other treatment alternatives.
-
In High risk stands, the 12 and over treatment removes the most carbon from the forest and stores the most in products. BA 45 removes nearly as much carbon from the forest but stores several MT/acre less in products. 9 and under removes the least from the forest and stores the least in products.
-
In Moderate risk stands, the order remains the same as in High risk stands. BA 45 is nearly identical in carbon removed from the forest and carbon stored in products as the Half BA treatment.
-
The amount of carbon in the forest after each treatment decreases until 2010 while decay is greater than growth, then increases through the remaining time period as regeneration becomes established.
-
The growth model predicts a release of understory trees following the 12 and over treatment, causing significantly more biomass growth then the other treatments after 2010.
-
If substitution is not considered, more carbon is stored during the simulation period in the No-action alternative.
-
When substitution is considered, the treatments that generated the most long-term products provided the most substitution, therefore resulted in the least release of atmospheric carbon. In High risk stands there was a significant difference between each treatment: 12 and over resulted in the least carbon release, followed by BA 45, then Half BA, then 9 and under. In Moderate risk stands, the order was the same, but the Half BA treatment had very similar results to the BA 45 treatment.
-
In High risk stands regeneration adds 2 to 8 MT/acre of carbon by 2030 among all treatment and wildfire alternatives
-
In Moderate risk stands regeneration adds 2 to 6 MT/acre of carbon by 2030 among all treatment and wildfire alternatives
-
Products and emissions are not affected by regeneration
-
For the carbon analysis, regeneration has a minor impact on carbon stored in the forest, and an extremely small impact on carbon when substitution is considered.
| Table 4.5. Average Metric Tons per Acre of Carbon in the Forest by Treatment for the FNF |
| High Risk |
Moderate Risk |
High and Mod. Risk |
||||
| Treatment | 2000 |
2030 |
2000 |
2030 |
2000 |
2030 |
| NoAction | 45 |
64 |
23 |
36 |
27 |
41 |
| Wildfire | 43 |
6 |
21 |
3 |
25 |
4 |
| 9&Under | 41 |
50 |
22 |
28 |
25 |
31 |
| HalfBA | 35 |
39 |
18 |
21 |
21 |
24 |
| BA45 | 29 |
24 |
18 |
21 |
19 |
21 |
| 12&Above | 27 |
38 |
15 |
22 |
16 |
24 |
| Table 4.6. Average Metric Tons per Acre of Carbon in Products by Treatment from the FNF |
| High Risk |
Moderate Risk |
High and Mod. Risk |
||||
| Treatment | 2000 |
2030 |
2000 |
2030 |
2000 |
2030 |
| NoAction | 0 |
0 |
0 |
0 |
0 |
0 |
| Wildfire | 0 |
0 |
0 |
0 |
0 |
0 |
| 9&Under | 2 |
1 |
1 |
0 |
1 |
0 |
| HalfBA | 6 |
2 |
4 |
1 |
4 |
1 |
| BA45 | 12 |
3 |
4 |
1 |
6 |
1 |
| 12&Above | 15 |
4 |
8 |
2 |
9 |
2 |
| Table 4.7. Average Metric Tons per Acre of Carbon in the Forest, Products, and Displacement by Treatment in the FNF |
| High Risk |
Moderate
Risk |
High and
Mod. Risk |
||||
| Treatment | 2000 |
2030 |
2000 |
2030 |
2000 |
2030 |
| NoAction | 45 |
64 |
23 |
36 |
27 |
41 |
| Wildfire | 43 |
6 |
21 |
3 |
25 |
4 |
| 9&Under | 42 |
51 |
22 |
29 |
25 |
32 |
| HalfBA | 39 |
42 |
21 |
23 |
24 |
26 |
| BA45 | 36 |
30 |
20 |
23 |
23 |
24 |
| 12&Above | 36 |
45 |
20 |
25 |
22 |
28 |
| Table 4.8 | Average Metric Tons per Acre of Carbon in Forest, Products, Displacement, and Substitution by Treatment in the FNF |
| High Risk |
Moderate Risk |
High and Mod. Risk |
||||
| Treatment | 2000 |
2030 |
2000 |
2030 |
2000 |
2030 |
| NoAction | 45 |
64 |
23 |
36 |
27 |
41 |
| Wildfire | 43 |
6 |
21 |
3 |
25 |
4 |
| 9&Under | 68 |
76 |
40 |
47 |
36 |
42 |
| HalfBA | 112 |
114 |
70 |
72 |
63 |
65 |
| BA45 | 173 |
167 |
89 |
90 |
69 |
72 |
| 12&Above | 214 |
224 |
132 |
139 |
115 |
121 |
![]()
| Table 4.9. Average Increase in Metric Tons per Acre of Carbon with Regeneration |
| High Risk |
Moderate Risk |
High and Mod. Risk |
|
| Treatment | 2030 |
2030 |
2030 |
| NoAction | 0 |
0 |
0 |
| Wildfire | 3 |
3 |
3 |
| 9&Under | 5 |
4 |
5 |
| HalfBA | 6 |
6 |
6 |
| BA45 | 8 |
6 |
7 |
| 12&Above | 2 |
2 |
2 |
4.5.2 Okanogan
The range of treatment alternatives developed and analyzed for fuel reduction effectiveness had differing impacts on carbon sequestration and storage. Results are presented for each risk class on the ONF at four progressive stages in the complete carbon analysis. The first two results for each risk class present the amount of carbon stored in the forest and in products minus harvesting and manufacturing emissions. The third result presents the amount of carbon in the forest and long-term products, plus the amount of potential carbon emissions displaced from producing energy by burning the short-term products to generate electricity as a substitute for natural gas. The last result in each set presents the carbon from the third stage plus the amount of potential carbon emissions displaced by substituting the long-term products for steel construction materials. All results are presented as average per acre metric tons (MT) of carbon after each cycle.
High risk stands in the ONF contained a mean of 38 MT of forest carbon per acre at the beginning of the simulation period. This was significantly more then the initial conditions for the Moderate risk stands, which contained 29 MT of carbon. The High and Moderate risk classes combined averaged 30 MT/acre before treatments.
- The No-action treatment for all risk classes stores more
carbon in the forest, products, and displacement than all
other treatment alternatives.
- Because the No-action alternative generates no products and because steel emits large amounts of carbon during the manufacturing process, when substitution is considered, all treatment alternatives result in less carbon released to the atmosphere than the No-action alternative. The No-action treatment assumes that there are no forest fires during the investigation period.
- Wildfire simulation represents the likely outcome for many
moderate and high risk stands during the period of investigation.
- Wildfire simulation provides useful estimate of the carbon costs of wildfire. The carbon released to the atmosphere from wildfire is high for all risk classes, as the amount of carbon per acre at the end of the simulation period is significantly lower than the No-action or other treatment alternatives.
![]()
- In High risk stands, the BA 45 treatment removes 1MT/acre
more forest biomass than the 12 and over treatment but 12
and over results in more carbon in products indicating that
several MT/acre removed by BA 45 must have been non-merchantable
logs. The 9 and under treatment removes the least from the
forest and stores the least in products.
- In Moderate risk stands, the 12 and over removed more carbon
from the forest and stored more in products.
- The amount of carbon in the forest after each treatment
decreases until 2010 while decay is greater than growth, then
increases through the remaining time period as regeneration
becomes established.
- The growth model predicts a release of understory trees
following the 12 and over treatment, causing significantly
more biomass growth then the other treatments after 2010.
- If substitution is not considered, more carbon is stored
during the simulation period in the No-action alternative.
- When substitution is considered, the treatments that generated the most long-term products provided the most substitution, therefore resulted in the least release of atmospheric carbon. In High risk stands there was a significant difference between each treatment: 12 and over resulted in the least carbon release, followed by BA45, which was significantly different than Half BA, and 9 and under. In Moderate risk stands, the performance order was the same.
- In High risk stands regeneration adds 1 to 4 MT/acre of
carbon by 2030 among all treatment and wildfire alternatives
- In Moderate risk stands regeneration adds 1 to 5 MT/acre
of carbon by 2030 among all treatment and wildfire alternatives
- Products and emissions are not affected by regeneration
- For the carbon analysis, regeneration has a minor impact
on carbon stored in the forest, and an extremely small impact
on carbon when substitution is considered.
| Table 4.10. Average Metric Tons per Acre of Carbon in the Forest by Treatment for the ONF |
| High Risk |
Moderate Risk |
High and Mod. Risk |
||||
| Treatment | 2000 |
2030 |
2000 |
2030 |
2000 |
2030 |
| NoAction | 42 |
62 |
31 |
48 |
33 |
50 |
| Wildfire | 35 |
21 |
27 |
12 |
28 |
13 |
| 9&Under | 34 |
40 |
27 |
33 |
29 |
36 |
| HalfBA | 32 |
37 |
24 |
27 |
25 |
27 |
| BA45 | 26 |
26 |
22 |
24 |
23 |
25 |
| 12&Above | 27 |
41 |
18 |
28 |
19 |
28 |
![]()
| Table 4.11. Average Metric Tons per Acre of Carbon in Products by Treatment from the ONF |
| High Risk |
Moderate Risk |
High and Mod. Risk |
||||
| Treatment | 2000 |
2030 |
2000 |
2030 |
2000 |
2030 |
| NoAction | 0 |
0 |
0 |
0 |
0 |
0 |
| Wildfire | 0 |
0 |
0 |
0 |
0 |
0 |
| 9&Under | 4 |
1 |
2 |
1 |
2 |
1 |
| HalfBA | 5 |
1 |
5 |
1 |
5 |
1 |
| BA45 | 9 |
2 |
6 |
2 |
7 |
2 |
| 12&Above | 10 |
3 |
9 |
2 |
10 |
3 |
| Table 4.12 | Average Metric Tons per Acre of Carbon in the Forest, Products, and Displacement by Treatment in the ONF |
| High Risk |
Moderate Risk |
High and Mod. Risk |
||||
| Treatment | 2000 |
2030 |
2000 |
2030 |
2000 |
2030 |
| NoAction | 42 |
62 |
31 |
48 |
33 |
50 |
| Wildfire | 35 |
21 |
27 |
12 |
28 |
13 |
| 9&Under | 37 |
41 |
29 |
34 |
30 |
37 |
| HalfBA | 35 |
39 |
26 |
29 |
28 |
30 |
| BA45 | 32 |
30 |
25 |
27 |
27 |
28 |
| 12&Above | 33 |
46 |
24 |
32 |
25 |
33 |
| Table 4.13 | Average Metric Tons per Acre of Carbon in Forest, Products, Displacement, and Substitution by Treatment in the ONF |
| High Risk |
Moderate Risk |
High and Mod. Risk |
||||
| Treatment | 2000 |
2030 |
2000 |
2030 |
2000 |
2030 |
| NoAction | 42 |
62 |
31 |
48 |
33 |
50 |
| Wildfire | 35 |
21 |
27 |
12 |
28 |
13 |
| 9&Under | 78 |
83 |
53 |
58 |
54 |
61 |
| HalfBA | 95 |
100 |
80 |
83 |
88 |
90 |
| BA45 | 141 |
139 |
97 |
99 |
105 |
106 |
| 12&Above | 154 |
167 |
135 |
142 |
150 |
157 |
| Table 4.14 | Average Increase in Metric Tons per Acre of Carbon by 2030 by Treatment with Regeneration |
| High Risk |
Moderate Risk |
High and Mod. Risk |
|
| Treatment | 2030 |
2030 |
2030 |
| NoAction | 0 |
0 |
0 |
| Wildfire | 2 |
5 |
3 |
| 9&Under | 4 |
4 |
4 |
| HalfBA | 3 |
3 |
3 |
| BA45 | 3 |
4 |
3 |
| 12&Above | 1 |
1 |
1 |
![]()
4.6 Market and Non-Market Values of Fire Risk Reduction
As a consequence of the large intense fires in the inland west over recent years, considerable public attention is being directed at addressing the question of how to reduce the hazardous fuel loads from the overly dense forests that characterize the region. Removal of the many small trees that make up these fuel loads is known to be costly. While large trees can be removed for lumber and other product values as reflected in the market, the market value for the smaller logs may be less than the harvest and hauling charges, resulting in a reduction in value for thinning operations that are needed to lower fire risk. However, failure to remove these small logs results in the retention of ladder fuels that support the transfer of any ground fire to a crown fire with destructive impacts to the forest landscape.
Unfortunately the market does not automatically reflect the costs of negative environmental consequences. If the negative impacts that result from crown fires were fully reflected in the market, there would be high motivation to avoid them, providing the necessary incentive to remove high fuel loads in spite of the cost. There are many market and non-market values associated with reduction of risk that should be important to forest managers and to society at large (Pfilf et al. 2002). For example, the cost of fighting fire could and should be considered a cost of not removing high fuel loads. Similarly, there is the value of avoiding facility losses and fatalities. Communities value a lower fire risk and reduced smoke. The United States Congress has historically placed a very high value on species protection (USDI Fish and Wildlife Service ESA 2003, USDA Forest Service NFMA 2003) yet irreplaceable habitats for threatened and endangered species may be lost when forests burn. Fires also reduce the carbon stored in the forest and the opportunity to produce long lasting pools of carbon stored in products. Fires consume biomass that otherwise could be used for energy conversion and green energy credits.
Regeneration after fires is problematic and costly, and there can be other rehabilitation needed to avoid serious erosion and water contamination from excessive sediment. Water consumed by overly dense forests could be saved for other uses such as habitat, municipal reservoirs, and irrigation. There are also foregone rural economic development benefits from the taxes and rural incomes that would result from fuel reduction activities. Since economic activity in these regions has been in decline as a consequence of lower federal timber harvests, any reduction in unemployment has higher than normal leverage on state and local finances by lowering assistance costs.
In contrast, there may be some negative impacts from removing hazardous fuels such as root damage to the trees left in the overstory or compaction to soils in skid trails that could offset the benefits. These costs need to be considered as well as the benefits of lowering the risk of infestations and disease caused by high stand densities. A complete cost/benefit analysis would attempt to determine if the value of fire risk reduction treatments more than offsets their cost.
The purpose of this study is to assist the design and management of fire risk reduction activities that integrate a suite of public values with strategies customized to local conditions. Rather than attempt to estimate these values for each local community, this project provides a coarse estimate and methodology to assist in the consideration of the broad set of values associated with reductions of hazardous forest fuels. Once the range of values for consideration has been established, a methodology for cost assessment and appraisal can be refined for local situations as necessary.
![]()
4.6.1 Reduced fire fighting cost
Fire cost data is generally available, but it differs from year to year, from fire to fire, and from one location to another. The most costly efforts are likely to be expended when facilities or other assets are in the path of a fire. Fire cost data from the FNF and the ONF appear to agree: the larger the acreage of a fire event then generally the lower the average per acre cost. Large fires have other costs such as losses of habitat and timber resources that can be considered in addition to fire fighting expenditures. Averages of historic fire fighting costs can be used to estimate the future benefit of lowering fire risk through fuel reduction activities. While precise risk assessments are impossible, approximations of the value trade-offs associated with investments today to avoid future risks are useful.
Stands thinned to remove fuel loads have been shown to be unlikely to experience crown fires (Omni et al. 2002). Accounting for the value of that reduced risk exposure must take into consideration both the consequences of not thinning and when those consequences (costs) might occur. With limited knowledge about the probability of when a future fire might occur in a specific location, the savings of future fire-fighting costs must be discounted to an expected present value based upon either a reasonable estimated time to fire or based upon a distributed risk probability.
The present condition of forested areas at risk is a result a century of logging and fire suppression in forests that historically had short fire return intervals (Agee 1993, Powell et al 2001). In 1999, the U. S. General Accounting Office (GAO) issued a report which concluded that "the most extensive and serious problem related to the health of national forests in the interior West is the accumulation of vegetation." The GAO estimated that 39 million acres of national forestlands were at high risk due to excessive fuel loads and that $12 billion would be needed between 1995 and 2015 to reduce excess fuel accumulations, an average expenditure of $725 million annually (GAO 1999). Since this 1999 GAO report, estimates of the acreage of forest considered at high risk have increased. In 2001, the Forest Service reported that 56 million acres of national forestlands were considered at high risk of catastrophic fire, primarily due to overcrowded trees (Powell et al. 2001). The challenge is to better understand the magnitude of this risk exposure and then to be able to translate that magnitude into a present value of risk that is useful for local as well as regional estimations of costs and benefit of fire risk reduction investments.
While analysis of data for this investigation has shown that very large areas of both the Fremont and the Okanogan National Forests (586,323 acres on the FNF; 721,344 acres on the ONF) are at high or moderate fire risk, no methodology has been offered to assess the temporal probabilities of when a forest fire might occur. Such a modeling exercise would be an extremely complex undertaking with output accuracy limited by the generous assumptions that would be needed to deal with multiple unknowns. On the other hand, it is reasonable to assume that at some time there will be a forest fire in high and moderate risk forests and that there is monetary risk associated with that inevitable event. We need estimates of the present value cost of fire risk exposure to understand the benefits of investments in fuels reductions today to reduce risk tomorrow. Creation of an output table that can be used to compare the relative magnitude of cost with the risk of ignition at different times could help define cost ranges. Present value calculations can be used to look at potential costs of future forest fires parametrically such that time, discount rate, and magnitude of event are definable variables readily customized for assignment of present values that fit a spectrum of local expectations. The calculations for two possible accounting approaches to assess the present value of future costs associated with fire in moderate to high risk classes are displayed in Figure 4.28. Method 1 is a calculation of the present (discounted) value of a fire fighting expenditure to be made at a known future date. Method 2 is a calculation that estimates the expected present value of a future fire fighting expenditure at an unknown time with an equal probability of risk for all years in a defined interval. For purposes of this approach, the risk of concern is the present forest condition and the time to fire. Additional risks/costs associated with post-fire re-burn or accumulation of future fuel loads from regeneration, while they are arguably real long term liabilities that add to forest management costs, are not considered for this valuation exercise.
In Table 4.15, cost estimates developed from the use of both methods are displayed. Fire fighting cost is assumed to be $1000/acre and the discount rate is 5%. These figures are offered here only as reasonable estimates. On the FNF and the ONF, the average cost/acre to fight forest fires has been over $1000/acre for the largest fires, and smaller fires can be much more costly (see Figures 4.21 and 4.22). An assumed inflation adjusted discount rate of 5% is common in financial analysis. Results from Method 1, the present value of a future cost at a specific time, show lower cost estimates than those of Method 2 because Method 1 assigns no value to risk probability that a fire could happen sooner than the specified time. Method 1 analysis shows that thinning a forest 30 years before it would have burned results in a present value savings of $231/acre. Considered another way this means that $0.23 is the present value saved today of every $1.00 of fire fighting cost that otherwise would have to be expended in thirty years. As the time to fire shortens, reductions from discounting decrease and the present value approaches the cost outlay. For example, if the forest fire would have occurred in 15 years instead of 30 years, the present value of the fire cost savings is $0.48 per $1.00 of fire fighting cost instead of $0.23.
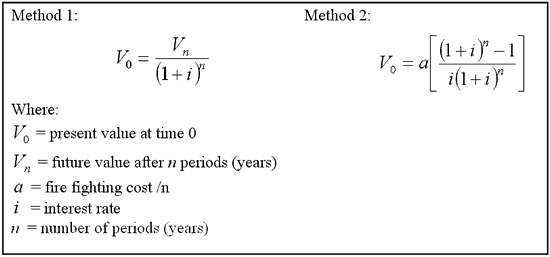
Figure 4.28. Present Value Estimations of
Future Fire Fighting Costs
| Table 4.15 | Parametric Present Value Estimations of Fire Risk Costs with Assumptions of $1000/acre to Fight Fire and 5% as the Discount Rate |
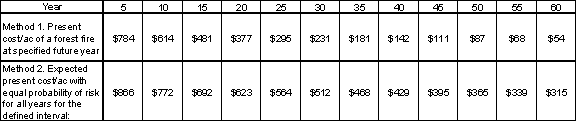
Method 2 employs the use of a standard accounting formula for a terminating annual series (annuity) to estimate the present value of a future expenditure in a given time interval with an equal probability of risk for every year in the interval. For this methodology the cost (in this case $1000/acre) is divided by the number of years in the given interval such that each year has an equal share of the cost burden. The cost (risk probability) assigned to each year is weighted by the discounted interest per year through the time interval. The length of the interval may be considered a surrogate for anticipated risk. Since the time of a future fire event is unknown, Method 2 may be the more robust choice of methodology for the purpose of understanding the present value of expected future fire costs. However, Method 1 may be simpler for forest managers and interested publics to use, and it produces readily understandable results that should be considered conservative estimates of present value. It should be noted that the present value for a 30-year period under Method 2, which assumes a uniform fire probability over the interval ($512/acre) is almost the same as assuming the fire is in the middle of that interval (i.e. at 15 years) under Method 1 ($481/acre). One can use Method 1 for a conservative estimate of method 2 by reducing the middle of the Method 2 interval as the estimated year of a fire under Method 1.
For purposes of developing a user-friendly approach to present valuation of fire risk and other values this report will assume that high risk areas burn in 15 years (or as mentioned above, the mid point of a 30-year uniform fire probability), moderate risk areas burn in 30 years (or as mentioned above, the mid point of a 60-year uniform fire probability), and low risk areas incur no fire fighting costs. In high fire hazard areas, it is assumed that the present value cost for fire fighting is $481/acre (i.e. $0.48 of every $1.00 of future fire fighting cost). The corresponding value for the moderate fire risk areas is $231/acre ($0.23 of every $1.00 of fire fighting cost) and zero cost for the low fire risk areas.
![]()
4.6.2 The value of reduced facilities losses and fatalities
Facility losses and fatalities also contribute to the costs from fire above and beyond the direct cost of fighting fires. Like the cost of the fire, the present value of these benefits will be reduced by the likelihood of when the fire would have occurred. Fatalities from forest fires for the 1990-1998 averaged 4.5 persons per million acres of wildland fires (Mangan 99).
It is difficult to equate the value of lives lost to fire with the cost of fighting fires. The EPA has evaluated methods to estimate the value of reducing risk to human lives, and these estimates can be applied to the situation considered here. While estimates in the range of $3,000,000 to $6,000,000 value per person have been used, this report will adopt a recent estimate by the EPA of $3.7 million per person which is used to calculate the cost of regulations in comparison to expected health benefits (Associated Press 2003).
If the Method 1 approach is employed to estimate present value cost of fatalities, the estimated value of reducing fatalities though fuel removal would be $7.99 per acre for high risk areas and $3.83 per acre for moderate risk areas. While these estimates represent a much smaller contribution than the direct cost of fighting fire, when calculated against an estimate of 56 million acres of national forest at high risk (Powell et al. 2001), the present value of forest fire fatalities is $447,440,000.
Facility losses are highly variable depending on the location of structures relative to the forest. Data now available from four large Colorado fires of 2002 (Rocky Mountain Insurance Information Association 2003) show insurance losses of $70 million from a total burned area of 225,000 acres which averages to $313 per acre. Using Method 1, the present value of preventing these losses would be $150.24 per high risk acre and $71.99 per moderate risk acre. Actual values could be substantially different though depending upon the location of infrastructure. The range of average cost for the four Colorado fires contributing to the above estimate was $250 to $1690 per acre.
4.6.3 The value of lost timber amenities
The loss in marketable timber value represents another opportunity loss even if the forest plan does not include a provision for harvesting, the implicit value in other amenities associated with the timber must be at least as high as the cost for not harvesting in order to justify the no-action alternative. Since these other amenities are lost if the timber is destroyed by a crown fire, the market value of timber lost can be used as a probable lower bound of the true value. Simulations based upon the net yields of the 12" and larger DBH trees from the FNF and ONF show that a conservative estimate of the average lost marketable timber value is $1605/acre. When discounted to produce a present value (Method 1) this figure becomes $772.01/acre for high risk or $370.76 for moderate risk stands.
4.6.4 Habitat losses
Since the passage of the Endangered Species Act (ESA) in 1973 and the subsequent listing of the snail darter (Percina tanasi) in 1975 as an endangered species, a debate has been ongoing about what monetary value is appropriate to assign to species and their habitats. Thirty years after the passage of the ESA, a valuation agreement remains elusive.
In 1978, Chief Justice Warren Burger wrote the majority opinion for the U.S. Supreme Court in the precedent-setting case of the snail darter: "It may seem curious to some that the survival of a relatively small number of three-inch fish among all the countless millions of species extant would require the permanent halting of a virtually complete dam for which Congress has expended more than $100 million. We conclude, however, that the explicit provisions of the Endangered Species Act (ESA) require precisely that result " (Mansfield 2000). Later that same year, however, Congress disagreed with the Supreme Court's valuation and exempted the Tellico Dam Project in Tennessee from the ESA.
Twelve years later, when the northern spotted owl (Strix occidentalis caurina) was listed as a threatened species, no exemption was to be forthcoming in spite of much higher public costs and social impacts. The dominant political perspective appeared to be that no cost ceiling was to limit maximum protections for spotted owls. For example, in 1994, Lippke and Conway estimated the economic impact of harvest reductions to protect 231 owl nests/circles located on state and private forestlands in western Washington. Harvest reduction was estimated to be 2.9 billion board feet for the first ten years resulting in a $448 million loss in personal income per year which adjusted for 2003 dollars becomes $587 million or $2.3 million per owl pair per year (Lippke and Conway 1994). If this circumstance is indeed a reflection of the policy consensus, then cost should not be a limiting factor for hazardous fuels reduction activities in areas where spotted owl habitats are at high risk of fire. In 1995 the USDI Fish and Wildlife Service concluded that large crown fires would be detrimental to the owl by reducing or eliminating nesting, roosting, and foraging habitat (USDI Fish and Wildlife Service 1995). The Forest Service has estimated that it could take 200 years to re-establish ideal conditions for owls following a large-scale catastrophic fire (USDA Forest Service Southwestern Region 1995).
Costly strategies for protection of species habitat have been launched for salmon and steelhead (Oncorhynchus). Five species of salmon and steelhead are listed as threatened or endangered under the ESA. A recent study to estimate the costs of salmon and steelhead recovery suggests that $2.879 billion was spent during the five years between 1997 and 2001 or $575.7 million per year (Landry 2003). In 1998 the Bonneville Power Administration (BPA) spent $342 million on salmon recovery. That year 856,000 salmon entered the mouth of the Columbia River meaning that the average cost per salmon was $399.14 (Bonneville Power Administration Fish and Wildlife Program 1999). Stream temperatures may increase during a forest fire and remain elevated for many years because of increased solar radiation due to the loss of shade generating foliage (Minshall and Brock 1997). Fire-related increases of sediment in streams can result in fish kills for several years after a hot forest fire (Bozek and Young 1994). Some fire-fighting chemicals may be toxic to endangered salmon (Buhl and Hamilton 1998). Forests at high risk of fire that contain salmon streams should be logical targets for fire risk reduction investments when fuel loads are high.
Given that habitats for threatened and endangered species may be lost when forests burn and that the United States Congress has historically placed a very high value on species protection, (USDI Fish and Wildlife Service ESA 2003, USDA Forest Service NFMA 2003), an elusive question has been what is a threatened or endangered species or its habitat worth? While some types of wildlife can safely escape wildfires, others will not. Long term vegetation changes result from fires in overstocked high risk forests. Habitats for many different species are lost when a crown fire consumes forest biomass, but habitats may also be increased for other species. Fire risk reduction treatments may have negative impacts such as soil compaction on habitat but these impacts are not as severe as those from a hot forest fire. The protection of habitat in shortest supply should be an adjunct focus of fuel treatment plans. In some cases protection of habitat may mean fuel removals in other areas; where high or moderate risk forests comprise unique habitats, fuels reductions could occur in adjacent forests to create fire breaks. While the net value of fuels treatments should be a plus for habitat, for this risk evaluation we can consider the value of the lost timber amenities as the lower bound proxy for the habitat value.
![]()
4.6.5 The community value of fire risk reduction
Experimental choice surveys, a specialized form of Contingent Valuation Analysis (CVA), provide a promising method for estimating the Willingness To Pay (WTP) for fire risk reduction. In Washington State, rural and urban families were the subjects of an experimental choice survey, as they selected the best of different forest management alternatives that altered forest attributes. They selected from different mixes of: (1) biodiversity and habitat, (2) aesthetics, (3) rural jobs, (4) cost, and (5) a brand label for the treatments (Xu et al. 2003). The result showed a substantial WTP for biodiversity/habitat and aesthetics restoration, as well as a willingness to accept (WTA) a level of cost and job losses to achieve these benefits. A willingness to pay of more than $100 per year per family for aesthetics and habitat restoration was not uncommon with the amount sensitive to the location of the family (urban/rural) and income. Fire risk would seem to be an even more tangible risk resulting in comparable if not greater WTP estimates.
Contingent values for protection from wildland
fire have been estimated in other regions (Winter and Fried
1998a and b). Winter and Fried estimated a mean annual WTP
for collective risk reduction of $57/household for rural Michigan
populations with the amount sensitive to the level of risk.
Presumably the fire risks in the Inland West region are greater,
supporting at least as high a WTP. While rural families may
be willing to pay more than distant urban families, it is
the collective WTP that determines the benefit amount per
acre. For better understanding of WTP in the FNF and ONF areas,
local surveys would be required to provide estimates of the
collective willingness to pay for fire risk reduction by reducing
fuel loads. However, using the Michigan WTP of $57/household/year,
the number of households in the counties (Lake and Kalamath)
surrounding the FNF and the counties (Chelan and Okanogan)
surrounding the ONF (U.S. Census Bureau 2003) and the number
of acres in high and moderate risk in both forests (see Table
4.16; low risk acres remain fire safe at no cost), one can
calculate a present value/acre of all theoretical annual household
contributions. Since theoretically the WTP value of a forest
protected from destruction is the present value of a perpetual
annual series of payments (Figure 4.29) of $57/household/year,
the value of reducing risk on an acre (high or moderate) is
the same: $44.80/acre for the FNF and $81.60/acre for the
ONF. For this report a mean value of $63.20/acre will be used.
Adding the WTP benefit from more distant urban families would
logically increase the value but has not been done for this
presentation.
Figure 4.29. Present Value of a Perpetual
Annual Series
| Table 4.16 | Present Value (PV)/acre of Theoretical WTP Annual Contributions from Households for Protection from Wildfire on the FNF and ONF (Note that PV is Less for FNF because of Less Population and More Acres at Risk) |
![]()
4.6.6 Carbon credits
By international agreement, countries are attempting to lower carbon emissions (i.e. increase carbon sequestration) in order to slow down global warming. Forests play an important role as carbon is sequestered and stored in forests and wood products. Global carbon emissions can be reduced by biomass conversion to energy that reduces fossil fuel consumption. Wood products prevent carbon emissions by displacing the use of non-renewable, energy- intensive building products such as steel or concrete (Bowyer et al 2002). As demonstrated by carbon assessments for treatment alternatives in this investigation, carbon pools can be measured for any given treatment plan and compared to a No-action plan or a post fire scenario. The transition from a No-action alternative to a post fire alternative, using the FNF and ONF simulations as examples, is likely to result in an average release of 21.5 tons of carbon per acre (2000-2030) if the high and moderate risk forest burns. However, the alternative of thinning from below to 45 ft2 basal area/acre (BA 45) has been shown to reduce the fire hazard effectively and at the same time provide a flow of wood products that displaces fossil fuel intensive products and energy while contributing to a cumulative carbon pool of as much as 80.5 tons per acre. Carbon markets are not well-developed but can be expected to grow with the value of carbon increasing as more emitters of carbon (primarily utilities) bid for carbon offsets. Some studies suggest the value of carbon will need to become much higher than $10/ton in order to reach future emission targets even though current prices are closer to $2. Even $4 per ton would result in an average carbon credit of $326 per acre for the BA45 treatment. If the carbon accounting rules took into consideration the likely impacts of fire risk reduction treatments, the discounted value would be $156.81/acre for high risk and $75.31/acre for moderate risk. However, the Kyoto protocol presently treats carbon flows in products beyond the forest as leakage. Even with this accounting convention, though, as long as the likelihood of fire is considered, the credit for just the carbon in the standing biomass could represent a discounted value of $41.37 per acre for high risk and $19.87 per acre for moderate risk.
The amount of potential carbon stored is also substantial. The difference between the total carbon stored under BA45 verses a wildfire could contribute 68 million tons of additional carbon by 2030.
4.6.7 Green energy credits
Like carbon credits, there are markets that credit green energy sources such that power purchasers pay a premium per kilowatt hour for power produced without fossil fuels and from renewable resources. This could be considered duplicatory with carbon credits and hence no credit is included in this investigation. However, there are emerging market opportunities with benefits for green power producers presently being developed through public utilities districts that may translate back to increased value for wood biomass from overstocked small diameter forests.
4.6.8 Electrical transmission cost reductions
Rural generated energy reduces the need for transmission lines. These cost reductions are likely to be regional-specific and perhaps smaller than many of the other benefits already noted. They could be quite important for some remote locations with a growing population. Rural generation plants also bring the additional benefit of economic development.
4.6.9 Regeneration and rehabilitation costs
Regeneration costs for commercially harvested forestland normally average $250 per acre (interviews 2002). Regeneration costs may be much higher and less successful after a hot forest fire (interviews 2002). Additional expenditures may be needed for rehabilitation activities to reduce erosion and protect water quality. Rehabilitation costs have been reported in the $0-$400 per acre range (interviews 2002). Increased regeneration costs and rehabilitation costs are likely to be site specific, hence for this valuation only an average regeneration cost
($250/acre) has been used to estimate present value of post-fire restoration investments ($120/acre for high risk areas and $58/acre for moderate risk areas).
![]()
4.6.10 Water quantity and quality
Dense, closed forest conditions result in lower water yields than forests with openings in the canopy (Covington1994). Research has shown that thinning forests increases snow pack water equivalency (SWE) and snowmelt runoff while decreasing water losses from evapotranspiration, resulting in increases in available ground and surface water (Troendle 1987, Shepard 1994, Stednick 1996). Increases in water yield from forested sites are proportional to the percentage of canopy removed by harvest (Macdonald 2002). Forest hydrologists have estimated that selective harvesting can result in 20%-40% increases of water yield from pre-harvest conditions and that these increases may last for decades (Troendle 1985, Swanson 1987).
Thinning of overstocked, forested areas at risk from wildfire can help insure future water quality as well as increase water availability. When significant precipitation occurs after a high severity forest fire, rapid surface runoff and peak flows may result in flash floods and erosion that can cause destruction to aquatic habitats and seriously affect water quality for human use (Newcomb and MacDonald 1991, Robichaud and Brown 1999, Scott 2001, Graham 2002).
Development of site-specific economic estimates for the contribution from hazardous fuels reduction treatments to increased availability of water quantities and protected water quality will be important for comprehensive assessments of the costs and benefits of fire risk reduction in overstocked forests. A valuation of estimated additional water yields summed with a valuation of an estimate of protected water quality will require a research effort beyond the scope of this investigation. However, scientists have agreed for some time that benefits can be real and consequential (Wilm and Dunford 1948, Oregon Forest Resources Institute 2000). For purposes of non-market assessments, this report will develop a conservative value estimate for water quantity and quality to be used as a placeholder until further research can better inform valuation decisions.
What is water worth? On the low end, irrigators in the Imperial Irrigation District (IID) in southern California have senior water rights on the Colorado River and get the water for free after paying a delivery charge of $15.50/acre-foot. An acre-foot is the equivalent of one acre of water one foot deep and is equal to 326,000 gallons. Recently the IID negotiated a sale of up to 200,000 acre-feet per year to the San Diego County Water Authority (SDCWA) at the rate of $249/acre-foot. However, the Metropolitan Water District of Southern California (MWD) calculates its untreated water rate at $349/acre-foot (Imperial Irrigation District 2002). In Washington state, Kris Kauffmann, Professional Engineer and the principle consultant of Water Rights Incorporated, reports that an average selling price for irrigation water rights in eastern Washington is $500/acre-foot.
By comparison, Seattle water consumers pay for water purchased from Seattle Public Utilities in units of 100 cubic feet. There are 7.48 gallons in one cubic foot and 43,560 cubic feet in one acre-foot. In a progressive rate system designed to penalize heaviest users, Seattle residents a base rate of $2.35-$2.75/100 cubic foot (CCF) or $1025-$1199/acre-foot depending upon the billing season. As consumption increases, graduated rates rise to as high as $9.75/CCF or $4251/acre-foot (Seattle Public Utilities 2003).
Fish need water also. In 2000, the Washington Department of Ecology (DOE) spent $405,000 to purchase water rights from a Walla Walla farmer so that the water might stay in the river (Associated Press 2000). At that time, DOE Director Tom Fitzsimmons announced that, "Buying water for fish is a key part of managing water in the 21st century…Water has a price tag attached to it, even for fish."
In a study prepared by the Colorado State Forest Service entitled
Proposing a Forestry Solution to Improve Colorado's Water
Supply, authors used a value estimate of $100/acre-foot
to calculate economic benefits from water yield increases associated
with forest harvests. While admittedly future research will
help refine this figure, $100/acre-foot will be used in this
report to demonstrate the relative value of water availability
increases from forest management. The value of protecting water
quality is more elusive and for this report will be considered
as part of the $100/acre-foot figure, insuring that this figure
will be accepted as a conservative estimate of real value.
The Fremont National Forest (FNF) reports 10-20 inches of annual
rainfall and the Okanogan National Forest (ONF) reports approximately
twice as much annual rainfall of 20-40 inches. From the risk
assessments conducted by this investigation, the high and moderate
risk areas of the FNF are calculated to contain 721,344 acres.
For the ONF the high and moderate risk areas are calculated
to contain 586,323 acres. These are acres that for purposes
of fire risk reduction simulations are considered eligible for
treatment. If all acres considered at risk were treated on the
FNF and ONF and resulted in 1 inch of annual precipitation (not
lost from evapotransporation) being added to the available water
supply then the volume of increased water would equal 60,112/acre-feet
per year for the FNF and 48,860/acre-feet per year for the ONF.
At $100/acre-foot the value of this increased water supply would
be $6,011,200/year for the FNF and $4,886,000/year for the ONF.
These calculations result in a conservative estimate of $8.33/risk-acre/year
for the value of the increase to the local water supply from
harvest. If this benefit of 1 inch of additional water exists
for fifteen years until regeneration begins to result in reductions
of available surface water, the present value of an $8.33/risk-acre/year
benefit for 15 years is $86/acre.
![]()
4.6.11 Regional economic benefits
Rural communities, which are most at risk from forest fires, are often economically depressed. While fighting fires will induce some economic activity, much of that benefit goes to imported labor with little positive local impact. Fires also hinder some rural economic activities such as tourism and recreation. Fire risk reduction treatments, however, when scheduled over time, produce positive and sustainable contributions to the economies of local communities. Since many of these communities have lost jobs through the reduced sale of federal timber, the economic development aspect of thinning can be important.
The Freemont National Forest website quotes a harvest to jobs conversion estimate of 8 direct employees per million board foot of harvest and another 16 employees for indirect impacts. In order to convert this into economic activity and tax receipts, this report uses similar estimates tied to a Washington State model (Conway 1994) that were further customized to thinning treatments in Lippke et al. (1996). While the direct and indirect employment impacts are almost identical to the Freemont estimates, the Conway model shows nearly equal impacts broadly distributed to the non-rural parts of Washington State while also providing estimates of the benefits to the Gross State Product which can be extended to tax receipts. A typical thinning treatment of 1 acre each year could generate dynamic direct and indirect impacts of .04 rural employees, $386 State and Local tax receipts (at 11% of State Product) and $664 Federal Receipts (at 19% of State Product including some federal/state transfer duplication). If the government incentivizes fuel reduction treatment programs, much of this investment is recoverable to the Treasury from tax collections. In contrast the untreated acres that result in fire cause a much larger government expenditure (net of the tax collections) on fire fighting economic activity created with little benefit to the local communities. Estimated state and local tax receipts of $386/thinned acre will be used here as a measure of the public economic value generated from forest thinnings to reduce hazardous fuel loads.
4.6.12 Summary of Market and Non-Markets Values of Fires Risk Reduction
While the values assigned to the benefits listed below in Table
4.17 can rightly be considered coarse estimates, they have been
shown to be legitimately defensible and intentionally conservative.
These figures suggest that the benefits of fire risk reduction
are of high value and generally of much higher value than any
market losses resulting from thinning to reduce the fire risk.
| Table 4.17. Summary of Total Values/Acre Estimations of Benefits Associated with Fire Risk Reductions |
Even so, the costs of fire risk reduction should legitimately be considered. The most obvious cost is that of the operation itself. Tables 4.3 and 4.4 display the (positive or negative) net returns from thinning simulations for the FNF and ONF respectively. Net returns that are negative indicate that any financial benefit from the merchantable timber that may be removed is inadequate to cover the overall cost of the thinning operation. The highest treatment cost had a negative return of $374/acre, which resulted from the 9 and under treatment simulation with high costs assumptions on the FNF. On many of the treated areas, however, the 9 and under treatment failed to remove enough of the forest biomass to reduce the risk classification. The most effective treatment for average risk reduction was the BA 45 treatment. This treatment with high operational cost assumptions had a negative return of $168/acre for the FNF and $169/acre for the ONF. In contrast, the BA 45 treatment simulations with low operating cost assumptions produced positive returns on both forests. To ensure conservative accounting, the highest treatment cost of $374 per acre is used in Table 4.18 as a risk reduction cost estimate.
Consideration of the additional costs associated with the preparation of fuels reduction service contracts or timber sales is problematic and beyond the scope of this investigation. However, Forest Service Chief Dale Bosworth (2003) estimated an average cost for timber sales preparation during fiscal years 2001-2003 of $206/acre.
Other potential negative costs associated with harvest activities to reduce hazardous fuel loads might include environmental impacts of soil compaction, damage to leave trees, and road sediments. However, these costs are difficult to estimate and may be avoided with due diligence. Compromises to habitat quality for some species may result from fuel reduction treatments, but it is questionable whether habitat adjustments that result from fuel load reductions are less desirable for species protection than the habitat impacts of catastrophic wildfires (USDI Fish and Wildlife Service 1995, USDA Forest Service Southwestern Region 1995).
![]()
| Table 4.18. Summary of Estimated Costs that Might be Associated with Fire Risk Reduction Treatments |
For this coarse filter cost/benefit analysis, the benefits were intentionally estimated at the low end of their potential while operations costs were estimated at the high end of their potential. It is worthy to note that a subset of stands showed positive net returns after operations costs for all treatment alternatives presented in this investigation. Even
with a net cost of fuel reduction operations, though, the results of this cost/benefit analysis show that the future risk of catastrophic fire is far costlier to the public than investments made today to protect against such an eventuality.
4.7 Cogeneration Analysis
Hazardous fuel loads considered for removal to reduce risk of forest fires on the FNF and ONF are made up of many small diameter logs (Figures 3.7 and 3.16) that are generally considered below size for use as raw material in the manufacture of wood building products. When pulp markets have been strong, there have been opportunities to economically utilize some of this material as pulp. However, pulp markets are currently weak and many of these trees are too small to be used as pulp. New consideration is being given to the potential utilization of small diameter forest biomass as a clean and renewable alternative to fossil fuels for the generation of energy.
To assess the approximate volume of forest biomass available from fuels reductions in the high and moderate risk areas of the FNF and ONF, an estimate of cubic foot volumes per acre for small diameter logs (non-merchantable material) was calculated from a simulated harvest of trees 6 inch and under in diameter at breast height (DBH). Harvest simulations produced volume results of 133,211,521 total cubic feet on the FNF and 124,028,627 cubic feet on the ONF. One cubic foot of forest biomass is assumed to be equivalent to 25 lbs of dry weight or 0.0125 Bone Dry Ton (BDT) (Han et al. 2002). Energy assessments report that one megawatt (MW) of electricity can be generated from 7700 BDT of wood biomass (TSS Consultants 2002). Based upon these conversion relationships, estimated forest biomass for the FNF and ONF could be considered sufficient to fuel a 9-10 megawatt cogeneration facility located near each forest for 20 years. Expected peak operating capacities, however, would need to be predicated upon whether harvests are to be prioritized to reduce highest risk fuel loads first or whether harvest plans are staggered to achieve sustainable rather than declining volumes of biomass over a duration of time sufficient to amortize cogeneration investment (10-20 years).
Estimation of biomass-to-energy capacity, suggested here as available from hazardous fuels removals, is intentionally conservative and likely under estimates total potential. Collective volumes of additional biomass such as the tops and logging residues from the harvest of larger diameter trees, non-merchantable logs from state and private lands, biomass produced as trim and side-cut from milling operations, and regeneration biomass contributing to second generation harvest opportunities (Rummer et al. 2002) are not included in this estimate. Logging residues have been observed to be 7.9% of total harvested saw log volumes (McClain 1996). Biomass volumes harvested from state and private forestland owners could be considerable as well. However, interviews indicate that if the delivered price paid for biomass is less than harvest and haul expenses limited quantities of this fuel will be available from privately managed forestlands (TSS Consultants 2002). Saw mill biomass from trim and side-cut has been estimated to be 14.6% of total harvested saw log volumes, however, 12% of this volume could be utilized as clean chips with 2.6% available for use as fuel (Keegan et al. 1997). Future volumes of biomass that develop from regeneration of public forestlands are problematic to estimate. While important for consideration in long-term forest plans, these future forests are likely to become available after new cogeneration capacity has been fully amortized. Addition of biomass supplies from other sources than public land hazardous fuels removal programs could increase estimated generating capacity by several times. However, additional supply sources are a needed prerequisite for investor confidence. A rule of thumb for financing and development of biomass power plants is that fuel availability must be 2 to 3 times the volume of fuel necessary to sustain a new biomass plant (TSS Consultants 2002).
Since 1936, the area of the inland west dominated
by western juniper (Juniperus occidentalis) has expanded
fivefold. This rapid expansion of juniper establishment has
occurred as a result of favorable climate conditions and decades
of reduced fire frequency and intensity. Juniper crowns have
been observed to intercept more than half of the annual rainfall
before it reaches the soil. Intercepted precipitation is returned
to the atmosphere through evapotransporation or sublimation.
Ranchers have reported that juniper establishment in rangelands
has resulted in small streams and springs drying up and ceasing
to flow (Gedney 1999). Interviews in Oregon with USDA Forest
Service, Bureau of Land Management, and private landowners
indicate that there is strong agreement that broad areas of
juniper should be removed to support rangeland and watershed
restoration/improvements (TSS Consultants 2002). While, there
is no juniper on the ONF, analysis of CVS data for the FNF
reveals that 61 plots (112,826 acres) are dominated by juniper.
This inventory data was excluded from the risk analysis for
this report because there is not a growth model for this species,
however if harvested, juniper could supply 250,000 to 900,000
BDT of additional biomass. This would be roughly equivalent
to an increased cogeneration capacity of 2-6 megawatts/year
for 20 years.
An obstacle to investment in cogeneration development has
been the cost of delivered fuels as compared to the wholesale
value of generated electricity. For every $5.00/BDT change
in the delivered price of fuel, the cost of cogeneration production
is increased by about $0.006 per kilowatt-hour (kWhr). A feasibility
study to consider the siting of a cogeneration plant in Prineville,
Oregon estimated that the current average delivered price
for a BDT of wood biomass is $33.14; assuming a maximum haul
distance of 50 miles (TSS Consultants 2002). At this delivered
price/BDT, cogeneration fuel costs alone approach $0.04/kWhr.
When the cost of fuel is added to the fixed and variable costs
of facilities operations and an expected rate of return, a
base load power sales contract at $0.095/kWhr would be needed
to insure solvency of a cogeneration project. Current power
sales contracts for base load plants range from $0.025 to
$0.04/kWhr. These figures reveal that alternative sources
of energy delivered to the power grid are selling for less
than the cost of delivered biomass fuel not including other
cogeneration costs such as labor, maintenance, depreciation,
and amortization. However, results from the analysis in the
Market and Non-Market Values of Fire Risk Reduction section
of this investigation provide compelling evidence that public
investments in hazardous fuels removals are fiscally prudent.
Opportunities for cogeneration highlight another benefit.
When the government pays to have hazardous fuel loads removed
from at risk forests a collateral result is that the cost
of delivered biomass has been underwritten making cogeneration
newly competitive with less environmentally desirable energy
alternatives.
![]()
4.8 Contracting and Public Outreach
Forest Service, Washington Department of Natural Resources (WA DNR), Oregon Department of Forestry (ODF), community interest groups, timber processors, forest products manufacturers, and representatives of co-generation interests have been interviewed toward developing information on harvest costs, haul costs, log prices, community development issues, and suggestions for improvements in fuel reduction activities (36-FNF, 34-ONF). While not all interview respondants agreed on the appropriate scope of fire risk reductions programs, all seemed in agreement that some risk reduction through management is desireable. All respondants were forthcoming with suggestions for improvement of the contracting process for fuels reduction activities. Recent monitoring and evaluation reports on pilot Stewardship Contracting authorities also agree that opportunities to improve efficiencies in Forest Service hazardous fuels reduction activities are available. During the course of this project ideas emerged from the investigation team as well. The following comments have been designed to merge suggestions from multiple sources into useful recommendations.
In June 2002, the Forest Service offerred a critical review of the statutory, regulatory, and administrative framework under which it has struggled to develop a program to reduce the growing backlog of forest acres at risk of catastrophic fire. This report, entitled "The Process Predicament", divides operational challenges into three fundamental problem areas: excessive analysis, ineffective public involvement, and management inefficiencies. Based upon information resources, encountered in the process of this project, this report provides suggestions pertinent to each of these three areas of concern followed by a brief review of developing Stewardship End Result Contracting opportunities.
4.8.1 Excessive analysis
Inordinate investments of Forest Service resources have been dedicated to project process analysis. Forest Service officials have estimated that planning and assessments consume 40% of total direct work on the National Forest. Improvements in administrative procedures could shift upwards of $100 million per year from planning process to on-the-ground work projects (USDA 2002). Chief Bosworth refers to this situation as "analysis paralysis" (Bosworth 2001). With the backlog of forests at risk growing by 3% per year while accomplishment of actual in-the-forest projects has declined by 50% or more in the last 12 years (Powell et al. 2001), the 'process predicament' has reached crisis proportions. While Chief Bosworth (2001) has called for procedural changes to expedite planning processes, especially for time sensitive projects, he also cautions that, "Forest Service managers must continue to ensure that all land management decisions are based on a collaborative, integrated approach that addresses the environmental implications of our actions in a timely and efficient manner."
Therefore, the operational challenge of reducing
excessive analysis could be logically broadened such that
where analysis is necessary it can be performed in the most
efficient and effective means possible. The analytical portion
of this investigation has been developed to demonstrate that
technology can assist greater analytical efficiencies to support
consideration of complex environmental concerns while informing
timely decisions. User-friendly modeling technologies such
as the Landscape Management System LMS) have the ability to
rapidly deliver visual, tabular, and graphical analytical
outputs from large data sets that are readily interpretable
by both professional and lay publics (McCarter et al. 1998,
McCarter 2001).
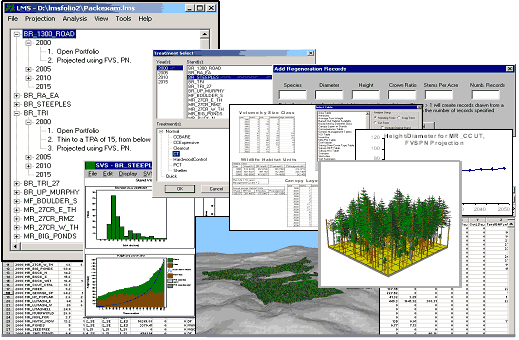
Figure 4.30. The Landscape Management System
Provides Visual, Tabular, and Graphical Capabilities
![]()
Stakeholders seeking to gain common understanding of the complexities implicit in present forest circumstances towards comparative evaluations of potential alternative management outcomes will benefit from emerging analytical capabilities such as have been presented in this project. Analysis created today is an investment in the monitoring and evaluation capability of tomorrow. However, reasonable information expectations must be established such that process is not stalled by excessive caution (Barnard 2003). Decisions must be made based upon best available information. Monitoring the results and learning from experience (adaptive management) will help inform future management choices (Lee 1999).
4.8.2 Ineffective public involvement
A profoundly important and universally available communication technology with application in public forest planning processes is the world wide web. The Forest Service spends millions of dollars each year on publication costs for plans, reports, environmental impact statements, etc. that are sent by mail for public comment. Add to this expense, additional costs and time delays for postal services. As an example, the National Forest tracked costs on a fire recovery project in the Bitterroot National Forest and found that printing and mailing costs for just this one project exceeded $100,000 (U.S. Forest Service 2002).
Currently there is no standardized Forest Service web strategy. Subsequently each forest presents its own web page with highly variable and sometimes disappointing levels of utility. An agency mandated by law to be extraordinarily communicative should avail itself of an opportunity to utilize the most significant advancement in communication since the invention of the printing press. Less expensive and more timely public involvement can be achieved by the development of standardized web sites for every National Forest. Web sites offer low cost instanteous delivery of voluminous documents for public comments, as well as scientific research findings, electronic mapping services, recreational information, forest fire advisories, video conferencing of public meetings, and much more. Interactive web capabilities could provide stakeholder groups and interdisciplinary teams an opportunity to be more involved with public process with less cost and time. Mosely reported (2002) that a lack of interdepartmental communication, especially between planning, timber, and procurement staff, created an institutional barrier within the Forest Service that led to confusion and conflict. Web based communication formats help to standardize problematic dialogues and assure that professionals and publics alike are on the same informational page. Better informed people are likely to be more cooperative process participants.
The Washington Department of Natural Resources (WA DNR) has a timber purchasers committee which functions in an advisory capacity to the state timber sale program. If the Forest Service launches a credible program that is adequate to substantively reduce fuel load accumulations in the inland west, harvesting companies and industry associations report willingness to collaborate in an advisory capacity on development of successful thinning projects. Better business-to-customer communication between the agency and harvesters interview respondents suggest could be beneficial. For example, all contract loggers and mill representatives, that were interviewed, reported that the unreliability of Forest Service cruise information occasionally results in minimum bid levels for timber sales that are unreasonable. Forest Service personnel complain that, after lengthy and expensive planning processes, they are frustrated when timber sales don't receive a minimum bid. For harvest activities that are primarily intended as fuels reduction treatments, purchasers suggest that the timber that is to be removed be sold on a per acre basis or folded into service contracts. This is another area where the internet could be helpful to facilitate better agency/service-provider information exchange. Advertisement and bid of Forest Service contracts could reasonably be conducted from web sites as well.
Other concerned community groups interviewed as part of this project expressed similar interest in assisting planning towards protecting forested environments while creating local economic opportunities. Both the FNF and the ONF have active citizen groups willing to work towards better conditions for their respective communities. However, if equitable opportunities for public involvement in Forest Service planning process are to be achieved then such process must proceed in a timely manner to implementation. Small businesses and citizen volunteers can not reasonably be expected to participate in long and protracted planning processes that produce few opportunities.
![]()
4.8.3 Management inefficiencies
With increasing emphasis on harvesting small diameter forests, tree-marking has become expensive both in time and paint (Mosely 2002). Employees have complained about the undesireable health and environmental side-effects that may accompany the use of tree paint. Harvesters report that operational constraints and hazards are inadvertantly created by pre-selection of take trees. Foresters that spend time marking trees are not available to perform other duties that burden the short-handed Forest Service workforce. Comments from harvesters and Forest Service personnel indicate agreement that cost saving will be achieved if the Forest Service reduced its use of agency personnel to mark trees in thinning treatments. The alternative is to have operator selection of take trees to achieve a designated silvicultural outcome. The WA DNR reports success after ten years of experience with operator selection. Both the Associated Oregon Loggers and the Washington Contract Loggers Association have implemented accredited logger training programs that provide harvesters with sufficient ecological and silvicultural training to operate on Certified Private Forestlands. Both organizations have expressed eagerness to work with the Forest Service to make appropriate additions to these training programs such that harvesters could be qualified to select take trees and meet contract density targets for federal fuels removal treatments. The technological capabilities to model forest conditions that are presented in this report for the benefit of the Forest Service planning process could also be very valuable as educational tools for harvester training programs. University programs such as the Rural Technology Initiative could be available to help with design of silviculture short courses. An educational partnership between the Forest Service and harvester associations could also help to broaden the pool of prospective bidders on federal service contracts; reducing costs and distributing local opportunities. The Forest Service, using new stewardship authority granted by Congress, recently has begun experimentation with operator selection (designation by description) within some Stewardship End Result Contracting pilot projects.
4.8.4 Stewardship Contracting
Stewardship End Result Contracting is a new Forest Service
contracting authority that creates greater ability (beyond the
traditional constraints of timber sales and service contracts)
for the development of innovative forest management projects.
Stewardship contracts might include prescribed burning, road
maintenance or reclamation, watershed or stream restoration,
pre-commercial thinning, thinning to remove hazardous fuels
for fire prone forests, or other modifications of vegetation
to achieve land management goals (U.S. Forest Service 2003).
This new
authority may prove especially valuable for dealing with marginal
value small diameter thinning projects that are designed to
reduce fuel loads.
Many rural communities have experienced economic decline due to severe reductions in federal harvest volumes. Over the last decade, many timber purchasers and harvesting companies have either gone out of business or have found work in state or private forests. If consequential risk reduction is to occur in the inland west, a program of sufficient magnitude and duration will be needed to inspire the confidence necessary to support investments to rebuild rural harvesting and manufacturing infrastructure. Opportunities are being assessed for utilization of non-merchantable logs as feedstock to fuel biomass-to-energy cogeneration facilities but rural investors will need to be assured that business opportunities associated with a federal program of fuels reductions are real. Service contractors and timber sale purchasers report that expanded contract flexibilities in areas such as bonding requirements, scope of projects, and duration of contracts could be helpful. Best value contracting and multi-year contracts are new Stewardship End Result Contracting authorities that may hold promise for response to these suggestions (Kauffman 2002, Pinchot Insitute 2002).
A recent examination of awarded federal contracts revealed that urban companies get most of the work from Forest Service stewardship activities that take place in rural areas (Mosely 2001) in spite of federal Small Business Set-Asides and Hub Zones programs that are designed to assure that rural businesses benefit from preferential contracting opportunities. Forest Service experiments with work contracts that contain Goods for Services packaged into a service contract are reported to result in more small and local contractors bidding on work projects. Goods for services contracts provide the Forest Service with the ability to include some merchantable timber in a service contract such that the cost of the stewardship activity is discounted by the value of any recoverable log sales revenues. Under such circumstances unlike traditional timber sales the small operator benefits from new ability to compete with large companies because of low up-front cost of bidding (Kauffman 2002).
When the economic costs of hazardous fuels reductions are greater than the market returns from harvested log sales, the recoverable value of the logs can be used to discount the cost of the fire risk reduction activity. The resulting combination of harvest contracts with restoration activities minimizes operational impacts to the forest environment by limiting equipment to one entry rather than two. Economic benefits to the Forest Service may be substantial as well. For example, the recent combination of one timber sale with a service contract into a stewardship project is estimated by the contracting officer to have saved the Forest Service $850,000 over the price of two single purpose entries (Bird et al. 2000). Further savings result from reductions to administrative costs when projects are combined. One NEPA process is required to be completed rather than two. Harvested values applied directly to treatment activities mean no loss from government overhead as would occur if revenues were returned to the general fund only to be sent back to the Forest Service as a stewardship appropriation. Several areas of activities may be combined into one long term contract where the value of the harvestable trees from one area carries the costs of fuel removals in another area. In some cases, the Forest Service is able to conduct restoration activities in areas that without goods for services contracting opportunities would otherwise not be treated (Kauffman 2002). The extended length of the contract helps the small business by providing an enduring work opportunity. Goods for Services is a new contracting authority that has been reported to allow multiple value trade-offs (Pinchot Institute 2002).
![]()
Stewardship end result contracting has been mandated by Congress to be accompanied by the design of a multiparty Monitoring and Evaluation Process to review the pilot projects. In July 2000, the Pinchot Institute was awarded the contract for development and implementation of the Multiparty Monitoring and Evaluation Program. Several reports have been completed by regional teams that synthesize accountings from local teams and analyze the effects of regional conditions and circumstances:
The objectives, as specified by Congress, are to consider:
- The potential impact of greater collaboration in land management;
- The potential for new authorities to facilitate project implementation; and
- The potential for stewardship contracts to meet the needs of local communities.
A recommendation of this report will be that this list be expanded to include an additional objective: consider the relative achievement of the environmental, economic, and social goals as declared as objectives by each project. Stewardship end result contracting programs need to be judged for short- and long-term results. The long-term lessons from collaboration and restoration may not be apparent for years but will provide essential information for management improvements in the future. The Pinchot Institute has recommended that funding, training, and technical support for both agency and multiparty stewardship monitoring efforts are essential (2002). Technologies presented within this report could provide useful support for such a program.
However, the Forest Service is being asked to do more with less. A lot more; from 1992 to 2000, according to the National Academy of Public Administration, the number of Forest Service employees fell by 23% (USDA Forest Service 2002). While the backlog of forest acres considered overstocked and at high risk from forest fire is increasing yearly (2-3% per year), funding available for forest density management dropped by 55% from 1988 to 2000 (Powell et al. 2001). A demographic analysis of regional employees indicates that in the years from 2000 to 2005, 35% of the certified Forest Service silviculturists in the Pacific Northwest Region will be eligible to retire. The Forest Service is experiencing progressive skills erosion in the workforce that logically increases the rate of work backlog. This same Forest Service report recommends that the Pacific Northwest Region should enter into a cooperation education program to develop a qualified recruitment pool for needed new hires (Powell et al. 2001). The technological capabilities and philosophical approaches to analysis, as presented in this report, have been designed to deliver educational benefit and to inform critical thinking as applied to management planning of fire-prone dry-site forests in the inland west. These skills will be essential for future Forest Service employees.
Another pilot contracting authority being tested by the Forest Service is called Receipt Retention. Receipt retention may provide the opportunity to address the challenges of limited resources represented by a shrinking skilled work force as well as those of monitoring and evaluation such as have been presented in the two previous paragraphs. Through receipt retention, the Forest Service has been given the ability to retain portions of the receipts at the local level from the sale of commercial products, such as timber, to be held for later reinvestment in non-revenue producing stewardship activities. For decades the Forest Service has managed similar trust funds for road maintenance, regeneration establishment, brush control, etc. (e.g. Knutson-Vandenberg Fund, the Brush Disposal Fund, and the Salvage Sale Fund). However, most of these funds were required to be reapplied to the project areas from which the commercial material had been harvested. New authorities give greater flexibilities for broader discretionary use (U.S. Forest Service 2002).
A combination of annual appropriations and retained stewardship
receipts should be used to establish a trust fund for long term
educational partnerships between the Forest Service and universities
of natural resource sciences in the involved states. Institutions
of higher learning have established skills in training deliveries
and are neutral providers of emerging science and technology.
Many university faculties have long-term research relationships
with the Forest Service through many years of collaboration.
Students supported by the Forest Service scholarships would
commit to post college service much like the Reserve Officers
Training Corps (ROTC) program that has been utilized successfully
by the armed forces. While in college students would work under
faculty supervision to collect data and participate in analysis
to monitor and evaluate stewardship activities. Project partnerships
with students, faculty, Forest Service professionals, community
organizations, and rural harvesters will facilitate healthy
cross-fertilization to encourage innovative and collaborative
problem solving while supplying the National Forest with a future
source of skilled workers and establishing a long-term strategy
to monitor and evaluate the results of stewardship activities.
Training of current personnel and interested publics in the
use of the technologies presented in this report should begin
immediately so that regional programs for fuel reduction treatments
receive timely benefit.
![]()
5. CONCLUSIONS AND DISCUSSION
Investigation of Alternative Strategies for Design, Layout, and Administration of Fuel Removal Projects has provided parametric examination of treatments that reduce fire risk, including their costs, market values, non-market values, and contracting issues. Specific examples are intended for use to customize strategies for a wide range of forest, infrastructure and market conditions. The information is also intended to be useful in training Forest Service professionals, and harvest operators on how to design and layout fuel reduction treatments. Some of the findings from the investigation of the two case study forests are worthy of summary:
- Greater than 75% of both forests was found to be in moderate to high fire risk classifications.
- Generally the 9 and under treatment did not result in sufficient fuels removal to substantively reduce risk in most stands but in some stands with certain diameter distributions this treatment could be used successfully.
- The Half BA and the BA 45 appeared to be the most effective treatments for fire risk reduction.
- BA 45 resulted in the highest percentage of targeted species (ponderosa pine and western larch) after treatments. BA 45 had the best overall fire risk reduction performance.
- The 12 and over treatment produced the greatest revenues but performed poorly for risk reduction.
- Wildfire destroyed almost everything on the FNF but left surviving stems on the ONF.
- The economic performance of the Half BA and BA 45 treatments indicates that many stands may be treated at little or no cost with thinning of some stands resulting in a positive net return.
- Wildlife results were mixed and sometimes counterintuitive. Treatment planning for wildlife will need to be customized to local conditions. For example, wildfire simulations might indicate that controlled burning to reduce fuel loads may have utility for the ONF where modeling results shows some trees survive wildfire but controlled burning may be inadvisable on the FNF where modeling results indicate that wildfire produces total mortality.
- The negative atmospheric carbon consequences of wildfire are significant. No-action (without fire) results in the greatest carbon storage in the standing forest but standing forest carbon is not as large as the magnitude of carbon not released to the atmosphere as a result of substitution.
- Substantial market and non-market values that are not usually accounted for when fire risk reductions are evaluated, justify increases in investments to reduce fire risk.
- There are sufficient volumes of non-merchantable materials in at-risk areas of both the FNF and ONF to warrant consideration of development of cogeneration facilities.
- 71 interview respondents offered valuable comments and suggestions on potential contracting improvements.
- Emerging technologies and contracting innovations are available to help the Forest Service reduce operational costs and delays.
This report also demonstrates how an integrated forestry software package can assist federal agencies and other interested users gain greater efficiencies in planning fire risk reduction treatments to achieve multiple values with less conflict and less cost. The Landscape Management System (LMS) provides a sophisticated user-friendly software environment from which professional and public users with little training can participate in analysis of complex data to better understand the consequences of management alternatives. The results from case study analysis of two National Forests, presented in this report, demonstrate that fire risk can be effectively reduced while creating and protecting other environmental, economic, and social values. These results also brought out some strategic considerations for effective use of technology and for future work towards expanding these developing technical capabilities.
- Analytical technologies can help us with what we do know.
- Based upon available data, in the case of this project the CVS data, we can test the behaviors of alternative strategies. Results help users understand the spectrum of alternative options and the gradient of likely outcomes. This information helps to inform field choices and communicate those choices to interested publics.
- CVS data offers a valuable representation of forest conditions but is very coarse resolution. By analyzing CVS data we gain operational efficiencies when knowledge from simulations serves to focus attention on areas of critical interest (in this case highest fire risk). From high risk areas the focus can be narrowed further to high risk areas in the wild/urban interface where the most urgently critical areas for treatment might logically exist. In these areas better data may be needed to assist decision-making but investments in data collection can be minimized when focused on the precise type and location of need rather than broadcast as part of a much more expensive sampling strategy.
- Use of LMS and other tools can help the Forest Service
to better understand and communicate what will be the
likely consequence of No-action.
- Analytical technologies can help us to discover what we
don't know.
- An example of unexpected discovery from this investigation can be found in the wildlife habitat modeling section. When habitat models were examined, the robustness, especially, in this case, of the ICBEMP source habitat models, came into question.
- Future work is needed to develop and validate wildlife models that are necessary to better inform management decisions. As landscape simulations from this investigation have demonstrated; No-action is not always a safe habitat default. Forest managers must juggle harvest treatments to produce multiple values that necessarily include wildlife habitat. Some areas may need to be heavily thinned as fire breaks to protect other areas that may be at risk but are not treated because of special habitat considerations. Other areas may be treated as part of restoration activities to combine risk reduction with creation of older forest structures. Other areas that are not of special concern may be treated primarily to reduce risk and provide habitat for wildlife that prefer open structures. Planning landscape changes over time will necessitate better wildlife habitat models.
A primary objective of this report has been to develop and demonstrate an integrated forestry software package that can assist federal agencies and other interested users to gain greater efficiencies in planning fire risk reduction treatments to achieve multiple values with less conflict and less cost.
![]()
The Landscape Management System (LMS) provides a sophisticated user-friendly software environment from which professional and public users with little training can participate in analysis of complex data to better understand the consequences of management alternatives. The LMS has been in development under the direction of Dr. Chadwick D. Oliver and Dr. James B. McCarter for more than 10 years as part of the Landscape Management Project at the University of Washington, College of Forest Resources in partnership with the USDA Forest Service. New capabilities and operational refinements are added regularly such that the sophistication of LMS is constantly expanding to stay compatible with other evolving software applications, to meet user demands, and to increase speed and user-friendliness. LMS has been developed to be compatible with other federally developed forestry programs such as SVS, Envision, FVS, and FFE. LMS is being used by many public and private forest landowners and managers and is the only software of its caliber that is distributed to the public at no charge. LMS has proven to be a uniquely positioned investment in the provision of technical support to all interested parties with an eagerness to better understand forest management planning.
The Rural Technology Initiative (RTI) was created in
2000 as a partnership between the University of Washington,
College of Forest Resources, and Washington State University,
Department of Natural Resource Sciences, to aid in the transfer
of technology for managing forests for increased forest products
and environmental values in support of rural forest-resource
based communities. An advisory board representing rural constituents
and community groups supports and guides RTI activities. RTI
staff, faculty, and supported graduate students have extensive
expertise in forestry modeling capabilities and development
of technology-based training modules for delivery to rural communities.
RTI is uniquely positioned to disseminate study findings through
its network of tribes, consultants, WSU Extension agents, landowners,
community organizations, public lands foresters, and industrial
associations. RTI has developed a technology delivery system
through UW, WSU Extension, Community Colleges, and Satelite
Learning Centers to continue training and outreach activities
long after project completion. Technology trainings, in analytical
capabilities demonstrated in this investigation, could be conducted
by RTI personnel and made available to federal agency personnel
for a host of interested government, community, small private
and industry interests. Trainings in available technologies
for forest management could produce lasting process improvements
and maximize benefits of federal investments in forestry modeling
technologies.
WORKS CITED
- Agee, J.K. (1993). Fire ecology of Pacific Northwest
forests. Washington D.C.: Island Press. 493 pp.
- Arno, S.F. (2000). Fire in Western Forest Ecosystems. In:
Brown, J.K., Smith, J.K. (Eds.), Wildland Fire in Ecosystems:
Effects of Fire on Flora (Pp 97-120). (RMRS-GTR-42: vol. 2).
USDA Forest Service. http://www.fs.fed.us/rm/pubs/rmrs_gtr42_2.html
- Associated Press. (2000 November 29). DOE buys water rights
to protect fish. Seattle Times. http://archives.seattletimes.nwsource.com
- Associated Press. (2003 May 9) EPA drops formula placing
less value on seniors' lives. Seattle Times, p. A8.
http://archives.seattletimes.nwsource.com/web/
- Babbitt, B. & D. Glickman. (2000). Managing the impacts
of wildfires on communities and the environment: A report
to the President. http://www.fs.fed.us/fire/nfp/president.shtml.
35pp.
- Barnard, J. (2003). Northwest Forest Plan faulted by one
of its authors. Seattle Times. http://archives.seattletimes.nwsource.com.
- Beukema et al. (2002). Fire and fuels extension to FVS. USDA Forest Service, Intermountain Forest Range and Experiment Station.
![]()
- Beukema, S.J., D.C. Greenough, C.E. Robinson, W.A. Kurtz,
E.D. Reinhart, N.L. Crookston, J.K. Brown, C.C. Hardy, &
A.R. Stage. (1997). An introduction to the fire and fuels
extension to FVS. In: R. Teck, M. Moeur, & J. Adams (Eds.),
Proceedings of the Forest Vegetation Simulator Conference,
1997 February 3-7 (Pp. 191-195). Fort Collins, CO: USDA Forest
Service, Intermountain Forest Range and Experiment Station.
- Bird, S.R.; C.M. Morismith, B. Hathaway, T. Barry. (2002).
Costing for combined service contract/timber sale projects.
http://www.fs.fed.us/bluemountains/pubs.htm
- Birdsay, R.A. (1992). Carbon storage and accumulation on
United States forest ecosystems. (GTR WO-59).USDA Forest Service.
- Blair, G.S., and G. Servheen. (1993). Species conservation
plan for the White-headed Woodpecker (Picoides albolarvatus).
USDA Forest Service (R-1) and Idaho Dept. of Fish and Game.
- Bonneville Power Administration Fish and Wildlife Program.
(1999). Bonneville Power Administration Fish and Wildlife
Budget Tracking Report, End of Year, Fiscal Year 1999. http://www.efw.bpa.gov/EW/FISCAL/Quarterly/99Q4.pdf
- Bosworth, D. (2001). Statement to the subcommittee of forests
and forest health. Committee on Resources. US House of Representatives.
Washington D.C. http://www.fs.fed.us
- Bosworth, D.N. (2003). FY2003 Budget Justification. USDA
Forest Service, Washington D.C. http://www.fs.fed.us/
- Bowyer, J., D. Briggs, B. Lippke, J. Perez-Garcia, J. Wilson.
(2002). Life cycle environmental performance of renewable
industrial materials: CORRIM Phase I Interim Research Report.
CORRIM Inc. 400pp. http://www.corrim.org
- Bozek, M.A., M.K. Young. (1994). Fish mortality resulting
from delayed effects of fire in the Greater Yellowstone Ecosystem.
Great Basin Nat.: 54, 91-95.
- Buchanan, J., W. Keye. (1997). How do you want your smoke?
California Forests, July/August 1997. California Forestry
Association.
- Buhl, K.J., S.J. Hamilton. (1998). Acute toxicity of fire-retardant
and foam-suppressant chemicals to early life stages of Chinook
salmon (Oncorhynchus tshawytsha). Environmental Toxicology
Chemicals 17, 1589-1599.
- Bull, E.L., S.R. Peterson, and J.W. Thomas. (1986). Resource
partitioning among woodpeckers in northeastern Oregon. (Research
Note PNW-444) Portland, OR: USFS PNW Research Station.
- Burdick, J. (2002). Email correspondence 2/10/02. Assistant
Fire Staff in Fire Planning for Okanogan & Wenatchee National
Forest.
- Camp, A.E. (1995). Predicting late successional fire refuging
from physiography and topography. Ph.D. diss., University
of Washington, Seattle, WA. 137pp.
- Conway, R.S. (1994). The forest products economic impact
study: Current conditions and issues. Prepared for: WFPA,
WADNR, WADTED. Seattle WA: Dick Conway & Associates. 39pp.
- Cooper, C.F. (1960). Changes in vegetation, structure, and
growth of southwestern pine forests since white settlement.
Ecol. Monogr, 129-164.
- Courtmanche, J. (2002). LMS software: Changing the face
of forest management. The Journal of the School of Forestry
& Environmental Studies, 3-7. New Haven, CT: Yale
University.
- Covington, W.W. (1994). Historical and anticipated changes
in forest ecosystems of the inland West of the United States.
Journal of Sustainable Forestry: 2(1/2), 13-63.
- Crockett, A.B., Jr. (1975). Ecology and behavior of the Williamson's sapsucker in Colorado. Ph.D. diss., University of Colorado, Boulder. 126pp.
![]()
- Crookston, N.L. (1990). User's guide to the event monitor:
Part of prognosis model version 6. (GTR INT-275). Ogden, UT:
USDA Forest Service, Intermountain Research Station.
- Crookston, N.L., S.J. Beukema, and C. E. Robinson. (2002).
User's guide in the fire and fuels extension to forest vegetation
simulator: Chapter 3. (RMRS-GTR-000). Ogden, UT: USDA Forest
Service, Rocky Mountain Research Station.
- Desimone, S.M. (1997). Occupancy rates and habitat relationships
of Northern Goshawks in historic nesting areas in Oregon.
M.S. Thesis. Oregon State University, Corvallis, OR. 78pp.
- Fiedler, C. E., C. E. Keegan III, C. W. Woodall, T. A. Morgan,
S. H. Robertson, J. T. Chmelik. (2001). A strategic assessment
of fire hazard in Montana. Joint Fire Sciences Program Report.
University of Montana. Missoula, MT. http://www.bber.umt.edu/forestproducts/pdf/MTfiresreport.pdf
- Finn, S.P. (1993). An analysis of Northern Goshawk nest
stands in Okanogan County, Washington. Washington Department
of Wildlife Report, Ephrata, WA.
- Franklin Associates. (1998). Combustion of wood in industrial
boilers. SimaPro5 Lifecycle Assessment Software Package, version
36, 2001.
- Fremont National Forest. (2003). Interviews with Norm Michaels
and Mike Evans and website research. http://www.fs.fed.us/r6/fremont/
- Garrett, K.L., M.G. Raphael, & R.D. Dixon. (1996). White-headed
Woodpecker. The Birds of North America. 252, 1-23.
- Gedney, D.R.; D.L. Azana, C.L. Bolsinger, & N. McKay.
(1999). Western Juniper in Eastern Oregon. (General Technical
Report. PNW-GTR-464). Portland, OR: USDA Forest Service. PNW
Research Station. 53pp.
- Gholz, H.L., C.C. Grier, A.G. Campbell, & A.T. Brown.
(1979). Equations for estimating biomass and leaf area of
plants in the Pacific Northwest. Corvallis, OR: Forest Research
Lab, Oregon State University,
- Government Accounting Office. (1999). Western national forests:
A cohesive strategy is needed to address catastrophic wildfire
threats. (GAO/GCED-99-65). http://www.gao.gov/.
62pp.
- Graham, R.T., ed. (2002). Interim Hayman fire case study
analysis: Executive summary. USDA Forest Service, Rocky Mountain
Research Station. Pp. 1-19.
- Han, H., H.W. Lee, L.R. Johnson, R.L. Folk, T.M. Gorman,
J.M. Hinson, & G.R. Jackson. (2002). Economic feasibility
of small wood harvesting and utilization on the Boise National
Forest: Cascade, Idaho City, Emmett Ranger Districts (pp.62).
Department of Forest Products, College of Natural Resources,
University of Idaho. Moscow, ID.
- Hann, W.J. et al. (1997). Landscape dynamics of the basin.
In: Quigley, T.M.; S.J. Arbelbide, (Technical eds.), An
Assessment of ecosystem components in the interior Columbia
Basin and portions of the Klamath and Great Basins (pp.
337-1055). (Gen tech. Rep. PNW-GTR-405). Portland, OR: USDA
Forest Service, PNW Research Station.
- Hill, B.T. (1998). Western national forests catastrophic
wildfires threaten resources and communities. (GAO/TRCED-98-273).
http://www.gao.gov.
25pp.
- Hopkins, W.E. (1981). Ecology of White Fir. In: Oliver,
C.D., & R.M. Kenady (Eds.), The biology & management
of true fir in the Pacific Northwest, symposium proceedings
1981 February 24-26 (Pp. 35-41). University of Washington,
College of Forest Resources & USDA Forest Service PNW
Station: Seattle-Tacoma, WA.
- Imperial Irrigation District. (2002). http://www.iid.com/water/transfer.html
- Kauffman, M. (2001). The USDA Forest Service national stewardship
pilot projects in the Pacific Northwest: The FY 2001 Report
of the Pacific Northwest Regional Multi-party Monitoring and
Evaluation. Hayfork, CA: The Watershed Research and Training
Center. http://www.pinchot.org/pic/cbf/PNW_regional_FY01.PDF
- Kauffman, M. (2002). The FY 2002 report of the Pacific Northwest
Regional Multi-party Monitoring and Evaluation Team. The Watershed
Research and Training Center. http://www.pinchot.org.
33pp.
- Keegan, C.E. III; D.P. Wichman, D.D. Van Hooser, T.M. Gorman, F.G. Wagner, P.E. Polzin, & A.L. Hearst. (1997). Idaho's forest products industry: A descriptive analysis, 1979-1996. University of Montana, Bureau of Business and Economic Research. Pp.22-45.
![]()
- Lake County Resources Institute. (2003). http://www.lcri.org/
- Landry, C.J. (2003). The cost of salmon recovery: Are we
getting what we pay for? (Working Paper WP03-02 PERC). Bozeman,
Montana. http://www.perc.org/publications/percreports/june2003/salmon.html
- Laverty, L., J. Williams. (2000). Protecting people and
sustaining resources in fire-adapted ecosystems, a cohesive
strategy. USDA Forest Service publication. 85pp. http://www.fs.fed.us/
Lee, K.N. (1999). Appraising adaptive management. Conservation Ecology 3(2). http://www.consecol.org/vol3/iss2/art3/index.html
- Lippke, B., J. Sessions, & A.B. Carey. (1996). Economic
analysis of forest landscape management alternatives: Final
report of the working group on the economic analysis of forest
landscape management alternatives for the Washington Forest
Landscape Management Project. Special Paper 21, CINTRAFOR,
College of Forest Resources, Univ. of Washington, Seattle,
WA. 157 pp.
- Lippke, B., & R. Conway. (1994). Report to the Wildlife
Committee of the Washington Forest Practices Board. Olympia,
WA.
- Local interviews. (2002):
- Forest Service: Woody Woodell, Sue Puddy, Norm Michaels,
Richy Harrod, Michael Daugherty, Jody Perose, Frank Puddy,
Doug Coon, John Townsley, Tom Ketchum, Arlo VanderWoude, Chris
Anderson, Brad Flatten, Jan Flatten, Bob Gibbs, Dave Azuma,
Mike Evans, Richard Stubbs, David Eitner, James Burdick, Myrna
Duke, John Daily and Sally Estes.
- State land managers: Washington Department of Natural
Resources-John Calhoun, Dave Christenson, George Shelton,
John Tweedale, Roy Henderson, Judy Cline, Oregon Department
of Forestry-Ed Scheink, John Brown, John Pellissier.
- Private land managers: Whiskey Creek, Collins Pine,
Hampton tree farms, Boise Cascade
- Mills: Fremont Sawmill, Crown Pacific, and 7 mills
who wished to remain nameless.
- Contractors: Brandeberry Logging Inc., John Lass
Logging, Vargas Timber Cutting, Dave Harmon Logging, M &
L enterprises, John Shepard Logging, Yankee Group, Bill Neubert
Logging, Holly Mountain Resources, 11 contractors who wished
to remain nameless.
- Industry, Environmental and Local Organizations:
Ecosystem Workforce Program-Charles Spencer and Cassandra
Moseley, Sustainable Northwest: Marcus Kauffman, Okanogan
Communities Development Council-Mike Ferris, Lake County Resources
Initiative-Jim Walls and Bill Duke, Defenders of Wildlife-Rick
Brown, American Forest Resource Council-Chuck Burley, Oregon
Associated Loggers-Jim Giessinger, Washington Contract Loggers
Association-Bill Pickell, Chelan County PUD-Brett Bickford.
- MacDonald, L.H. (2002). Effects of changes in Colorado's
forests on water yields & water quality. Colorado Water.
Vol. 18, No. 5: 6-8.
- Mangan, R. (1999). Wildland fire fatalities in the United
States: 1990-1998. (9951-2808-MTDC). USDA Forest Service.
14pp.
- Manriquez, A.C. (2002). Carbon sequestration in the Pacific
Northwest: A model. M.S. Thesis. University of Washington,
Seattle, WA. 167pp.
- Mansfield, D. (2000). Snail darter is no longer in danger
of extinction. Appalachian Focus Environmental News. News-Sentinel.
Knoxville, Tennessee. http://www.appalachianfocus.org/_enviro1/00000011.htm.
- McCarter, J.B. (1997). Integrating forest inventory, growth
and yield and computer visualization into a landscape management
system. In: R. Teck, M. Moeur, and A. J. (Eds.), Forest
Vegetation Simulator Conference (pp. 159-167). Ogden,
UT: USDA Forest Service, Intermountain Research Station.
- McCarter, J.B. (2001). Integrating forest inventory, growth
and yield, and computer visualization into a landscape management
system. Ph.D. diss., University of Washington, Seattle, WA.
- McCarter, J.B., J.S. Wilson, P.J. Baker, J.L. Moffett, &
C.D. Oliver. (1998). Landscape management through integration
of existing tools and emerging Technologies. Journal of
Forestry 96: 17-23.
- Mclain, W.H. (1996). Logging utilization, Idaho, 1990. (INT-RB-86) Ogden, UT: USDA Forest Service, Intermountain Research Station Research Bulletin.
![]()
- McGrath, M.T. (1997). Northern Goshawk habitat analysis
in managed forest landscapes. M.S. Thesis. Oregon State University,
Corvallis, OR. 125pp.
- Michaels, N. & M. Evans. (2003). Fremont National Forest
interview 2/25/03. in Lake County, Oregon.
- Milne, K.A., & S.J. Hejl. (1989). Nest-site characteristics
of white-headed woodpeckers. Journal of Wildlife Management
53: 50-55.
- Minshall, G.W. & J.J. Brock. (1991). Observed &
anticipated effects of forest fire on Yellowstone stream ecosystems.
In: Keiter, R.B., M.S. Boyce (Eds.), Greater Yellow Stone
Ecosystem: Redefining America's Wilderness Heritage (pp.
123-135). New Haven, CT: Yale University Press.
- Mosely, C. (2002). A survey of innovative contracting for
quality jobs and ecosystem management. (PNW-GTR-552). Portland,
OR: USDA Forest Service. 36pp.
- Mosely, C. & S. Shankle. (2001). Who gets the work?
National forest contracting in the Pacific Northwest. Journal
of Forestry 99(9), 32-40.
- Newcombe, C.P. & D.D. MacDonald. (1991). Effects of
suspended sediments on aquatic ecosystems. North American
Journal of Fisheries Management, 72-82.
- Northeastern Cascades Late-successional Reserve Assessment
Team. (1998). An assessment of the Northeastern Cascades late-successional
reserves. USDA Forest Service. Pacific Northwest Region. Okanogan
National Forest.
- Norton, G., Secretary of the Interior. (2002). Fire, Forests,
and the Department of the Interior. http://www.doi.gov/fire/firepresentation.pdf
- Okanogan National Forest. (1989). Final environmental impact
statement, Land and Resource Management Plan, Okanogan National
Forest. Okanogan, WA: USDA Forest Service, Pacific Northwest
Region.
- Okanogan National Forest. (2003). http://www.fs.fed.us/r6/okanogan/
- Omi, P.N., & E.J. Martinson. (2002). Effect of fuels
treatment on wildfire severity. Joint Fire Sciences Program
Report. http://www.cnr.colostate.edu/FS/westfire/FinalReport.pdf
- Oregon Forest Resources Institute. (2000). Drinking water
and forestry: How a healthy forest ecosystem helps keep streams
clean and water quality high. OFRI Special Report.
http://www.oregonforests.org
- Pfilf, R.J., J.F. Marker & R.D. Averill. (2002). Forest
health and fire: An overview and evaluation. Chantilly, VA:
National Association of Forest Service Retirees. http://www.fxs.org/NAFSRforesthealth.pdf
- Pinchot Institute. (2002). Inland Northwest Regional Monitoring
and Evaluation Team for: The Stewardship End Result Contracting
Demonstration Project Annual Report. http://www.pinchot.org
- Powell, D.C., V.A. Rockwell, J.J. Townsley, J. Booser, S.P.
Bulkin, T.H. Martin, B. Obedzinski & F. Zensen. (2001).
Forest density management recent history and trends for the
Pacific Northwest Region. (R6-NR-TM-TP-05-01). USDA Forest
Service. http://www.fs.fed.us/
- Pyne, S.J. (1982). Fire in America: Cultural history of
wildland and rural fire. Princeton, NJ: Princeton University
Press. 654pp.
- Pyne, S.J. (1997). America's fires: Management on wildlands
and forests. Durham, NC: Forest History Society. 54pp.
- Riebsame, W.E. (1997). Atlas of the new west: portrait of
a changing region. New York: W.W. Norton & Co. 192pp.
- Robichaud, P.R. & R.E. Brown. (1999). What happened
after the smoke cleared: Onsite erosion rates after a wildfire
in eastern Oregon. In: Olsen, D.S., J.P. Potyonder (Eds.),
Proceedings of the American Water Resources Association
Specialty Conference, Wildland Hydrology, Bozeman, Montana,
(pp. 1-9).
- Rocky Mountain Insurance Information Association. (2003).
http://www.rmiia.org
- Rummer, J.P; D. May, W.D. Sheppard, D. Ferguson, W. Elliot, S. Miller, S. Reutebuch, J. Barbour, J. Fried, B. Stokes, E. Bilek & K. Skog. (2002). A strategic assessment of forest biomass and fuel reduction treatments in western states. USDA Forest Service. http://www.fs.fed.us/research/infocenter.html
![]()
- Scott, J.H. & E.D. Reinhardt. (2001). Assessing crown
fire potential by linking models of surface and crown fire
behavior. (Research Paper RMRS-RP-29). Fort Collins, CO: USDA
Forest Service, Rocky Mountain Research Station.
- Seattle Public Utilities. (2003). 2003 Residential Rates
for Drinking Water. http://www.cityofseattle.net/util/services/rates/rates_res2003.htm
- Shepard, J.P. (1994). Effects of forest management on surface
water quality in wetland forests. Wetlands 14, 18-26.
- Sousa, P.J. (1982). Habitat suitability index models: Lewis'
woodpecker. (FWS/OBS-82/10.32). U.S. Dept. of the Interior
Fish and Wild Service. 14pp.
- Sousa, P.J. (1983). Habitat suitability index models: Williamson's
sapsucker. (FWS/OBS-82/10.47). U.S. Dept. of the Interior
Fish and Wildlife Service. 13pp.
- Stage, A.R. (1973). Prognosis model for stand development.
(Research Paper INT-137). Odgen, UT: USDA Forest Service,
Intermountain Forest and Range Experiment Station.
- Stednick, J.D. (1996). Monitoring the effects of timber
harvest on annual water yield. Journal of Hydrology 176,
79-95.
- Stewart, J.L. (1988). Forest insects and disease research:
What is needed? Presentation to Western Forestry and Conservation
Association Pest Committee, Seattle, WA.
- Swan, L. (2002). Medford, OR: USDA Forest Service.
- Swanson, R.H. (1987). Applying hydrologic principles to
the management of sub-alpine forest for water supply. In Management
of sub-alpine forests building on 50 years of research. Procedures:
Technical Conference, Silver Creek, Co. July 6-9, 1987 (pp79-85).
(GTR-RM-119). Fort Collins, CO:USDA Forest Service, Rocky
Mountain Forest and Range Exp. Station.
- The Office of the President. (2002). Healthy forests: An
initiative for wildfire prevention and stronger communities.
http://www.whitehouse.gov/infocus/healthyforests/toc.html
- Troendle, C.A. (1987). The potential effects of partial
cutting and thinning on streamflow from subalpine forest.
(Research Paper RM-274). Fort Collins, CO: USDA Forest Service,
Rocky Mountain Forest & Range Exp. Station. 7pp.
- Troendle, C.A. & R.M. King. (1985). The effect of timber
harvest on Fool Creek Watershed, 30 years Later. Water
Resource Bulletin, 21(12), 1915-1922.
- TSS Consultants. (2002). Prineville, Oregon market area
wood fuel availability assessment. Rancho Cordova, CA. http://www.tssconsultants.com
- United States National Interagency Fire Center. (2002).
Wildland fire statistics. http://www.nifc.gov/stats/wildlandfirestats.html
- US Census Bureau. (2003). Oregon and Washington statistics.
http://www.census.gov/
- USDA Forest Service. (2002). The process predicament: How
statutory, regulatory, and administrative factors affect national
forest management. http://www.fs.fed.us.
40pp.
- USDA Forest Service. (2003). The National Forest Management
Act. Washington D.C. http://www.fs.fed.us/forum/nepa/nfmalaw.html
- USDA Forest Service. (2003). Stewardship end result contracting.
notice of interim guidelines: Opportunity for public comment.
Federal Register Vol.68 no. 124, 38285-38288.
- USDA Forest Service SW Region. (1995). Final environmental
impact statement for amendment of forest plans. Albuquerque,
New Mexico.
- USDI Fish and Wildlife Service. (1995). Recovery plan for
the Mexican Spotted Owl, Volume 1. Albuquerque, New Mexico.
- USDI Fish and Wildlife Service. (2003). Endangered Species
Act. Washington D.C. http://endangered.fws.gov/esaall.pdf
- USDI Fish and Wildlife Service. (1980a). Habitat Evaluation Procedures (HEP). (ESM 102). Washington, D.C.: Division of Ecological Services. 123pp.
![]()
- USDI Fish and Wildlife Service. (1980b). Standards for the
development of Habitat Suitability Index (HSI) models. (ESM
103). Washington, D.C.: Division of Ecological Services.
- USDI Fish and Wildlife Service. (2001). Habitat suitability
index models: Species index. http://www.nwrc.gov/wdb/pub/hsi/hsiindex.htm
- Van Dyck, M. (2000). Keyword reference guide for the forest
vegetation simulator. Fort Collins, CO: USDA Forest Service,
WO-TM Service Center.
- Weber, W.C. & S.R. Cannings. (1976). The White-headed
woodpecker. In: British Columbia. Syesis 9, 215-220.
- Western Governors Association. (2001, 2002). Western Governors
Association: A collaborative approach for reducing wildland
fire risks to communities and the environment 10-Year Comprehensive
Strategy Implementation Plan. http://www.westgov.org/
- Wilm, H.G. & E.G. Danford. (1948). Effect of timber
cutting on water available for stream flow from lodgepole
pine forest. In: Technical Bullitin 968, 43. Washington
D.C.: USDA Forest Service.
- Winter, G. & J. Fried. (1998a). Valuing the social and
economic impacts of fir at the urban-wildland interface: A
statistical summary of survey responses. Web posted: gregw
 pacificrim.net.
- Winter, G. & J.Fried. (1998b) (submitted). Theoretical
validity of contingent values for protection from wildland
fire. Land Economists.
- Wisdom, M.J., R.S. Holthausen, B.C. Wales, C.D. Hargis,
V.A. Saab, D.C. Lee, W.J. Hann, T.D. Rich, M.M. Rowland, W.J.
Murphy & M.R. Eames. (2000a). Source habitats for terrestrial
vertebrates of focus in the interior Columbia Basin: broad-scale
trends and management implications. In: General technical
report PNW-GTR-485, Volume 1 - Overview. Portland, OR:
USDA Forest Service, Pacific Northwest Research Station.
- Wisdom, M.J., R.S. Holthausen, B.C. Wales, C.D. Hargis,
V.A. Saab, D.C. Lee, W.J. Hann, T.D. Rich, M.M. Rowland, W.J.
Murphy & M.R. Eames. (2000b). Source habitats for terrestrial
vertebrates of focus in the interior Columbia Basin: broad-scale
trends and management implications. In: General technical
report PNW-GTR-485, Volume 3 - Appendices. Portland, OR:
USDA Forest Service, Pacific Northwest Research Station.
- Wykoff et al. (1982). Forest vegetation simulator model.
Fort Collins, Colorado.
- Xu, W., B.R. Lippke, & J. Perez-Garcia. (2003). Valuing
biodiversity, aesthetics and job losses associated with ecosystem
management using stated preferences. Forest Science.
![]()

