 |
 |
 |
 |


|
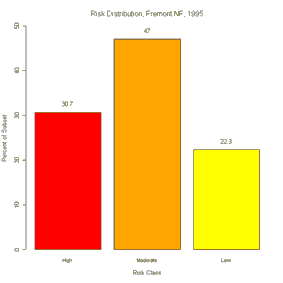
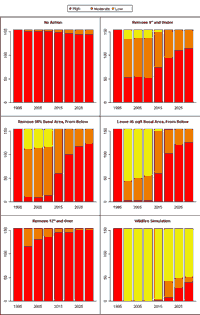
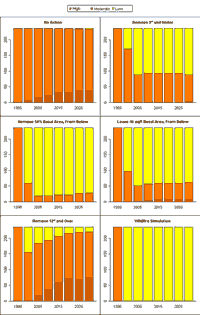
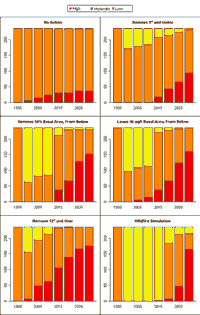
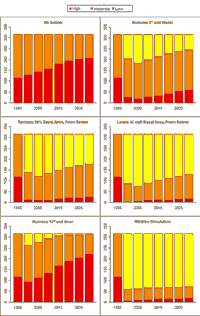
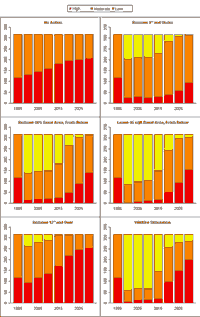
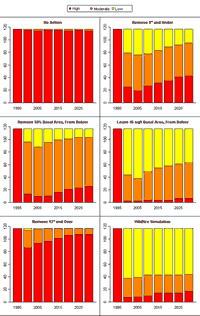
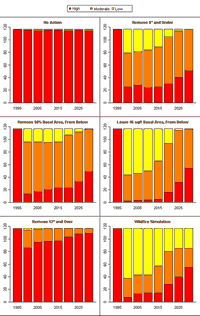
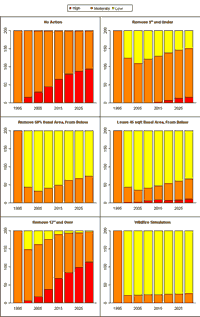
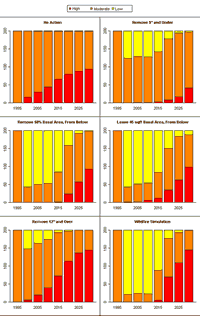
APPENDIX A. FIRE RISK CLASSIFICATIONHigh, moderate, and low fire risk was estimated for each CVS plot in the simulation dataset based on the Severe Crowning Index assessment from the Potential Fire Report produced by FFE. The Crowning Index indicates the estimated wind speed in miles per hour (mph) at 20 feet off the ground that would initiate an active crown fire assuming ignition of a surface fire. Assumptions required by the model include a temperature of 70 degrees Fahrenheit and 'very dry' moisture conditions (Crookston et al. 2002). Results from the crowning index estimates for each stand were sorted into one of three risk classes. Lower wind speeds indicate greater risk. If the crowning index was less than or equal to 25 mph, then the plot was considered to be in the high fire risk category. Moderate risk stands were those with a Severe Crowning Index of 25 through 50 mph. Low fire risk stands were those with a crowning index greater than 50 mph. Very young or clearcut stands function outside of the range of the model and subsequently record Severe Crowning Indices less than zero. To accommodate this model behavior, stands with a crowning index below zero are classed as low risk.
It should be noted that risk classifications are arbitrary thresholds useful and necessary for comparative analysis but that they may very well understate the risk at the margins. The word moderate properly segments a risk difference between high and low although the risk of a fire from wind speeds only slightly higher than 25 MPH might not be considered a moderate risk by many publics. It is in part for this reason that performance comparisons for treatment alternatives were reported in this investigation for high and moderate as separate risk classes and then combined as the total area to be considered for risk reduction treatments. The initial 1995 fire risk distribution for the Fremont and Okanogan National Forests was reported as the percentage of CVS plots in each of the fire risk categories prior to any treatment or growth simulation. Fire risk distribution was similarly reported for projected and treated plot inventories at each growth cycle. For purposes of simulations to demonstrate comparisons between treatment alternatives only the plots with high and moderate initial classification were treated. Low risk areas did not receive treatment simulations since treatments of low risk areas would logically be considered unnecessary or of low priority. While some low risk areas may experience increases in risk over time most low risk areas appear to be either very young small diameter forests or rangeland/forest interface with sparse distributions of forest inventories that are unlikely to require fuels reductions at the time of this study.
APPENDIX B. FREMONT NATIONAL FOREST
List of Figures
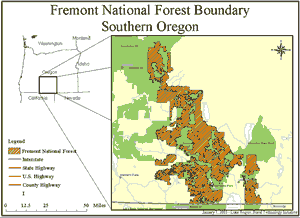
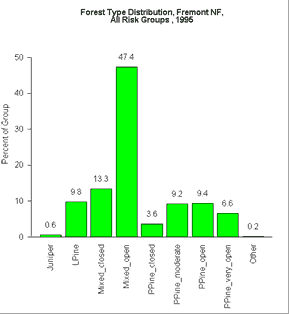
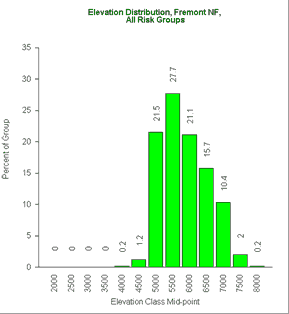
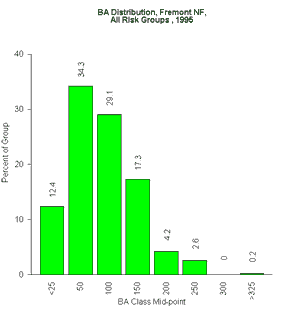
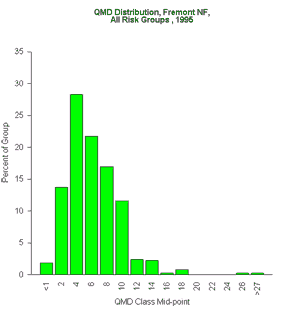
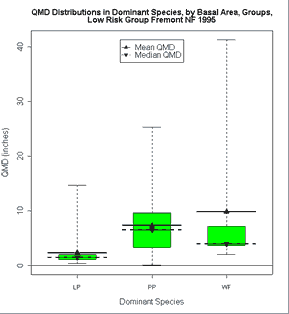
Fremont: Forest type, Elevation, Basal area, QMD
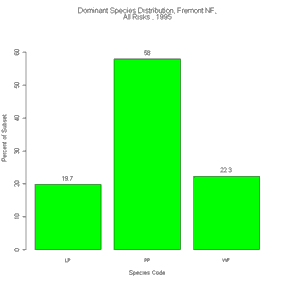
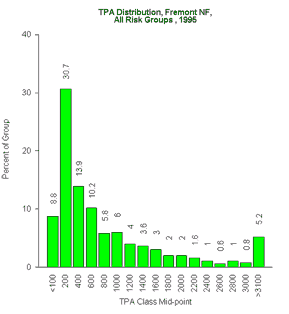
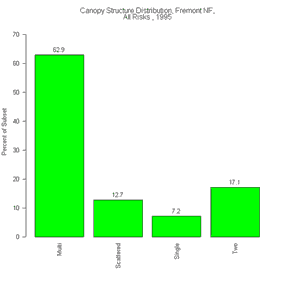
Fremont: Species, TPA, Canopy structure, Fire risk
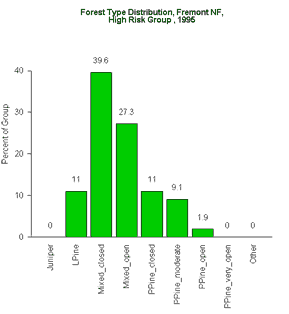
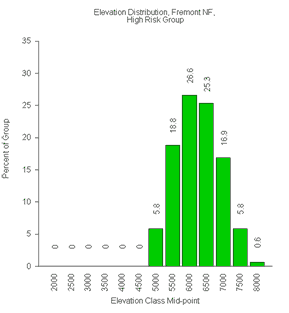
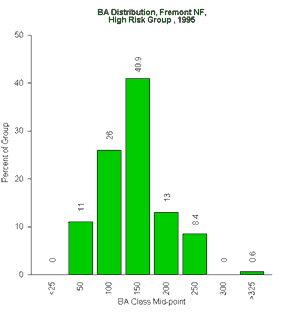
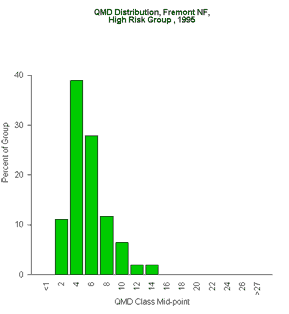
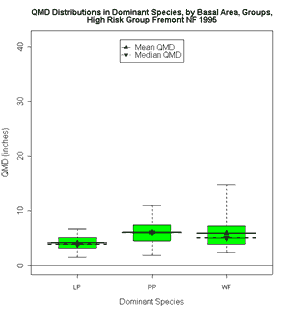
Fremont - High Risk Stands: Forest type, Elevation, Basal area, QMD
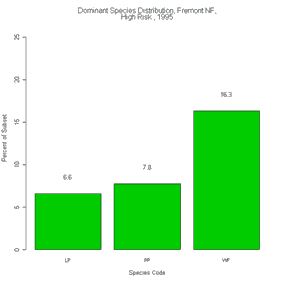
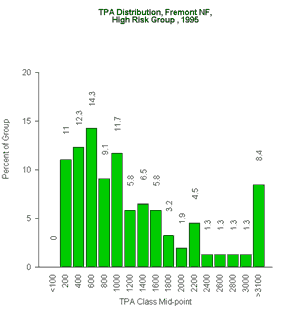
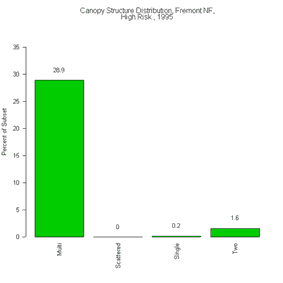
Fremont - High Risk Stands: Species, TPA, Canopy Structure
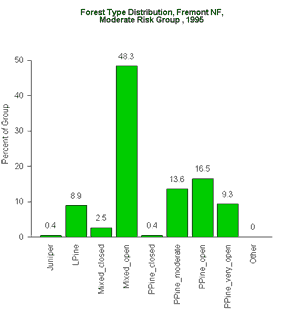
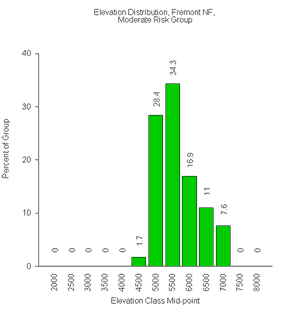
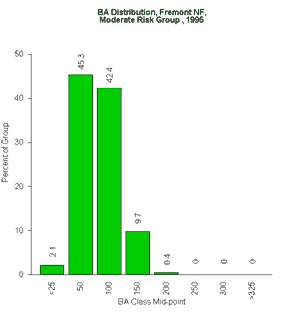
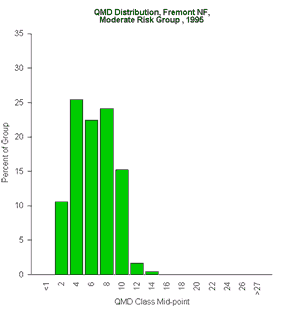
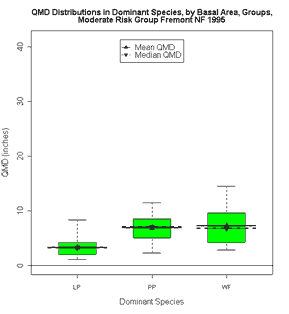
Fremont - Moderate Risk Stands: Forest type, Elevation, Basal area, QMD
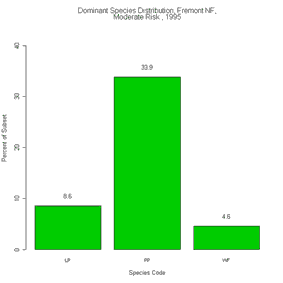
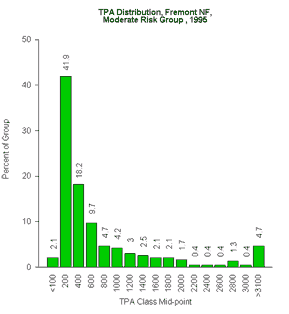
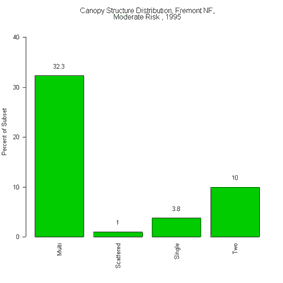
Fremont - Moderate Risk Stands: Species, TPA, Canopy Structure
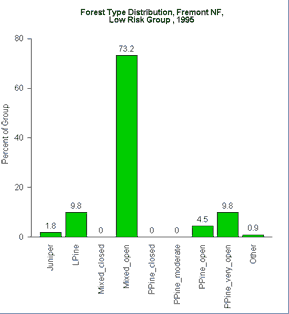
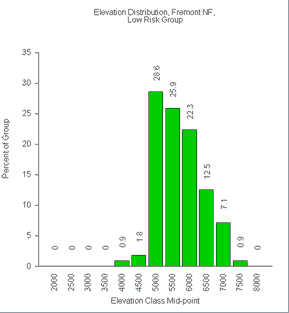
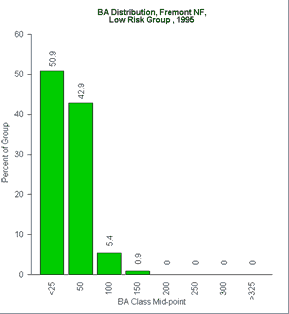
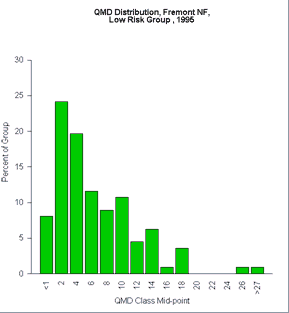
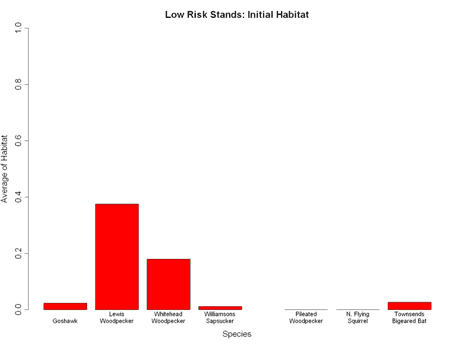
Fremont - Low Risk Stands: Forest type, Elevation, Basal area, QMD
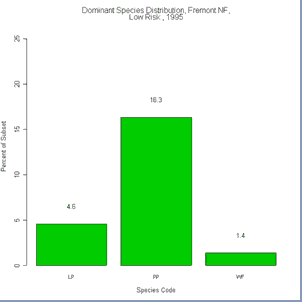
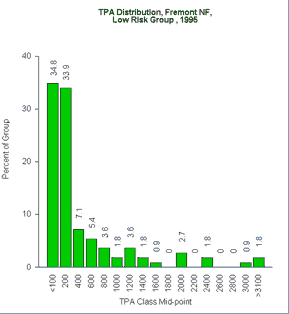
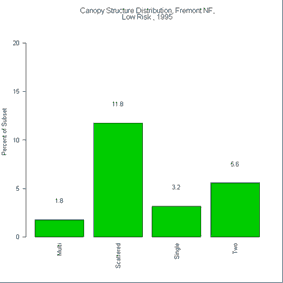
Fremont - Low Risk Stands: Species, TPA, Canopy Structure
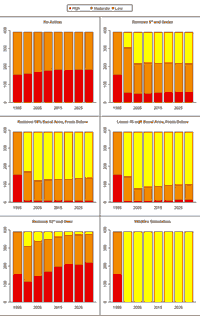
Fremont - High & Moderate Risk Stands: Fire Risk without regeneration
Fremont - High & Moderate Risk Stands: Fire Risk with regeneration
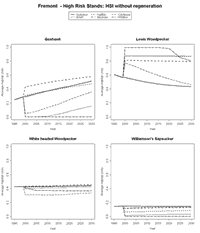
Fremont - High Risk Stands: Fire Risk without regeneration
Fremont - High Risk Stands: Fire Risk with regeneration
Fremont - Moderate Risk Stands: Fire Risk without regeneration
Fremont - Moderate Risk Stands: Fire Risk with regeneration
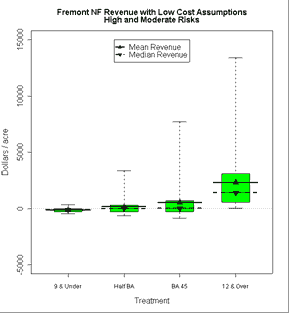
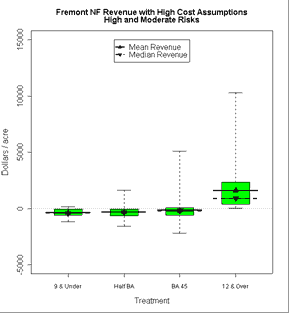
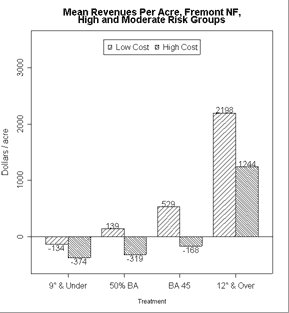
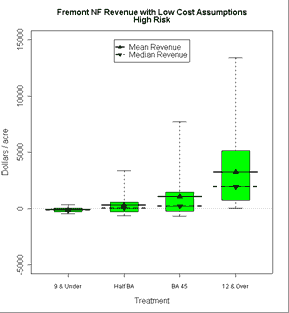
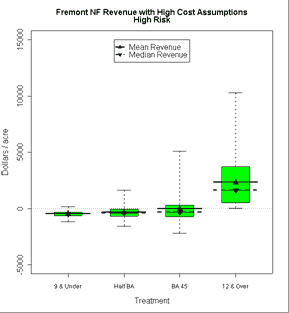
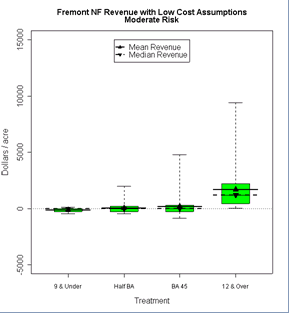
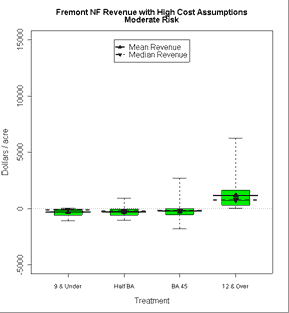
Fremont - High & Moderate Risk Stands: Economics, Low & High Costs
Fremont - High Risk & Moderate Risk Stands: Economics, Low & High Cost
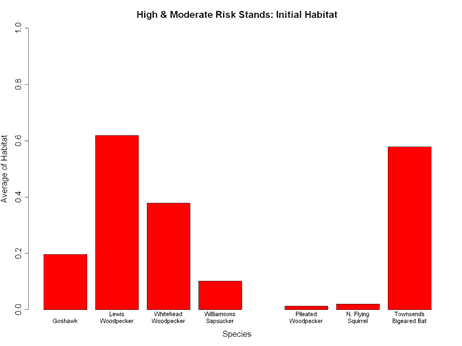
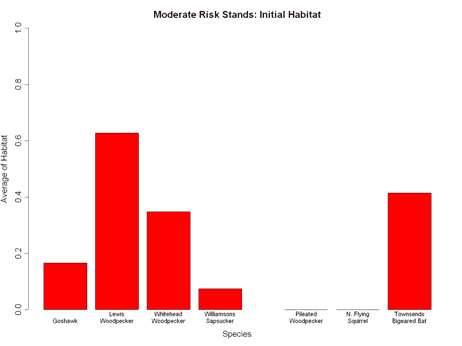
Fremont - High & Moderate Risk Stands: Initial Habitat
Fremont - High Risk & Moderate Risk: Initial Habitat
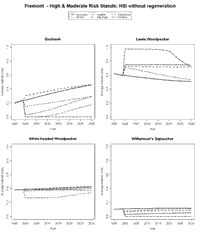
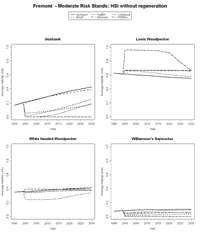
Fremont - High & Moderate Risk Stands: Wildlife HSI without Regeneration
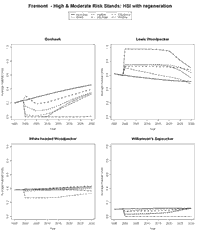
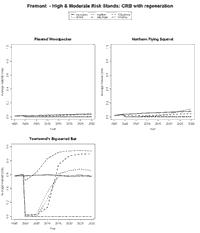
Fremont - High & Moderate Stands: Wildlife HSI with Regeneration
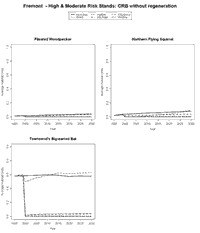
Fremont - High & Moderate Stands: Wildlife Source Habitat without Regeneration
Fremont - High & Moderate Stands: Wildlife Source Habitat with Regeneration
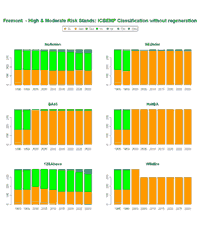
Fremont - High & Moderate Risk: Source Habitat ( ICBEMP) Classification without Regeneration
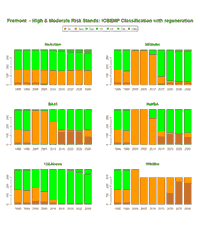
Fremont - High & Moderate Risk: Source Habitat ( ICBEMP) Classification with Regeneration Fremont - High Risk Stands: Wildlife HSI without Regeneration
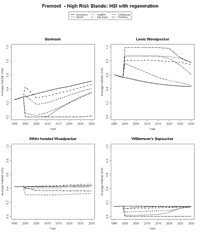
Fremont - High Risk Stands: Wildlife HSI with Regeneration
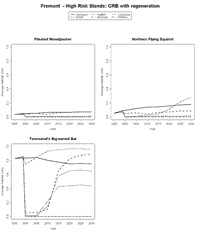
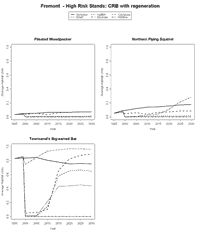
Fremont - High Risk Stands: Wildlife Source Habitat without Regeneration Fremont - High Risk Stands: Wildlife Source Habitat with Regeneration
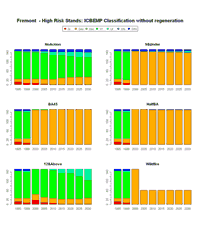
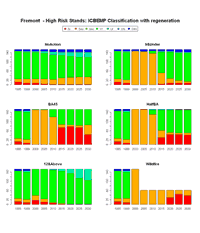
Fremont - High Risk Stands: Source Habitat (ICBEMP) Classification without Regeneration
Fremont - High Risk Stands: Source Habitat (ICBEMP) Classification with Regeneration Fremont - Moderate Risk Stands: Wildlife HSI without Regeneration
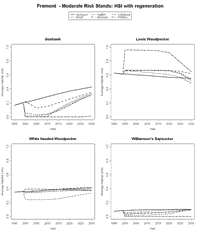
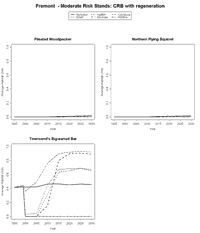
Fremont - Moderate Risk Stands: Wildlife HSI with Regeneration
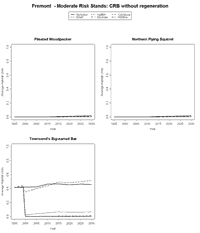
Fremont - Moderate Risk Stands: Wildlife Source Habitat without Regeneration Fremont - Moderate Risk Stands: Wildlife Source Habitat with Regeneration
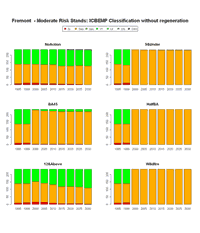
Fremont - Moderate Risk Stands: Source Habitat (ICBEMP) Classification without Regeneration
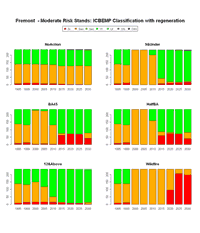
Fremont - Moderate Risk Stands: Source Habitat (ICBEMP) Classification with Regeneration Fremont - High & Moderate Risk Stands: Carbon without regeneration
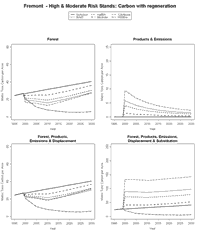
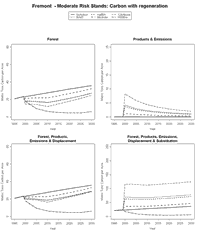
Fremont - High & Moderate Risk Stands: Carbon with regeneration
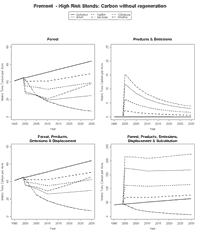
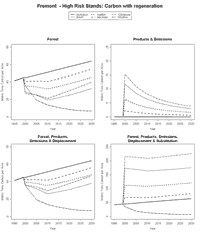
Fremont - High Risk Stands: Carbon without regeneration Fremont - High Risk Stands: Carbon with regeneration
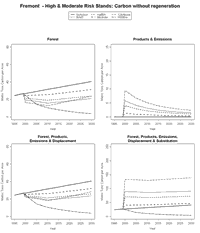
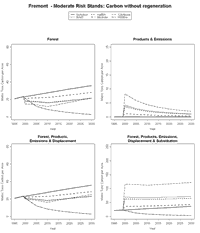
Fremont - Moderate Risk Stands: Carbon without regeneration
Fremont - Moderate Risk Stands: Carbon with regeneration
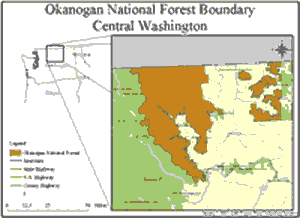
APPENDIX C. OKANOGAN NATIONAL FORESTAppendix C: Okanogan National Forest Map and Results |
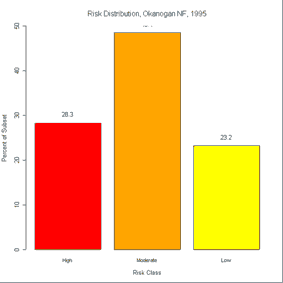
| Risk Class |
Stands
|
Percent
|
| High Risk |
117
|
28.33
|
| Moderate Risk |
200
|
48.43
|
| Low Risk |
96
|
23.24
|
| Total |
413
|
|
List of Figures
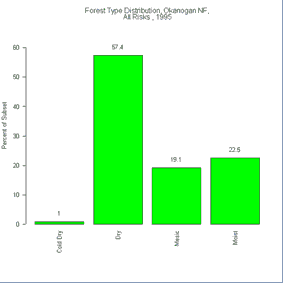
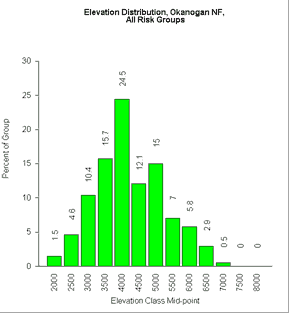
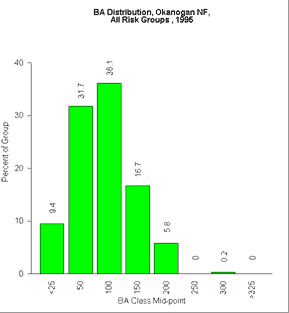
Okanogan: Forest type, Elevation, Basal area, QMD
 |
 |
 |
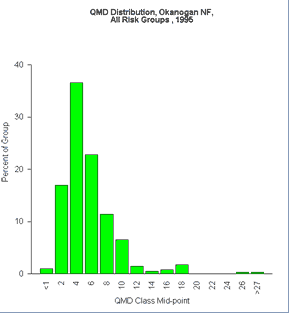 |
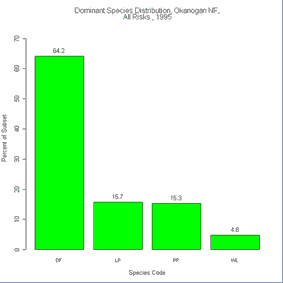
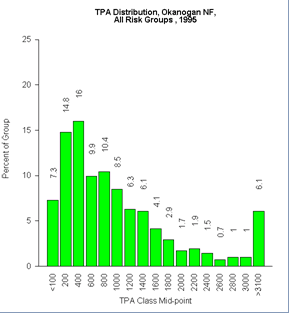
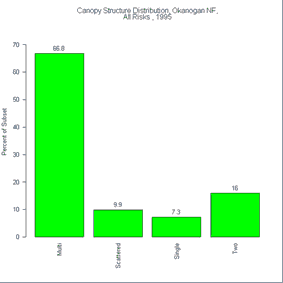
Okanogan: Species, TPA, Canopy structure, Fire risk
 |
 |
 |
 |
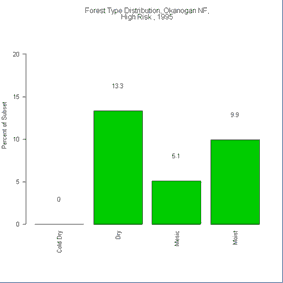
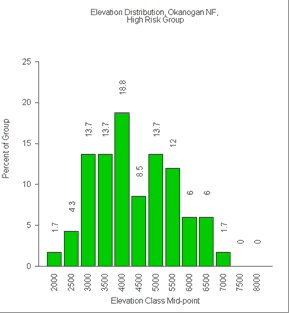
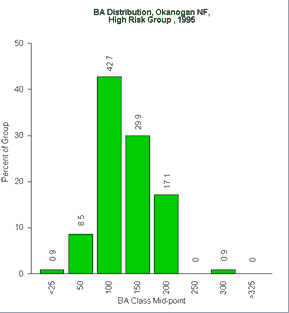
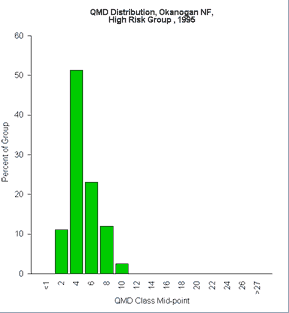
Okanogan - High Risk Stands: Forest type, Elevation, Basal area, QMD
 |
 |
 |
 |
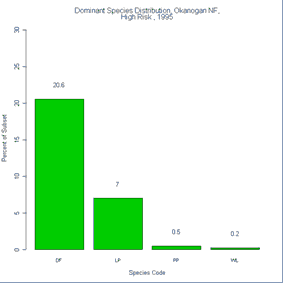
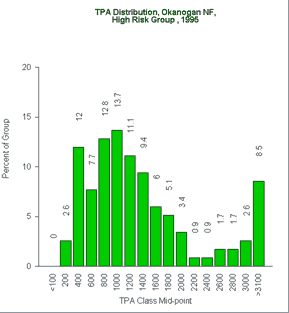
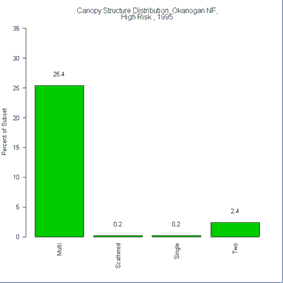
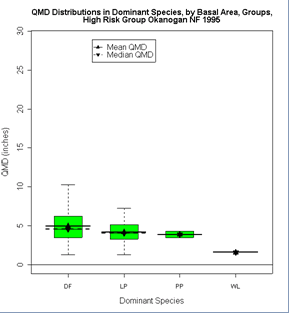
Okanogan - High Risk Stands: Species, TPA, Canopy Structure
 |
 |
 |
 |
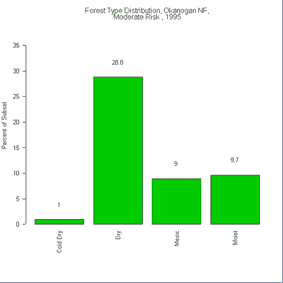
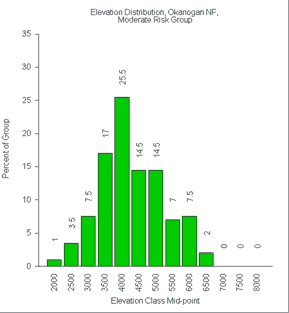
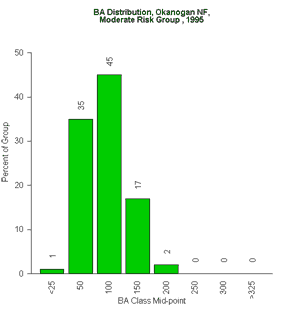
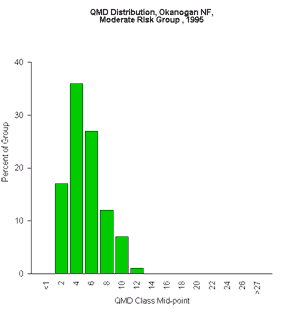
Okanogan - Moderate Risk Stands: Forest type, Elevation, Basal area, QMD
 |
 |
 |
 |
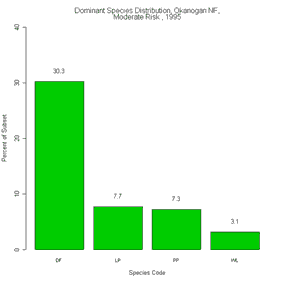
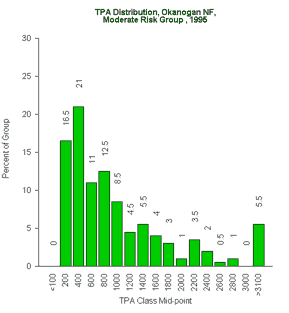
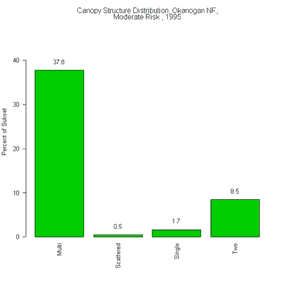
Okanogan - Moderate Risk Stands: Species, TPA, Canopy Structure
 |
 |
 |
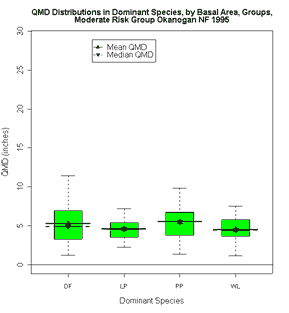 |
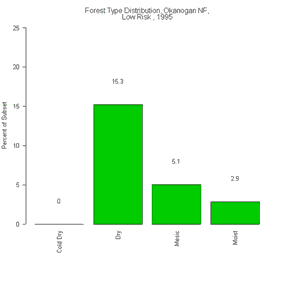
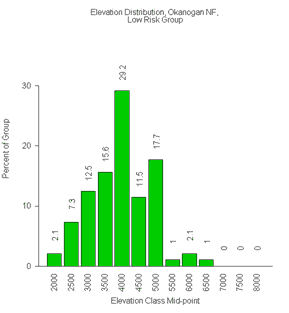
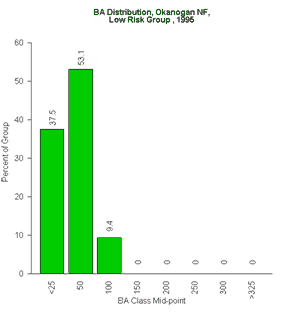
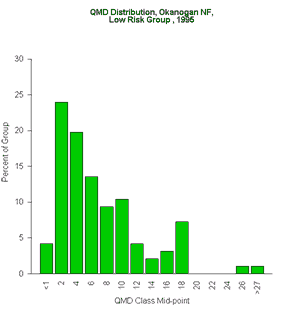
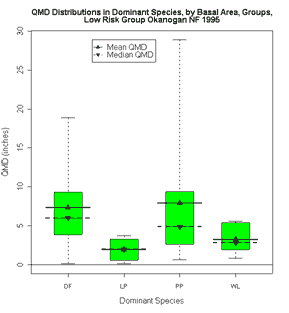
Okanogan - Low Risk Stands: Forest type, Elevation, Basal area, QMD
 |
 |
 |
 |
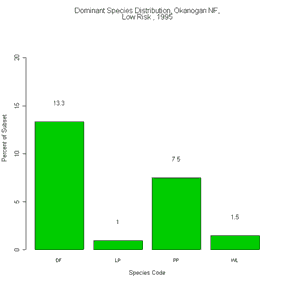
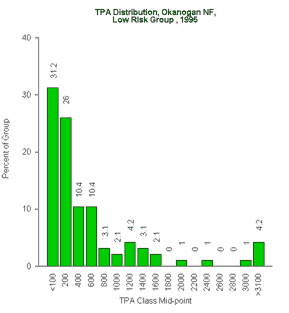
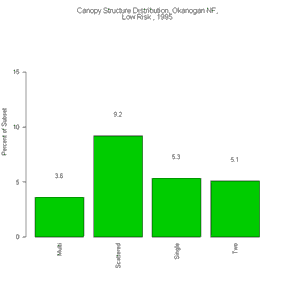
Okanogan - Low Risk Stands: Species, TPA, Canopy Structure
 |
 |
 |
 |
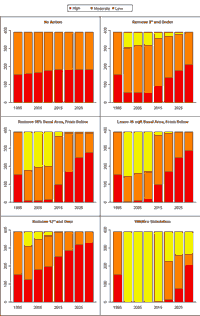
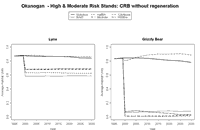
Okanogan - High & Moderate Risk Stands: Fire Risk without regeneration
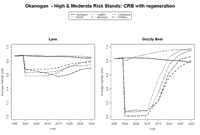
Okanogan - High & Moderate Risk Stands: Fire Risk with regeneration
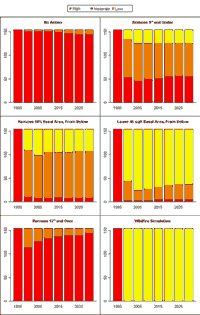
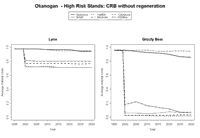
Okanogan - High Risk Stands: Fire Risk without regeneration
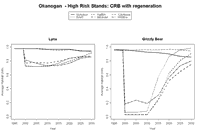
Okanogan - High Risk Stands: Fire Risk without regeneration
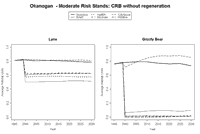
Okanogan - Moderate Risk Stands: Fire Risk without regeneration
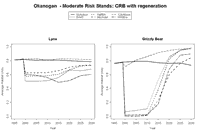
Okanogan - Moderate Risk Stands: Fire Risk with regeneration
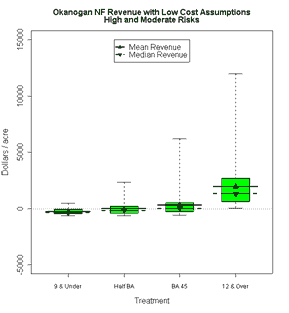
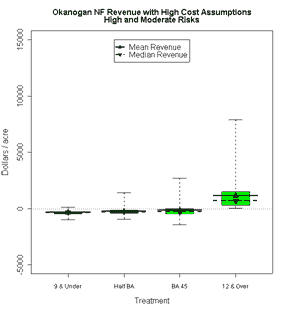
Okanogan - High & Moderate Risk Stands: Economics, Low & High Cost
 |
 |
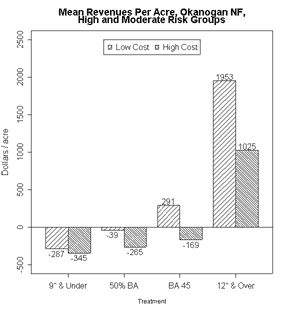 |
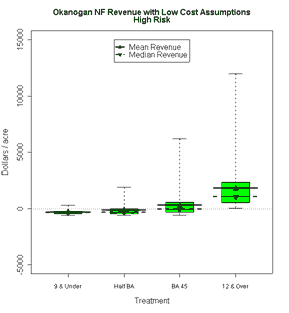
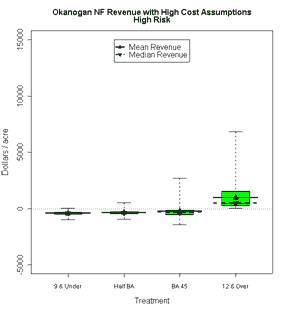
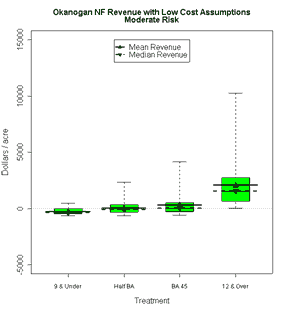
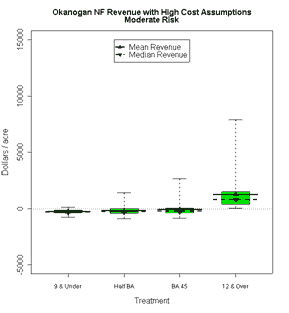
Okanogan - High Risk & Moderate Risk Stands: Economics, Low & High Cost
 |
 |
 |
 |
| Okanogan - High & Moderate Risk Stands: Initial Habitat |
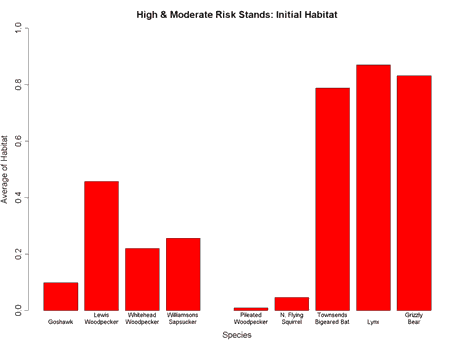 |
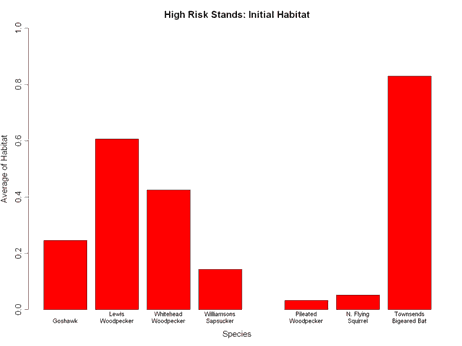 |
| Okanogan - High Risk & Moderate Risk: Initial Habitat |
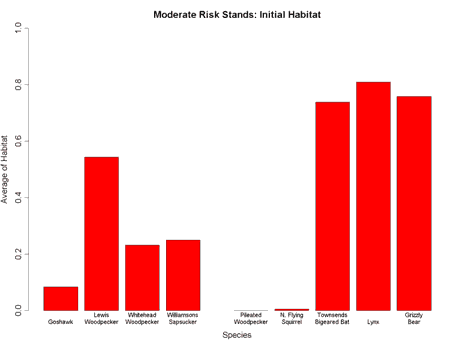 |
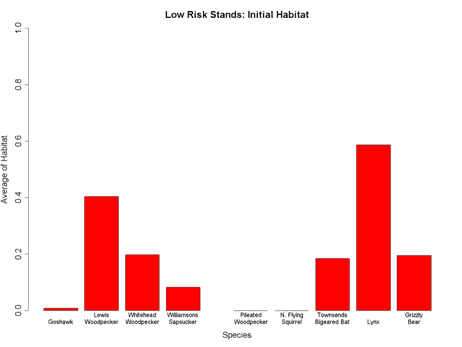 |
Okanogan - High & Moderate Risk Stands: Wildlife HSI without Regeneration
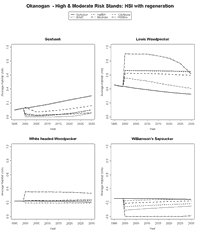
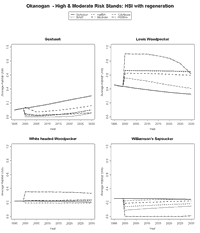
Okanogan - High & Moderate Risk Stands: Wildlife HSI with Regeneration
Okanogan - High & Moderate Risk Stands: Wildlife Source Habitat without Regeneration
Okanogan - High & Moderate Risk Stands: Wildlife Source Habitat with Regeneration
Okanogan - High & Moderate Risk Stands: Wildlife Source Habitat without Regeneration
Okanogan - High & Moderate Risk Stands: Wildlife Source Habitat with Regeneration
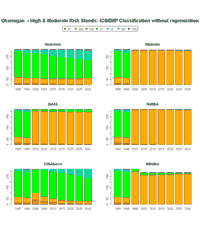
Okanogan - High & Moderate Stands: Source Habitat (ICBEMP) Classification without Regeneration
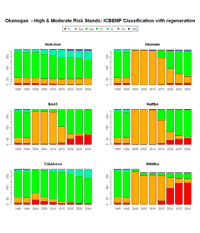
Okanogan - High & Moderate Stands: Source Habitat (ICBEMP) Classification with Regeneration
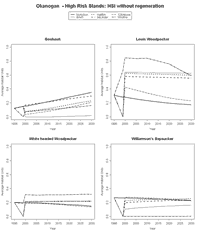
Okanogan - High Risk Stands: Wildlife HSI without Regeneration
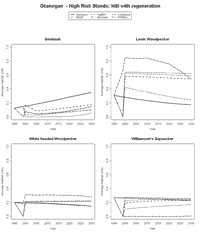
Okanogan - High Risk Stands: Wildlife HSI with Regeneration
Okanogan - High Risk Stands: Wildlife Source Habitat without Regeneration
Okanogan - High Risk Stands: Wildlife Source Habitat with Regeneration
Okanogan - High Risk Stands: Wildlife Source Habitat without Regeneration
Okanogan - High Risk Stands: Wildlife Source Habitat with Regeneration
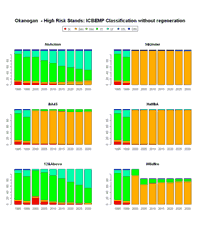
Okanogan - High Risk Stands: Source Habitat (ICBEMP) Classification without Regeneration
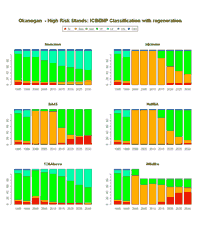
Okanogan - High Risk Stands: Source Habitat (ICBEMP) Classification with Regeneration
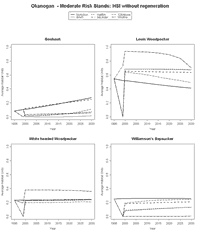
Okanogan - Moderate Risk Stands: Wildlife HSI without Regeneration
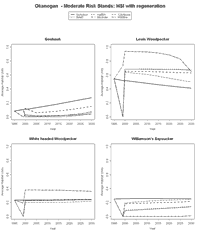
Okanogan - Moderate Risk Stands: Wildlife HSI with Regeneration
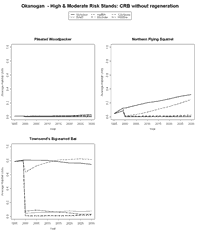
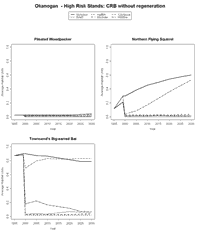
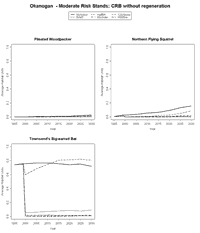
Okanogan - Moderate Risk Stands: Wildlife CRB1 without Regeneration
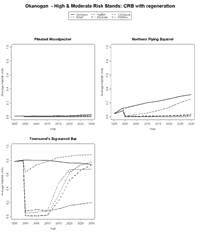
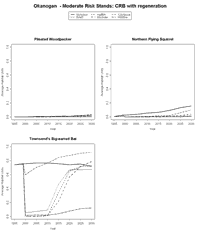
Okanogan - Moderate Risk Stands: Wildlife Source Habitat with Regeneration
Okanogan - Moderate Risk Stands: Wildlife Source Habitat without Regeneration
Okanogan - Moderate Risk Stands: Wildlife Source Habitat with Regeneration
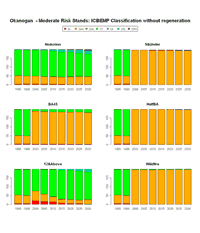
Okanogan - Moderate Risk Stands: Source Habitat (ICBEMP) Classification without Regeneration
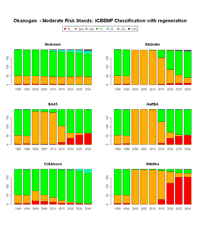
Okanogan - Moderate Risk Stands: Source Habitat (ICBEMP) Classification with Regeneration
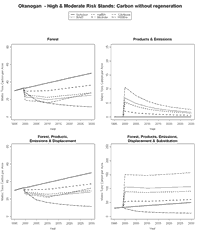
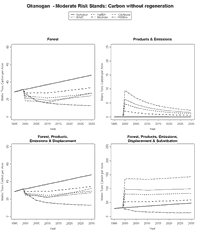
Okanogan - High & Moderate Risk Stands: Carbon without regeneration
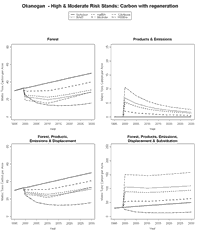
Okanogan - High & Moderate Risk Stands: Carbon with regeneration
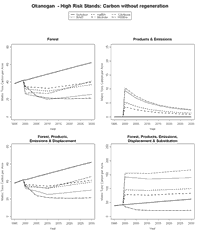
Okanogan - High Risk Stands: Carbon without regeneration
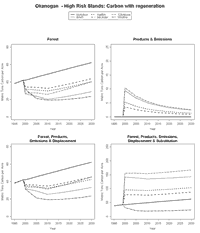
Okanogan - High Risk Stands: Carbon with regeneration
Okanogan - Moderate Risk Stands: Carbon without regeneration
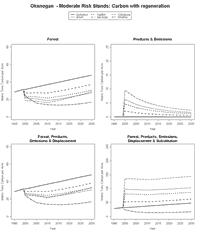
Okanogan - Moderate Risk Stands: Carbon with regeneration
APPENDIX D. WILDLIFE MODELS
LIST OF EQUATIONS AND FIGURES
| Habitat Suitability Indices (HSI) |
|
| Species Source Habitat Matrices |
Habitat Suitability Indices
(HSI)
USDI Fish and Wildlife Service
Northern Goshawk Nesting Habitat Model - Okanogan and Fremont National Forests
VARIABLE 1 (Fremont only):
Aspect (ASP) SI =
If 0 <= ASP < 90° , or 270° < ASP <= 360,
then = 1
Else = 0.5
VARIABLE 2:
Okanogan: Basal Area (BA) SI =
If BA >= 240, then = 1
If 80 <= BA < 240, then = (0.0063*BA) - 0.5
Else = 0.0
Fremont:
Basal Area (BA) SI =
If BA >= 220, then = 1
If 60 <= BA < 220, then = (0.0063*BA) - 0.375
Else = 0.0
VARIABLE 3:
Quadratic Mean Diameter (QMD) SI =
If QMD >=16, then = 1
If 4 <=QMD < 16, then = (0.0833*QMD) - 0.3333
Else = 0.0
OKANOGAN
MODEL:
HSI = (V2 x V3)1/2
FREMONT
MODEL:
HSI = (V1 x V2 x V3)1/3
Lewis' Woodpecker HSI Model (Modified† From Original USFWS Model) - Okanogan and Fremont National Forests
VARIABLE 1:
Canopy Cover (CC) SI =
If CC < 30, then = 1
If 30 <= CC < 75, then = -(0.0222*CC) + 1.6667
Else = 0.0
VARIABLE 2:
*Snag Density (SNAGS) SI =
If SNAGS >= 1, then = 1
If SNAGS < 1, then = SNAGS
* Number of snags (SNAGS) >= 12 inches dbh and >= 30 feet tall per acre
HSI
MODEL:
HSI = MIN(V1;V2)
† NOTE: The original USFWS model (Sousa 1982) included 'percent shrub cover' as a variable. LMS does not have the ability to project shrub cover over time so this variable was removed from the model. In general, percent shrub cover is inversely related to canopy cover therefore an assumption was made that a shrub cover variable was not mandatory in this model given that canopy cover is included.
White-Headed Woodpecker HSI Model - Okanogan and Fremont National Forests
VARIABLE 1:
Aspect (ASP) SI =
If 90° <= ASP <= 270° , then = 1
Else = 0.5
VARIABLE 2:
Canopy Cover (CC) SI =
If CC <= 60, then = 1
If 60 < CC < 70, then = -(0.1*CC) + 7.0
Else = 0.0
VARIABLE 3:
*Snag Density (SNAGS) SI =
If SNAGS >= 1, then = 1
If SNAGS < 1, then = SNAGS
* Number of snags (SNAGS) >= 18 inches dbh per acre; no minimum height requirement for White-headed Woodpecker.
VARIABLE 4:
**Large PIPO Density (PIPO) SI =
If PIPO >= 30, then = 1
If PIPO < 30, then = (0.0267*PIPO) + 0.2
** Number of PIPO >= 14 inches dbh per acre
VARIABLE 5:
Number of ***pine species (PINUS) present SI =
If PINUS >1, then = 1
If PINUS = 1, then = 0.7
If PINUS = 0, then = 0.2
*** Excluding PICO
HSI
MODEL:
HSI = (V1 x V2 x V3 x V43 x V5) 1/7
Williamson's Sapsucker HSI Model (Modified† From Original USFWS Model) - Okanogan and Fremont National Forests
VARIABLE 1:
Canopy Cover (CC) SI =
If 30 <= CC <= 60, then = 1
If 15 < CC < 30, then = (0.0667*CC) - 1.0
If 60 < CC < 80, then = -(0.05*CC) + 4.0
Else = 0.0
VARIABLE 2:
*Snag Density (SNAGS) SI =
If SNAGS >= 1.5, then = 1
If SNAGS < 1.5, then = 0.6667*SNAGS
* Number of "suitable soft snags" (SNAGS) >= 12 inches dbh (18 inches for PIPO) and >= 15 feet tall per acre
HSI
MODEL:
HSI = (V1 x V2) 1/2
† NOTE: The original USFWS model (Sousa 1983) included two aspen variables (percent of area composed of aspen, average DBH of overstory aspen trees). However, use of aspen for nesting is almost exclusively seen in the Rocky Mountains - with conifers being more common in the Pacific Northwest (Crockett 1975, Sousa 1983). Therefore, the aspen variables were removed from the model.
Species Source Habitat
Matrices
USDA Forest Service
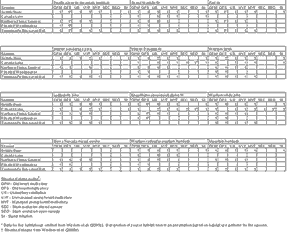
Interior Columbia Basin Ecosystem Management Project (ICBEMP)
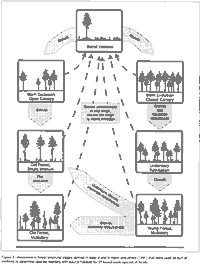
| Structural stages defined for assessing the structural features of macrovegetation across the interior Columbia basin, as adapted from Hann et al. (1997). |
| Structural stage |
Structural stage code
|
Descriptiona
|
| Stand initiation |
Si
|
LgT_cc <30% and SS_cc |
| Stem-exclusion open canopy |
Seo
|
LgT_cc<30% and SS_cc<10% and
PT_cc + SmT_cc + MedT_cc |
| Stem-exclusion closed canopy |
Sec
|
LgT_cc<30% and SS_cc<10% and PT_cc + SmT_cc + MedT_cc>70% |
| Understory reinitiation |
Ur
|
LgT_cc<30% and SS_cc |
| Managed young multi-story |
MYf
|
LgT_cc <30% and SS_cc |
| Unmanaged young multi-story |
UYf
|
LgT_cc <30% and SS_cc |
| Old multi-story |
Ofm
|
LgT_cc |
| Old single story |
Ofs
|
LgT_cc |
For assessments in this investigation, it is assumed that all young forest - multi-story stands fall into the managed young forest - multi-story classification due to past, or proposed future, management activities.

