Save
or Print a PDF copy of Fact Sheet #44
Forest residuals represent the largest unexploited source of biomass feedstock for energy in Washington 1. Understanding the accessibility of biomass feedstock becomes a critical criterion in making the new investments which will be required to reach both state and federal  energy goals. Prior studies of potential forest residual availability were based on 30 year old logging residue surveys which did not take into account substantial changes in forest management in the ensuing years. High natural variance in eastside forest conditions further complicates developing trustworthy estimates of accessible biomass. To develop better estimates of accessibility, samples of forest residuals were collected in 2008 covering a range of ownerships, management objectives, forest types, harvest methods, and silvicultural regimes in eastern Washington with the goal of deriving biomass feedstock estimators that are consistent with current harvest operations. Samples included (1) sites where forest health improvement and fire risk reduction were the focus, and (2) sites where timber values alone support the harvest. energy goals. Prior studies of potential forest residual availability were based on 30 year old logging residue surveys which did not take into account substantial changes in forest management in the ensuing years. High natural variance in eastside forest conditions further complicates developing trustworthy estimates of accessible biomass. To develop better estimates of accessibility, samples of forest residuals were collected in 2008 covering a range of ownerships, management objectives, forest types, harvest methods, and silvicultural regimes in eastern Washington with the goal of deriving biomass feedstock estimators that are consistent with current harvest operations. Samples included (1) sites where forest health improvement and fire risk reduction were the focus, and (2) sites where timber values alone support the harvest.
Field Data and Model Predictions:
Field surveys were conducted after harvest activity on federal, state and private lands, across sixty seven harvest units, six major forest types grouped into three categories (dry, moist, or wet), a range of silvicultural systems and objectives, four harvest methods, and two market conditions (high or low pulp utilization) at the time of harvest 2. These surveys measured 1969 residual biomass piles (slash piles) as well as dispersed slash summarized by diameter class. Generalized linear modeling found no significant differences between owner groups, harvest types, market conditions, and only weakly significant differences between broad forest type groupings. The best overall predictor of total and available residual biomass was harvested tonnage. Pre-harvest inventory was not a good predictor of total potential logging residue primarily because of the many different forest types and configurations of cut and leave volumes within the sample. Up to date inventory data is frequently not available, which adds another limitation to basing biomass estimators on inventory data.


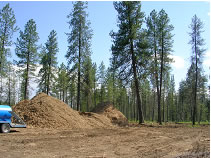
A subset of slash piles were removed and processed through a grinder to determine the actual volume and energy potential. Ground samples were scaled by weight to determine tonnage. Comparing scaled tonnage to current measurement protocols for piled slash found that there is twice as much material available as a bioenergy feedstock than was predicted from the general formulae for estimating slash pile content.
Sample data were used to generate a model of the relationship between harvest volume and logging residue identified as total residual biomass shown in our forest biomass bucket below. The bucket analogy shows the relative proportion of biomass that is found in each category. While there is some variation across forest types, merchantable log volume currently sent to  wood processing facilities is approximately 50% of the total biomass with the other 50% identified as residual biomass. Net-down factors to sustain ecological function (i.e. leaving needles, roots, branches less than 2 inches and decaying logs in the forest) reduce the total residuals by approximately 30%. This leaves 35% of the total harvested biomass as accessible biomass. Not all the accessible biomass is economically recoverable. A generalized linear model was used to calculate recoverable biomass as a function of total residual biomass size classes and locations producing a recoverable biomass estimate of 21.5% of the total harvested biomass or 43% of merchantable biomass. Accessibility declines substantially as total harvest volume declines and collection becomes more expensive. Higher biomass prices, incentives, or cost lowering technology would be required to remove the full potential of recoverable material. This recoverable biomass estimate does not include material such as stumps, smaller branches less than 5” in diameter, and 50% of the slash >5” in diameter. wood processing facilities is approximately 50% of the total biomass with the other 50% identified as residual biomass. Net-down factors to sustain ecological function (i.e. leaving needles, roots, branches less than 2 inches and decaying logs in the forest) reduce the total residuals by approximately 30%. This leaves 35% of the total harvested biomass as accessible biomass. Not all the accessible biomass is economically recoverable. A generalized linear model was used to calculate recoverable biomass as a function of total residual biomass size classes and locations producing a recoverable biomass estimate of 21.5% of the total harvested biomass or 43% of merchantable biomass. Accessibility declines substantially as total harvest volume declines and collection becomes more expensive. Higher biomass prices, incentives, or cost lowering technology would be required to remove the full potential of recoverable material. This recoverable biomass estimate does not include material such as stumps, smaller branches less than 5” in diameter, and 50% of the slash >5” in diameter.
Though eastern Washington forests and silviculture has more variability than other parts of the country, this estimate of recoverable biomass corresponds closely with reported field experience of 4 truckloads of merchantable removals to every 1 for biomass residuals 3. These recent field measurements are also very similar to those produced in a 2009 central Washington study that used equipment operator and landowner questionnaires to arrive at estimates of available supply raising the confidence in their reliability 4.
Currently only 11.4% of Inland northwest mill residuals are used as biofuel5 which is equivalent to approximately 5.7% of total biomass. This suggests that recoverable biomass is 3.8 times greater than the total biomass that is currently used as a bioenergy feedstock to power mill processes. For the Inland Northwest, if mills used an additional 37% of biomass from recoverable forest residuals they would be net carbon neutral in their energy demands. The remaining 63% of recoverable biomass could be used to produce electricity for the grid or other energy bioprocessing facilities. Energy generation for small scale facilities such as existing wood processing facilities that make full use of low-pressure steam are likely to remain a high efficiency use of biomass.
Eastern Washington Recoverable Biomass:
Applying these residual factors to the 2007 Future of Washington’s Forests Report (Study 1: Timber Supply 6) results in a predicted recovery of 19 green tons/acre for commercial harvesting operations and 27 green tons/acre for small diameter (thinning) harvests as an average across all regions, owners, and forest types based on recent and predicted harvest activity. The recoverable dry tons of residuals are estimated at 344 thousand dry tons/yr for the northeast region and 320 thousand in the Yakima region as the two largest potential supply sources for eastside biofuel processing facilities 2. Each region falls significantly short of the 625 thousand ton supply generally considered necessary for a 50 million gallon scale ethanol processing facility7. The total biomass recovered will be integrally linked to commercial harvest rate, incentives for small diameter thinnings, or substantial increases in the value of the recovered biomass as a bioenergy feedstock such as carbon values that could increase the supply and offset the costs of longer hauls. Increased federal thinnings to reduce wildfire risks may also contribute.
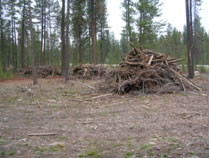
Most post-harvest forest residuals are piled and burned resulting in lost opportunity to generate clean energy, reduce fossil fuel reliance, and avoid green house gas emissions. Recoverable materials vary by owner specific management strategies, forest types and the size of material collected. The above estimates included collection of piled material and ½ the dispersed material greater than 5" in diameter. Differences between recovered material across dry, moist and wet forest types are impacted by management strategy as well as stand conditions. While volume tends to increase from dry to wet, it will be lower for more frequent entries. Wet private forests provide as much as 30 tons per acre compared to 8-13 tons on dry stands.
Removal costs:
Above 25 t/ac of total residual biomass, accessibility is constrained to 67-70% of the total residual biomass with rapidly diminishing potential for recovery in sparser stands. This means that even with maximum investment in equipment, no slope constraints, and sufficient economic incentives to conduct operations we would still not remove more than 70% of the downed biomass. While there are many differences in conditions and equipment that can make recovery difficult, collection technology improvements and efficiency gains in implementing recovery can be expected to lower costs. Under the assumptions used here, we would be able to recover approximately 43% of the residual material on most sites, and a greater percentage on sites with low slash loads, whole tree yarding, and little breakage during harvest and skidding operations.
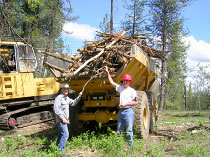
Slash piles that are a by-product of merchantable log harvesting operations require no marginal cost to create them, but there are marginal costs for in-woods hauling or aggregation and hauling to the facility. In-woods dump truck hauling to a main processing and loading landing averaged $10/ton-mile. Other collection and loading costs were estimated at $5/ton assuming some equipment technology improvements. Chipper costs were estimated at $10/ton. Road haul cost was estimated at $.22 per ton-mile. A representative total delivery cost for a facility 35 miles from the landing is about $30/ton or $60/bdt (bone dry ton). Longer hauls will be needed to boost the available supply for facilities operating at an economically viable scale.
Carbon Impacts:
Life cycle studies on solid wood products have demonstrated that log and haul emissions are small relative to the carbon emission offset that results from using manufacturing residues to produce energy that displaces fossil fuel emissions. A similar benefit is possible with the use of forest residues to displace fossil fuel emissions. However, wood biomass that can be used for structural wood products or even non-structural panel products that generally substitute for concrete, steel, glass, plastic or aluminum materials with a higher carbon footprint can have a greater carbon mitigation impact than direct fuel substitution alone. Since forest residuals are, by definition, inappropriate for these other uses, energy production will likely continue to be their highest and best use. While biofuel life cycle studies have been initiated and final results are not yet available, current best estimates of how much fossil energy will be displaced by biofuel collection and processing where efficient scale facilities are involved suggest that every dry ton of biofuel burned can displace almost 1.8 ton CO2 coal emissions or 1.1 ton CO2 natural gas8. Where higher valued products, such as wood I-joists, can be produced from merchantable logs and their use displaces steel joists of equal load bearing capacity, the displacement can be as high as 9 tons CO2 emissions displaced by 1 ton dry structural wood and bio-residuals8. In spite of the much lower leverage that biofuel has in offsetting fossil emissions than structural products, the 1.04 billion dry tons of recoverable residuals in eastern Washington could offset or displace 1.1-1.9 million tons of CO2 emissions from fossil fuel burning each year. As eastern Washington has approximately 23% of the total Washington harvest, the potential carbon mitigation from statewide use of forest residuals to offset fossil fuel use is substantial 6.
Policy Issues and Incentives:
If incentives are provided to increase the feedstock supply of woody biomass, producers will first purchase the lowest cost feedstock including mill residuals that are currently used in higher leverage products that reduce carbon emissions more than if the material was burned in place of fossil fuels. This is an unintended and counterproductive result. If the incentive is only available for the collection of the forest residuals for use as bioenergy feedstocks, there may be accountability problems on marginal low grade logs, but the net overall effect would have a positive carbon impact. If the incentive is conditional on the feedstock’s use for bioenergy, there will be increased production of bioenergy without diverting the mill residuals to lower leveraged carbon emission uses. This is a near term gain but does not allow for the development of potentially higher and better uses of the feedstock which may evolve over time as the industry and processes that use woody biomass mature.
References
1Frear, C., B. Zhao, G. Fu, M. Richardson, S. Chen, and M. Fuchs. 2005. Biomass Inventory and Bioenergy Assessment; An Evaluation of Organic Material Resources for Bioenergy Production in Washington State. Publication No. 05-07-047. Washington Department of Ecology and Washington State University. 120pp. http://www.ecy.wa.gov/pubs/0507047.pdf
2Oneil, Elaine, and Bruce Lippke. 2009. Eastern Washington Biomass Accessibility. School of Forest Resources, College of the Environment, University of Washington.
3Timothy West, 2009, personal communication, Forestry Application Specialist, John Deere.
4TSS Consultants. 2009. Wood Supply Assessment for Commercial-Scale Biomass Power Co-generation & Biomass Utilization Project in Central Washington for Tapash Sustainable Forest Collaborative & S.Central Washington RC&DC. 93 pp., http://scwrcd.org/docs/biomass_assessment_report_20090422.pdf
5Puettmann, Maureen E., Richard Bergman, Steve Hubbard, Leonard Johnson, Bruce Lippke, Elaine Oneil, and Francis G. Wagner. 2010. Cradle-to-gate life-cycle inventory of US wood products production: CORRIM Phase I and Phase II products. 1/11/2010. http://www.swst.org/wfs/prePublication.html
6Lippke, Bruce, et al 2007. Study 1: Timber Supply and Forest Structure in The Future of Washington’s Forests and Forestry Industries – Final Report, College of Forest Resources, University of Washington.
7Mason, C. Larry, et al 2009. Wood to Energy in Washington: Imperatives, Opportunities, and Obstacles to Progress. School of Forest Resources, College of the Environment, University of Washington
8CORRIM Fact Sheet 6 & 7. 2009. Product and Process Environmental Improvement Analysis for Buildings (Carbon Life Cycle Assessment). www.corrim.org/factsheets/
|