|
 |
 |
 |


Technical Report B:
A template for managing
riparian areas in dense, Douglas-fir plantations for increased biodiversity
and economics
Final Technical Report to the National Commission on Science for Sustainable Forestry (NCSSF)July 31, 2005 Kevin W. Zobrist Thomas M. Hinckley Kevin R. Gehringer Bruce R. Lippke
ContentsBack to Main Report
I. IntroductionIntensively managed plantation and naturally regenerated Douglas-fir forests in the Pacific Northwest are an important source of raw material for wood products and an important part of the economy in the region. These forests also support a number of other ecosystem services including non-timber forest products (NTFP) (Alexander et al. 2001, Freed 2001, Jones et al. 2004, Pilz and Molina 2002)1. The potential of intensively managed Douglas-fir forests to support biodiversity is also becoming of greater interest. Increased biodiversity in these stands may be supported by a number of stand-level management practices. These practices include legacy retention, repeated variable density thinnings, and long rotations, among others (for a complete review, see Zobrist and Hinckley 2005). For landowners and managers interested in managing for increased biodiversity it is useful to summarize these practices as specific, but flexible, management guidelines or “templates.” It is especially important to identify templates that can increase biodiversity with low costs to provide a greater likelihood of successful implementation on private ownerships (Latta and Montgomery 2004). Riparian areas are of particular importance when managing for biodiversity, as they are “hot spots” having a high degree of species and process diversity, and they can make significant contributions to biodiversity on a landscape (Carey and Johnson 1995, Naiman et al. 1993, 1998). Riparian management is also a prominent regulatory issue in the Pacific Northwest. Both Washington and Oregon have forest practices regulations that restrict timber harvest in riparian areas to protect endangered salmon and other aquatic resources. The goal of the regulations in Washington and Oregon is to allow the development of desired future conditions (DFC), which should mimic or equal those of complex, old forest structure in riparian areas, especially large conifers that are an important source of shade and long-term large woody debris (LWD) recruitment to streams. In the absence of active management it will likely take an undesirably long time for riparian areas in young, dense stands to achieve DFC (Carey et al. 1996, Carey et al. 1999, Chan et al. 2004). This is especially true in Washington, which requires wider buffers with significant portions where no harvesting is allowed. Both the Oregon and Washington regulations permit landowners to deviate from the regulatory prescription and pursue alternative management plans for stands that are unlikely to achieve DFC without active management. The Washington regulations further suggest that management templates be developed for riparian stands that are overly dense, which are expected to be common situations given historical management practices. Templates would provide specific guidelines to streamline the process for developing and approving alternate plans. Riparian management templates also provide an opportunity to improve economic returns for landowners by allowing additional revenue to be generated through biodiversity thinnings. Improving economic returns for private landowners is very important, as harvest restrictions in riparian buffers can result in significant economic losses (Zobrist 2003, Zobrist and Lippke 2003). If forestry is no longer economically competitive, the land may be converted to non-forest uses (Murphy et al. 2005), which can have a significant negative impact on biodiversity. Properties where a high proportion of the land is restricted by riparian zones would be at high risk for conversion, and these properties can be the most important for conservation. Management templates that accelerate the development of DFC, provide favorable economic returns, and offer simple and flexible implementation for landowners and regulators are needed. Zobrist et al. (2004, 2005) have outlined a process for developing such templates and have illustrated a sample template. This sample template has now been further refined and tested. In this report we describe the methodology for developing and refining this template, expected outcomes for both biodiversity and economics, and other potential template applications.
II. Establishing template criteriaThe first step in developing a template was to establish specific, measurable performance criteria. Performance criteria were needed relative to both biodiversity and economic outcomes. The key to managing for biodiversity is to achieve a desired stand structure, which is used as a surrogate for ecological functions, including the support of biodiversity (Franklin et al. 2002). A complex forest structure that includes vertical and horizontal diversity, a variety of species, and live and dead wood, is needed to support a diversity of species and processes (Helgerson and Bottorff 2003, Muir et al. 2002, Spies 1998; reviewed by Zobrist and Hinckley 2005). The structures present in natural, old forests provide a good management target (McComb et al. 1993). The processes of natural forest development result in high levels of diversity (Franklin et al. 2002), and produce a high degree of complexity (Franklin and Van Pelt 2004). Large conifers that characterize natural, old forests can provide key elements to support riparian structure and functions, such as shade and LWD recruitment. The regulations of both Washington and Oregon specify a forest structure similar to that of natural, mature forests as the DFC. This structure can be quantified by establishing a reference data set of stands representative of the DFC. A DFC dataset has been established using subplots from the Pacific Resource Inventory, Monitoring, and Evaluation (PRIME) database, which is part of the USDA Forest Service’s Forest Inventory and Analysis (FIA) program. To select conditions representative of mature, unmanaged, riparian stands, subplots were selected that were at least 80 years old, were within 215 feet of a stream, had not been treated since the previous FIA inventory2, and included measurements of tree heights and diameters at breast height (DBH) (Figure 1). The dataset includes a total of 184 subplots, 81 of which (44%) overlap with a similar dataset used in the development of the Washington regulations and the associated (linked) DFC concept. The structural attributes of the DFC dataset were used to create a quantitative management target. Potential management plans could then be assessed to determine whether they achieve the target, producing a structure that was statistically similar to the DFC (Gehringer in press). Three attributes were used to describe the structure of the DFC dataset: stand density in trees per acre (TPA), quadratic mean diameter (QMD), and average height computed using only trees greater than 12 inches in DBH. The distribution of values for these attributes, when considered simultaneously, established a three-dimensional target region. The target region was then refined by identifying a 90% acceptance region around the mode (the most likely value of the data distribution) to reduce the influence of the most extreme or outlying data points (Figure 2). An observed stand whose density, QMD, and average height fell simultaneously within the 90% target acceptance region would be statistically similar to the DFC dataset.
The percentage of time over a 140-year assessment period (assessed at 5-year intervals) that the stand structure for a projected management option fell within the target was established as the specific performance criterion for potential management templates. This criterion allowed the selection of template options that achieved the DFC quickly, maintained it until a regeneration harvest, and then quickly reattained it in the subsequent rotation. In addition to a DFC criterion, an economic criterion was needed. Several metrics were considered. Soil expectation value (SEV), or bare land value, is the net present value of a complete forest rotation repeated in perpetuity given a target rate of return (Klemperer 1995). This is perhaps the most important single economic criterion, as it reflects the economic performance of the initial investment in establishing a plantation given an expected management regime. This is the metric of most relevance for landowners implementing a template that starts from bare land.
SEV is also relevant for landowners starting with mid-rotation stands, as at some point they will reach the end of a rotation and be faced with the decision of whether or not to continue the template for additional rotations. Thus, SEV is the best indicator of long-term economic acceptability. However, landowners with mid-rotation stands may also be interested in the overall forest value (FV), which is also known as land and timber value (Klemperer 1995). FV includes SEV along with the net present value of the expected costs and revenues to hold the existing timber through the end of the current rotation, including the opportunity cost of using the land. In developing the template, we used SEV as the primary economic criterion but also considered FV for mid-rotation stands. In both cases, 5% was used as the target real rate of return, which is typical for financial analysis calculations. III. Simulating management alternativesWe used “biodiversity pathways” as a model for developing potential template alternatives that would enhance riparian forest structure while providing acceptable economic returns. Biodiversity pathways utilize heavy, repeated thinnings over long rotations to produce complex, old forest structure more quickly and at a lower cost than with no action (Carey and Curtis 1996, Carey et al. 1996, Carey et al. 1999, Lippke et al. 1996). Based on this approach, we defined a 100-year Douglas-fir rotation assuming site class II; a 50-year site index of 115-135 feet (King 1966). The 100-year rotation included multiple thinnings, the first of which was an early commercial thinning from below to 180 TPA at age 20. Early commercial thinnings are being utilized in lieu of pre-commercial thinnings, given new markets for small diameter wood (Talbert and Marshall 2005). Subsequent thinnings from below to 60 TPA at age 50 and to 25 TPA at age 70 were performed. A clear-cut harvest was done at age 100, followed by replanting Douglas-fir to a typical density of 435 TPA (Talbert and Marshall 2005). In order to keep the costs of riparian treatments low, the timing of these entries was chosen to correspond with upland operations, which were assumed to be done on a 50-year rotation with a commercial thin at age 20 (Table 1).
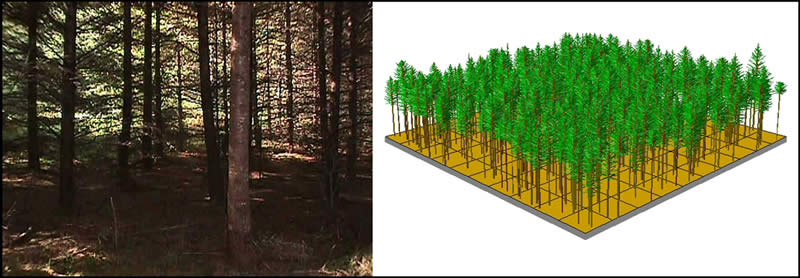
Using variations of a riparian management prescription based on this 100-year rotation, 18 potential template alternatives were generated from which to select those with the best ecological and economic performance as the basis for template development. Each alternative included a 25-foot no clear-cut zone to provide for continuous shade and bank stability. One of three prescriptions was applied in this zone: no action, no entry after the thin to 60 TPA (60-hold), or no entry after the thin to 25 TPA (25-hold). Beyond this bank stability zone, either 25-hold or the full 100-year rotation was applied. There were three total buffer widths used: 50, 80, and 113 feet. These widths corresponded to divisions between buffer zones for site class II under the Washington regulations. The total width of the riparian zone was 170 feet, and was based on the site potential tree height for site class II, pursuant to the Washington regulations. The portion of the riparian zone beyond the buffer was assumed to be managed with the upland areas (50-year rotation). Specific prescriptions for the 18 alternatives are listed in Table 2. The 18 riparian management alternatives were simulated using the Landscape Management System (LMS). LMS is a program that integrates growth, treatment, and visualization models under a single, user-friendly interface (McCarter et al. 1998). LMS includes a number of regional variants of publicly available single-tree growth models. The Stand Management Cooperative (SMC) variant of the ORGANON growth model was used to simulate the template options (Hann et al. 1997). The simulations were based on an actual inventory from a 20-year-old Douglas-fir plantation in southwest Washington that is representative of a dense plantation approaching its first commercial thinning (Figure 3). The plantation had 472 TPA and a 50-year site index of 120 feet. The simulation length was 140 years for all prescriptions. For prescriptions that included a regeneration harvest (the 100-year rotation and the 50-year upland rotation), replanting was done to 435 TPA and the rotation repeated as necessary. The simulations included only the overstory trees and did not incorporate natural ingrowth that would be expected to occur given the heavy biodiversity thinnings.
Using LMS projections, stand structure relative to the target conditions were assessed over time. Each management segment of the riparian area (the bank stability zone, remaining buffer, and the riparian area outside the buffer) was assessed independently, and a weighted average was used to obtain an assessment score. Recognizing that the portions of the riparian area closest to the stream are more critical for key riparian functions such as LWD recruitment, greater weight was given for closer proximity to the stream. To calculate the weights, potential LWD recruitment volume was simulated for the DFC dataset using a model that estimates the expected values for potentially available LWD3 (Gehringer 2005). The average percent of the cumulative potentially available LWD volume derived using the DFC dataset was then plotted by distance from the stream out to the site potential tree height of 170 feet where 100% of the potential LWD volume was included (Meleason et al. 2003) (Figure 4). The weights used for a management segment of a given width and distance from the stream were computed as the proportion of the cumulative potential LWD volume recruitment for the corresponding segment of the cumulative curve.
To assess economic performance, LMS includes an integrated economic analysis program called Economatic. An imbedded bucking algorithm is used to divide harvested trees into different log sorts based on user-defined parameters. User-defined log prices are then applied, and revenue calculations are imported into Economatic. Economatic then applies additional user-defined costs and revenues (such as planting and pre-commercial thinning costs) and calculates both SEV and FV. For our simulations, average Puget Sound region delivered log prices for 2000 were used (Log Lines 2001). Logging and hauling costs (Table 3) used values from Lippke et al. (1996) and varied by the average DBH of the harvested trees and whether the harvest was a clear-cut or thinning operation. Other cost assumptions were based on input from local foresters and landowners. The early commercial thinning at age 20 was assumed to break even, with no net cost or revenue. Planting costs were assumed to be $0.55/seedling ($239/acre for 435 TPA). Since this template was developed with smaller, non-industrial landowners in mind, relatively high annual overhead costs of $40/acre were used. For larger or industrial landowners, these costs would likely be much lower. All financial calculations were done before taxes. It should be noted that any of these assumed values can be changed in the model as they change or as landowner goals change. SEV and FV were calculated independently for each management segment of the riparian area. A weighted average was then computed based on the proportion of the riparian zone width accounted for by each management segment. Economic performance was only assessed for the 170-foot riparian area. The overall economic performance of a stand depends on the combined performance of the riparian and upland areas. However, identifying management alternatives that achieve viable economic returns for the riparian area ensures that riparian areas do not cause a loss of economic viability, even when they comprise a high proportion of a stand.
IV. Identifying preferred template alternativesThe percent time in target over a 140-year assessment period, along with SEV and FV per riparian acre, are summarized in Table 4 for the 18 potential template alternatives. The two primary template criteria, time in target and SEV, are plotted together in Figure 5 to compare the performance of each alternative. The default prescription under the Washington regulations4 and a no riparian harvest alternative are included in Table 4 and Figure 5 as reference points. For riparian templates to be implemented in Washington, the performance of the default regulatory option could be considered as a threshold for acceptance, as the Washington regulations require that all alternate riparian management plans provide riparian protection at least as well as the default prescription.5
The no harvest alternative performed the worst relative to both the DFC and economic criteria. Maintaining a dense stand with no thinning delayed the achievement of the DFC, resulting in a low time in target score. The lack of harvest revenue resulted in a net economic cost per acre, as the only cash flows were the annual overhead costs, which are assumed to apply regardless of whether a harvest occurs. This resulted in a negative SEV (-$800). The regulatory prescription only had a marginally higher time in target score than the no harvest alternative, as the regulatory prescription called for no harvest within 80 feet of the stream–this is the portion of the riparian zone which provides the majority of the potential LWD volume and has a score weight of almost 100% (Figure 4). The SEV for the regulatory prescription was negative, as there was not enough harvest revenue to achieve the 5% target rate of return.
All 18 of the potential template alternatives performed better than the regulatory prescription, as the biodiversity thinnings accelerated the development of the DFC, achieving greater time in target scores. Alternatives 1-6 had the lowest time in target scores of the 18 alternatives, as these alternatives did not include any thinning in the first 25 feet, which carries a scoring weight of 0.71 (Figure 4). Economic performance was driven by the total buffer width and whether or not a regeneration harvest was allowed in the area outside the bank stability zone. For the alternatives that did not have a regeneration harvest outside the bank stability zone (25-hold instead of 100-year), no further harvest was done after the third thinning to 25 TPA, which was assumed to preclude subsequent rotations. As with the no harvest prescription, this resulted in a negative SEV (-$800) for those segments, as the only perpetual cash flows beyond the current rotation were the annual overhead costs. The economic value of thinning the existing timber is reflected in the FV figures. A total of 12 out of the 18 potential alternatives could be considered as viable template options, having achieved both increased time in target values and the 5% target rate of return (SEV > $0). Alternatives 10, 12, 16, and 18 performed particularly well relative to both criteria. To narrow the potential template choices further, however, an additional selection criterion was needed. The economic and time in target assessments were used as a “coarse filter” analysis to identify viable alternatives, and adding an additional criterion served as a “fine filter” analysis to refine the set of viable options down to one or two preferred alternatives.
Potentially available LWD volume was chosen as a fine filter criterion. LWD provides important in-stream functions, and long-term sources of LWD are typically lacking in areas of intensive management (Bilby and Bisson 1998). Conditions that provide for a long-term source of LWD recruitment are also likely to provide for other important functions such as shade, bank stability, and organic inputs, as well as streamside habitat. The potential LWD volume was simulated for the 12 viable template alternatives using a potentially available LWD model (Gehringer 2005). The potentially available LWD volume for each alternative is plotted in Figure 6. Of the four alternatives that performed best in the coarse filter assessment, alternative 10 provided the largest level of potentially available LWD volume at the end of the 120-year simulation, with a value of 1,369 cubic feet. Alternative 11 also warranted consideration, as it provided the largest level of potentially available LWD at the end of the 120-year simulation of all of the viable alternatives, with a value of 1,761 cubic feet. While this alternative did not perform as well as others in the coarse filter assessment, it still met the minimum criteria, and its higher LWD volume made it a desirable second option.
Two preferred options emerged from the fine filter assessment: alternatives 10 and 11. Both alternatives called for the 60-hold prescription in the 25-foot bank stability zone. Alternative 10 had a wider total buffer width of 80 feet, but allowed a regeneration harvest outside the bank stability zone (100-year prescription). Alternative 11 had a narrower total buffer width of 50 feet but did not allow additional entries after the third commercial thin (25-hold prescription). These alternatives then became Option A and Option B, respectively, in a template that gives landowners a choice between two different approaches (Figure 7). Stand density targets were plotted by stand age for the two template options in Figure 7 to provide a density management diagram (Figure 8). The solid line shows the management trajectory for the 100-year rotation, with the dashed lines showing the 60-hold density floor for the bank stability zone and the 25-hold density floor for the remainder of the buffer under Option B. The specific timing and density prescriptions in Figure 8 did not allow for much operational flexibility. A density range of plus or minus 20 percent added some operational flexibility. Likewise, a 10-year thinning window of plus or minus 5 years provided some timing flexibility to coordinate with market conditions or other operations. Incorporating this flexibility into the density management diagram resulted in a template specifying desired management ranges (Figure 9).
V. Template refinement and validationThe management diagram in Figure 9 was considered to be a draft template, and we performed some additional analysis for refinement and validation. To help refine the template, density curves for crown closure, imminent competition mortality, and the maximum size-density relationship (3/2 thinning law) from Drew and Flewelling’s (1979) density management diagram for Douglas-fir were estimated by age for site class II and overlaid on the management diagram (Figure 10). These curves suggested that the upper boundary of the acceptable management region allowed too high a stand density, particularly near the time of the second thinning at age 45-55 where the upper boundary came close to the maximum size-density limit.
The template was refined by reducing the acceptable density range from plus or minus 20 percent to plus or minus 10 percent to prevent the maximum allowable stand density from becoming too extreme. The target density for the third thinning was also increased to 35 TPA, as there was concern that thinning to 25 TPA may have been too heavy. The management diagram for this refined template is illustrated in Figure 11. The shaded area, which is bordered by the imminent competition mortality curve, suggests stand conditions which are likely to respond well to the template prescription. Stands that have been growing at high densities for too long may become unstable (Wilson and Oliver 2000) or may not have the capacity produce a growth response if thinned heavily. The imminent competition mortality curve establishes a threshold beyond which additional factors, such as height/diameter ratio or live crown ratio, should be considered before applying the template prescription.
The final step in developing the template was to verify that the template produced desirable results for the full range of conditions for which it was developed. Additional simulations were run to evaluate the results of prescriptions that thinned to the upper or lower boundary of the acceptable stand density range instead of the midpoint. The differences in DFC performance and economic performance between thinning to the boundaries and thinning to the midpoints were negligible for both Option A and Option B (Figure 12). This verified that the template produces consistent results within the suggested range while meeting all critical thresholds. Simulations were also run using two additional test stands representing different starting conditions within the candidate region illustrated in Figure 11. Like the first test stand, “Test Stand 2” and “Test Stand 3” were actual inventories from Douglas-fir plantations in southwest Washington. Test Stand 2 was a 35-year-old plantation with 258 TPA of Douglas-fir, 24 TPA of red alder (Alnus rubra), 21 TPA of western redcedar (Thuja plicata), and a 50-year site index of 126 feet. Test Stand 3 was a 15-year-old plantation with 300 TPA of Douglas-fir, 25 TPA of red alder, and a 50-year site index of 135 feet. As with the original test stand, template simulations using the additional test stands resulted in significantly improved DFC and economic performance compared to the regulatory prescription, validating that the template can produce acceptable results for a range of starting conditions (Figure 13).
VI. Template applicationsThe final riparian management template described in this report provides useful guidance for landowners in Washington and Oregon who have overstocked riparian stands and wish to pursue an alternative management plan. For site class II stands with conditions that are within the candidate region illustrated in Figure 11, our analysis suggests that either of the template options could significantly increase the structural similarity to the DFC over a 140-year time period while also providing an acceptable economic return. It should be cautioned, however, that this template has not yet received regulatory approval. Landowners who wish to implement this template should work with the appropriate agencies to ensure that all regulatory requirements are met. Longer-term permits may also be needed to fully implement the template as a long-term riparian management plan. The template described in this report also serves as an important demonstration of an objective, data-driven process that can be used to develop templates for situations in which desired outcomes can be quantified. Additional templates can be developed for overstocked riparian stands on different site classes or for hardwood riparian stands. A number of upland applications also exist for templates, including their use to increase biodiversity in intensively managed plantations. It is important to recognize that no single template can provide all biodiversity needs. Rather, a range of different template options is needed for application across a landscape, as applying the same management prescription over a broad region will ultimately decrease the landscape heterogeneity, with a subsequent decrease in diversity (Bunnell and Huggard 1999). An effective template should be broadly applicable in order to be useful over a significant number of acres, while at the same time the range of appropriate template application should be limited, recognizing that one size does not fit all. Finally, a degree of template flexibility will always be necessary to accommodate site-specific needs within a regulatory context. Metric equivalents
Literature cited
1 Many of these authors suggest that
economic incentives derived from NTFP would encourage landowners
to leave their forests for
longer-rotations.
|