 |
 |
 |
 |


RTI/CORRIM Joint
Working Paper 6
Alternative Landscape Fuel Removal Scenarios: Impacts of Treatment Thinning Intensity and Implementation Schedules on Fire Hazard Reduction Effectiveness, Carbon Storage, and Economics.
Bruce Lippke
June 2006
Rural Technology Initiative (RTI), College of Forest Resources, University of Washington AcknowledgementsThis paper integrates Life Cycle Inventory and Assessment research results developed by the Consortium for Research on Renewable Industrial Materials (CORRIM) and forest simulation techniques using the Landscape Management System (LMS) developed at the University of Washington , along with simulation studies on fire hazard reduction and avoided costs by the Rural Technology Initiative (RTI) at the University. CORRIM is a consortium of 15 research institutions and has published a 1000 page report involving 23 different authors, www.corrim.com, and a 155 page journal condensation (Wood and Fiber Science Vol 37) on Life Cycle Inventories (LCI) and Life Cycle Assessment (LCA) for renewable building materials used in residential construction. The carbon relationships developed by CORRIM are linked to the Landscape Management System in order to simulate complex forest treatment and fire strategies at the landscape level. The CORRIM work has been funded by USFS Forest Products Lab, Madison Wisconsin and USFS Research, Washington DC , ten companies and 15 research institutions. The Rural Technology Initiative work and the development of the Landscape Management System have been funded by USFS State and Private Cooperative Forestry and several other USDA and EPA grants. Any opinions findings, conclusions, or recommendations expressed in this paper are those of the authors and do not necessarily reflect the views of the contributing entities. The authors are:
AbstractThe Consortium for Research on Renewable Industrial Materials (CORRIM) released a Life Cycle Inventory and Assessment study on wood demonstrating that for the Pacific Northwest, while longer forest management rotations increase the carbon stored in the forest, the corresponding reduction in carbon stored in long-lived products and displacement of fossil intensive products like steel or concrete, results in an overall reduction in carbon sequestered as rotation ages are increased. This raises interesting questions for the overly dense stands in the Inland-west that are threatened by fire, a disturbance event that is dependent upon treatment history and timing. Management treatments are shown to reduce the fire risk and store more carbon but the probability of fire and the timing of treatments must be considered in estimating total carbon storage. Prototype methods are developed to demonstrate a likely path for carbon stored by incorporating both the probability of fire and the useful life of the products produced. The probability of fire on high fire hazard stands would appear to be sufficient to justify thinning treatments while also contributing to carbon storage so long as a substantial portion of the product is allocated to long-lived uses like housing construction. Keywords: carbon emissions, fire risk, fire hazard, LCI, LCA, fuel removal Table of ContentsList of Figures
List of Tables
IntroductionThere is high interest in forest management treatments that can reduce the frequency and intensity of the abnormally hot and devastating fires that have been experienced in the inland west in recent years (Western Governors Association 2001 and 2002). Natural resource management policies are also increasingly being considered in the context of climate change. Fires release carbon stored in forests to the atmosphere, while treatments remove and store carbon in the form of products and potentially reduce fire hazard. Recent developments in both forest fire simulation models and carbon life-cycle analysis models are contributing to an improved understanding of the relationship between fuel reduction treatment effectiveness and fire intensity at the stand scale, as well as the consequences for carbon release and storage. This study develops a prototype methodology to evaluate alternative fuel reduction strategies relative to changes in fire hazard, carbon, and economic impacts at the large landscape scale.
BackgroundFire Simulation ModelingThe development of the Fire and Fuels Extension (FFE) model (Beukema et al. 1997, Scott and Reinhardt 2001) as a link to the Forest Vegetation Simulator (FVS) model (Crookston 1990, Dixon 2003) provided a significant advancement in stand level fire simulation analysis. FFE predicts fire hazard, behavior, and mortality within a forest stand based on tree inventory and fuel and weather characteristics. In fire science terminology, this modeling system allows FFE to predict first-order fire effects and FVS to predict vegetation (and fuel) change through time. Many analysis modules have been developed based on FVS tree-lists, such as habitat suitability models, economics, and carbon such that many ecological attributes can be analyzed in conjunction with treatments to reduce fire hazard. Mason et al. (2003) used these models to investigate the relative benefits of fuel reduction activities by simulating management treatments with a wide range of thinning intensities (including no action) on a large number of forest types in the Okanogan and Fremont National Forests . Results were analyzed for fire hazard reduction effectiveness, the cost of the treatment, and the effects on selected environmental metrics. Many non-market values and downstream avoided costs were identified that more than offset the potential costs of treatments. Increased carbon storage is one of those benefits that will likely become more important as efforts increase to reduce greenhouse gas emissions. While Mason et al. (2003) evaluated the effectiveness of alternative treatment intensities, all treatments were simulated in the initial year without considering the length of time it would take to phase in and complete a treatment program. Wildfire was also evaluated as a treatment for impact comparison to mechanical treatments designed to reduce fuel loads and fire hazard. This allows the direct comparison of fire and thinning treatments, and when coupled with predicted rates of fire that are dependent upon fire risk and the timing of mechanical treatments provides simulations to evaluate the impact of a practical implementation schedule of treatments over time for a large scale landscape. Models have been developed to simulate fires, including the fire behavior and growth simulator FARSITE (Finney, 2004) and vegetation change models such as LANDSUM (Keane et al. 1997), SIMPPLLE (Chew 1995), and VDDT ( ESSA Technologies Ltd. 2005). However, a limitation for FARSITE, especially at large scales, is the need for detailed and spatially explicit information. The vegetation change models require large amounts of user defined data input, including vegetation change pathways, without a close relationship to supporting models such as FVS (Barrett, 2001). For this study, FVS was used to project tree-lists which in turn were used to evaluate economics, habitat, and carbon accounting based on new research in carbon life-cycle analysis and to provide inputs to FFE for a fire hazard analysis. Carbon Life-Cycle Analysis ModelingThe Consortium for Research on Renewable Industrial Materials (CORRIM), has recently released reports covering the full life cycle assessment of the environmental performance of using wood products in residential construction (Bowyer et. al. 2004, Lippke et. al. 2004, Wood and Fiber Science special issue 2005). Included in this research is accounting for four major carbon pools: 1) carbon in the forest; 2) carbon in products that leave the forest; 3) carbon associated with the use of forest biomass and product residuals as an energy source; and 4) the carbon offsets from the substitution that occurs when wood building materials displace products like steel or concrete, which are fossil fuel intensive in their manufacture and subsequently contribute to release of green house gases such as CO2. A major finding in the CORRIM report is that forests, that are periodically harvested, planted, and regrown to produce a continuing series of short- and long-lived products and energy feedstocks, sequester and offset more cumulative carbon than forests that are left unharvested. This finding is illustrated by the graphs that depict carbon accounting associated with a managed forest shown in Figure 1 (Lippke et al 2004), and an unmanaged forest in Figure 2. Figure 1 characterizes the time dynamic nature of carbon storage for a 45-year commercial rotation in Western Washington as a cumulative sequence of carbon in the forest, in products, and the impact of the product in substituting for non-wood products. Figure 2 shows the accumulation over time of carbon for the same beginning forest inventory, but with no treatments, no disturbances such as wildfire, and no products and hence no substitution for fossil intensive products or fuels.
While the carbon in the forest in Figure 1 is shown to cycle with each rotation around a steady state trend line, the carbon in product pools net of energy used in harvesting, processing and construction, increases slowly over time. When the carbon emissions from the displacement of fossil fuels by wood residuals used for energy generation and the displacement of fossil fuel intensive building products (like steel and concrete) are included, there is a substantial trend increase in total carbon that can be seen to surpass the cumulative carbon storage in forest biomass when there is no harvest activity - as displayed in Figure 2. The CORRIM analysis provides a method for tracking the carbon through all important carbon pools but does not consider forest disturbances such as fire. When considered in the context of Inland West forest conditions, the findings in the CORRIM report for the Northwest raise interesting questions about the impact on carbon emissions resulting from intense forest fires as a consequence of failure to remove excessive fuel loads. Fires reduce the opportunity to produce long-lived products while creating regeneration challenges that may result in a loss of forest productivity for extended periods of time. Forest fires also release large volumes of carbon into the atmosphere. Study ObjectivesThis study addresses limitations in both the CORRIM analysis (Bowyer et al. 2004) and the research by Mason et al. (2003) by incorporating fire disturbance into treatment regimes and carbon predictions. First, a disturbance model to predict the frequency of fires was developed based upon the fire history of the selected National Forest. The disturbance model included the ability to calibrate the rate of new fires with the FVS-FFE predictions of fire hazard. The results are intended as a demonstration of a prototype methodology, with some simplifying assumptions used to enhance the tutorial value. After developing the disturbance model, the impacts of treatments are evaluated based on the treatments developed by Mason et al. (2003) for the Okanogan National Forest . Landscape management alternatives are developed to: 1) compare mechanical treatments intensities that reduce the fire hazard; 2) consider the consequences of immediate verses delayed treatments; and 3) include the probability of fire effects through time on forests that have a high and moderate hazard of crown fire as dependent upon growth and treatment history. The resulting carbon storage, the risk of fire spread and the magnitude of the forest fire hazard depends upon a combination of factors including the mechanical treatments, the length of time it takes to implement the treatments and the changing probability and intensity of fire as a result of fuels reduction treatments or fires and fuel additions from treatments and growth.
MethodologyTo develop landscape management alternatives, a non-spatial, forest stratum-based, area allocation model was developed to take advantage of the FFE and carbon life-cycle analysis models recently developed for FVS and the Landscape Management System (LMS). Alternative treatment pathways were simulated for each forest strata, with tree list inventories representing vegetation conditions at each point in time. A fire disturbance (rate of burn) model was developed and incorporated into the area allocation model where the probability of fire in any given period is dependent upon the fire hazard classification of the forest vegetation which in turn depends upon treatments. LMS with FVS-FFE was used to simulate growth, treatments, fire, and produce per acre output metrics including acres burned, economics, carbon stored and other ecological metrics. Simulation Data and ModelsThe Landscape Management System (LMS) (McCarter et. al. 1998) was used to simulate the impact of various treatment alternatives within the Okanogan National Forest (ONS) in Washington State . LMS is a detailed forestry software program that manages tree list data subject to harvest and growth simulations over time and is equipped with analysis modules for quantifying biomass, log quality and product outputs, stand structure impacting fire hazard and habitat, carbon and other environmental and economic metrics. LMS has been designed to use any of a variety of growth models including the Forest Vegetation Simulator (FVS) created by the USDA Forest Service. FVS is an individual-tree, distance-independent growth and yield model (Crookston 1990, Dixon 2003). FVS can be used to simulate silviculture treatments along with growth and yield for most major forest tree species, forest types, and stand conditions. Variants of FVS provide growth and yield models for specific geographic areas of the United States . For this investigation, the East Cascades Variant of FVS was selected for use with ONF forest inventory data. The Fire and Fuels Extension to the Forest Vegetation Simulator (FFE-FVS) links existing FVS models which represent fire and fire-effects, with newly developed fuels dynamics and crowning submodels (Beukema et al. 1997, Scott and Reinhardt 2001). The Fire and Fuels Extension (FFE) has been developed to assess hazard, behavior, and impact of fire in forest ecosystems (Reinhardt and Crookston 2003). FFE can produce reports of changes in various indices of potential fire severity as a result of alterations to stand characteristics resulting from simulated management alternatives.
Forest inventory data were assembled from the Continuous Vegetation Survey (CVS) with 413 plots for the Okanogan National Forest (ONF) found to be suitable for the analysis. To expand per acre volumes from CVS data for landscape inventory estimates, an expansion factor of 1849.6 was used, based on the 1.7 mile grid used to systematically distribute CVS sampling point locations across 763,885 total acres. Data for the ONF was collected during the period from 1994 to 1996. A base year of 1995 was selected as the start point. The 1995 data were "grown" forward within FVS for one growth period of five years to 2000 to bring data close to present time before treatment simulations were conducted. All plots were analyzed for stand structure characteristics and relative fire hazard (Hardy 2005). A high, moderate, or low fire hazard classification was assigned for each CVS plot in the simulation dataset based on the Severe Crowning Index assessment from the Potential Fire Report produced by FFE. The Crowning Index indicates the estimated wind speed in miles per hour (mph) at 20 feet off the ground that would initiate an active crown fire assuming ignition of surface fuels. Assumptions required by the model include a temperature of 70 degrees Fahrenheit and 'very dry' moisture conditions (Crookston et al. 2002). If the crowning index was less than or equal to 25 mph, then the plot was considered to be in the high fire hazard category. Moderate hazard stands were those with a Severe Crowning Index greater than 25 mph, but less than or equal to 50 mph. Low fire hazard stands were those with a crowning index greater than 50 mph (See Table 1 below). Very young or clearcut stands function outside of the range of the model and subsequently record Severe Crowning Indices less than zero. To accommodate this model behavior, stands with a crowning index below zero are classed as low hazard. While relative fire hazard is actually a continuous function rather than discrete classes, there are tutorial benefits of transparency in effects when observing the transitions from one hazard class to another.
Forest Stratification and Representative StandsTo simplify the analysis for a prototype demonstration of the methodology, one plot from each fire hazard classification group with attributes closest to the classification average was selected with the number of acres set proportional to the number of plots in each hazard class multiplied by the expansion factor (minor table error is from expansion factor rounding). The acres, plots and expansion factors are provided by hazard group in Table 2.
Treatment Thinning IntensitiesA range of mechanical treatment intensities were selected that have been developed in previous studies (Mason et al. 2003, Fielder et al. 2001) to provide an opportunity for broadest utility and research continuity. Treatments evaluated were:
Treatment Implementation SchedulesTo evaluate the effect of timing, a set of simulations was developed for the 12&Over, 9&Under, and BA45 treatments. The expanded simulation set included management pathways with the treatments allocated equally to each 5 year interval from 2000 to 2020. This set resulted in 3 treatments intensities with 5 treatment schedules; (15 simulations in total) as illustrated for a generic treatment in Table 3.
Next, a set of simulations accounting for the timing of fire was developed for each treatment set. For each management pathway, a set of potential disturbance pathways was developed with the fire event occurring in each 5-year modeling interval from 2000 to 2050. This is illustrated for a generic treatment set in Table 4. However, if the inventory was classified as Low fire hazard in the period when a fire was to occur, the fire event did not occur. The total number of potential treatment simulations developed was: 3 treatments intensities with 5 treatment schedules with 11 fire events (165 simulations). In addition, 11 No Action Treatment simulations with fire events were modeled. To reduce simulation time, only two fires events were simulated: the High hazard group and Moderate hazard group representative inventories in 2000. Post fire inventories were then simulated with no action until 2050. When fire events occurred in a pathway, post fire values were based on one of these two simulations rather than updating the inventory each period. While this is a compromise in fire predictions for a specific year, because fire hazard classification was still based on actual inventories that change relatively slowly, this post-fire simplification was considered acceptable for demonstration of landscape level trends. The full set of simulations completed for each representative inventory determined the 176 potential management and fire disturbance pathways for the high, moderate, and low fire hazard groups. An area allocation model was then used to develop management scenarios for the Okanogan National Forest . The percentage of group acres following a particular treatment pathway was controlled directly; however, the percentage of those acres following a particular fire disturbance pathway was controlled by a fire probability model described below. Acres that burned before a scheduled treatment were not mechanically treated.
Fire Probability ModelA deterministic fire disturbance model was created based on the portion of landscape susceptible to burn defined by the same fire hazard classification used to stratify the initial Okanogan National Forest inventory. A user-defined percentage of area in each class was burned for each time period, resulting in assignment of acres from the original treatment pathway to the appropriate treatment with disturbance pathway. Treatment pathways reduced the frequency of fires by moving stands out of higher hazard classes. The model allows separate burn rates to be set each period for each hazard classification. The model was calibrated for cumulative acres burned over the entire simulation time period and for acres burned during each 5-year simulation cycle based upon investigations of refugia thought to have resulted from pre-settlement fire behavior. Camp and others (1996), in an investigation of historic fire behavior in the Wenatchee National Forest, found evidence to suggest that, prior to European settlement, most of the forest burned regularly in short fire return intervals with the exception of scattered pockets of refugia primarily located in moist areas such as north facing slopes and riparian zones. Study results estimated that unburned pre-settlement refugia accounted for approximately 12% of the study area and less than 20% of the broader landscape. Olson (2000) found that in areas of Oregon 's Blue Mountains and Cascades that there was little if any refugia that remained fire free prior to European settlement including riparian areas. While predicting the timing and intensity of fire ignitions is problematic, Camp and others suggested that present risks and hazards of ignition and crown fire in overstocked forests are reasonably much higher than that of pre-settlement conditions. Subsequently, in many forests that have grown over the last century into homogenous densely stocked landscapes with high hazard fuel loads and no fuel breaks, intense crown fires will likely burn through entire areas, some of which may have previously been refugia. However, for this study, a target of 18% fire-free refugia was chosen to be retained across the high fire hazard landscape as a credibly conservative target for areas that might remain unburned during a 50-year simulation period. Refugia were defined for those acres classified as High hazard initially. The remaining 82% was "burned" based on an equal probability distribution of fires in the high fire hazard forest acres during each 5-year simulation cycle. To demonstrate a relationship between hazard severity and fire frequency, the Moderate hazard group was assumed to be approximately half as likely to burn as the High hazard group, and Low hazard stands would be unlikely to burn (0% probability) as long as they remained in that hazard class. Through trial and error, a 14% periodic burn probability for the High hazard group reduced the refugia to about 18% by 2050. For the entire Okanogan National Forest , since the burn rate for the Moderate hazard was only half that of the High group and the Low group did not burn, the number of unburned acres by 2050 was still much higher than the 18% refugia target. This is illustrated in Figure 3. These periodic burn probabilities were applied to each landscape scenario. To simplify this demonstration, the potential impacts of forest fires in previously burned forests were ignored by assuming that, once burned, an area does not reburn before the end of the investigation period, even in cases where the simulated hazard class returns to High and Moderate conditions.
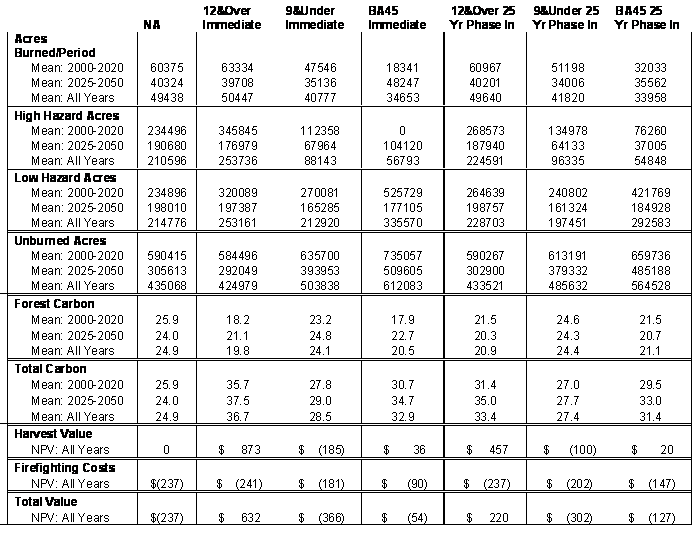
Landscape ScenariosIn addition to the immediate treatment schedule including fire an additional set of treatment scenarios were phased in over 25 years to demonstrate the comparative impacts of a designed thinning treatment schedule. In the first landscape simulation set, all High and Moderate fire hazard acres were treated with 12&Over, 9&Under, and BA45, and all treatments occurred in 2000. These landscape scenarios were titled '12&Over Immediate', '9&Under Immediate', and 'BA45 Immediate'. A No Action treatment was also included. In the second set, the 25-year phase-in of treatments was demonstrated with 20% of the High and Moderate hazard acres available in each 5-year interval treated during the 5 modeling cycles from 2000 to 2020. These landscape scenarios were titled '12&Over 25 Yr Phase-In', '9&Under 25 Yr Phase-In', and 'BA45 25 Yr Phase-In' . For all treatment scenarios, only acres in the High or Moderate hazard group in 2000 were considered for mechanical treatment during the 25-year phase-in, however, all acres were subject to burning with the burn rate dependent upon hazard class. For all seven landscape scenarios, all acres (treated, untreated, burned, unburned) were simulated in 5-year growth cycles to the end of the investigation period at 2050. Assessment of Fire Hazard, Carbon, and EconomicsFire hazard, carbon, and economic management outcomes were analyzed at the end of each 5-year model interval for each landscape scenario. To evaluate fire hazard reduction effectiveness the number of acres burned, the number of low hazard acres and number of unburned acres were calculated. Results were based on the fire hazard classification evaluation developed from the Fire & Fuels Extension (FFE) to FVS as described and illustrated in Table 1. A life cycle assessment of environmental burdens developed by the Consortium for Research on Renewable Industrial Materials (CORRIM) serves as an accounting system for the carbon consequences of forest management alternatives (Manriquez, 2002, Perez-Garcia et al 2005). Estimates of changes in the amount of carbon stored over time in the standing forest are calculated using biomass to carbon conversion factors specified by species for tree bole, bark, foliage, limbs, and roots. Any material harvested is exported to product manufacturing or left to decompose, a carbon loss. Estimates of carbon stored in each type of harvested wood products are also calculated with short-lived products such as chips for paper subject to fairly rapid decomposition. Estimates of carbon emitted to the atmosphere from harvesting and manufacturing operations are considered as reductions to carbon stored in wood products. Estimated as well is the amount of carbon not emitted by the reduction in fossil fuel energy generation by wood used in a wood boiler for heat and energy; a partial offset to the total processing energy used in manufacturing, and the substitution of wood for concrete frame as the prevailing non-wood construction material. The model is implemented in Microsoft Excel and designed to work in tandem with LMS, allowing a comprehensive estimate of forest carbon storage, substitution, and displacement over time for different management alternatives. This carbon assessment process is based on studies of wood biomass (Gholz, 1979), carbon content (Birdsay, 1992), decomposition (Harmon, 1993), product utilization harvesting and manufacturing (Bowyer et al, 2004), purchased energy emissions (Franklin Associates, 1998), biofuel use (Bowyer et al, 2004), and construction material substitution (Bowyer et al, 2004). Changes in forest biomass from growth (simulated with FVS) and decomposition are simulated and converted to stored carbon pool estimates. Carbon amounts are moved from the forest to the products pool following a silvicultural operation, simulated in LMS. The model calculates log utilization to determine amounts of short-term and long-term products. These products are either decomposed through time or used for biofuel (short-term) or product substitution (long-term). Emissions from harvesting and manufacturing are determined from the types of silvicultural treatments performed and the amount of harvest volume removed and processed. Estimated cumulative carbon storage and offset for each treatment simulation routine were analyzed using the CORRIM carbon accounting model as described above. Three broad categories of carbon are used to characterize impacts: forest, products, and substitution. Products carbon is calculated as net of all carbon releases associated with harvesting and processing activities. The biofuel resource generated from product manufacturing residuals such as, bark, sawdust, planer shavings, etc. that is burned by mills for energy is modeled as a non-fossil energy resource offsetting some of the carbon emissions generated from the fossil energy sources otherwise used in manufacturing. The biomass for bioenergy reduces the carbon in the forest but offsets much of the fossil fuel energy and related carbon emissions that would otherwise need to be purchased for harvesting and product manufacture. The long-lived product volumes such as lumber and panels displace non-wood products such as steel and concrete which are more energy intensive in manufacture. For this study, total carbon (forest, products, and substitution) are presented in Table 6 with more detail provided in the Appendix Table 1. Table 6 summarizes the impact for each scenario on total carbon, acres burned, harvest revenue and costs. An economic analysis was provided for treatment costs, and firefighting costs. An average net return or cost per acre was calculated for each thinning treatment based upon harvest economic results generated in a previous study of the Okanogan National Forest by Mason et al. (2003). These values are provided in Table 5. Total present value of revenues and costs associated with fuels reduction treatments for each treatment intensity expanded to reflect landscape outcomes was calculated by multiplying the per acre values for corresponding treatments by the number of acres treated in each time interval. All revenues and costs were then discounted back to the start year to generate a net present value (NPV) estimate for each series of treatments (see Table 6).
Averages of historic fire fighting costs can be used to estimate the future benefit of lowering fire hazard through fuel reduction activities. While precise assessments are impossible, approximations of the value trade-offs associated with investments today to avoid future hazards are useful. Plots thinned to remove fuel loads have been shown to be unlikely to experience crown fires (Omi and Martinson 2002). Accounting for the value of that reduced hazard exposure must take into consideration both the consequences of not thinning and the reduction in cost by thinning adjusted for the time value of money. The savings of future fire-fighting costs must be discounted to an expected present value based upon either a reasonable estimated time to fire or based upon a distributed fire event probability such as provided by the above simulation. For this investigation, firefighting costs were estimated to be $1000 per acre; reflecting the approximate average fire fighting costs for the ONF for the last decade. It is worth noting that the comparable cost for non-federal fire fighting costs in Washington (WADNR 2004) is over $2000 per acre largely due to the greater number of large fires on federal acres with less intensive suppression activities. The landscape cost was determined by multiplying the number of acres burned each period by the firefighting cost. A 5% discount rate was used to convert all future anticipated fire fighting cost liability exposures to present value dollars (see Table 6). ResultsPost treatment results are provided in Table 6 for acres burned and unburned, acres categorized by hazard class, carbon, and economics. Forest carbon and total carbon values (with products and substitution) are provided in million metric tons for the Okanogan National Forest . Economic results are provided for the net present value of treatments for each landscape scenario (Harvest Value NPV), the net present value of firefighting costs for each landscape scenario (Firefighting NPV), and total net present value (Harvest Value NPV + Firefighting NPV). All NPV values are provided in million dollars using a 5% discount rate. Results are provided for both an "Immediate" treatment and a "25 Yr Phase-In" and segmented between the first half of the simulation and last half to demonstrate the sensitivity to regrowth after initial treatments. A more complete set of tables and graphs are provided in the Appendix.
DiscussionFire Disturbance Model and Area Allocation Model CritiqueThe simple fire disturbance model assumes that fire frequency is based on the abundance of high and moderate hazard acres. At the landscape scale, this parallels the recognized historical trend in interior western ecosystems: As the number of high hazard acres has increased, wildfire magnitude and intensity have increased also. At more site-specific scales, this assumption oversimplifies the complex nature of forest fire events. Directing treatments at certain terrain and fire breaks may have a greater impact in reducing fire hazard than the simulations suggest. Results are therefore most appropriate for comparing relative differences between management alternatives at the landscape scale, than examining absolute impacts of a chosen management regime. For simplification purposes, fire events were limited by the number of times an acre could burn. Both the characteristics of a second burn and the probability of such a burn are different than a first burn in many years. Predicting the rate that ladder fuels are restored through regrowth is difficult. Because reburns are realistic within the analysis period (55 years), the assumption of no reburns most probably biases the burn rate down for later time periods. Since growth rates are relatively slow in interior forests; reburned acres would likely contain lower amounts of carbon, so the reburn assumption should have relatively little impact on carbon results within the analysis period. To further isolate this assumption, results were provided for three time periods: 2000-2020, 2025-2050, and the entire analysis period. An advantage of the area allocation with fire disturbance model was the ability to use FVS and FFE to predict forest vegetation growth, treatment impacts, and fire impacts, and any of the tree list analyses developed for LMS to predict other results such as carbon. Other landscape fire and vegetation simulations models such as VDDT, LANDSUM, and SIMPPLLE require more initial input by the user, such as defining successional pathways, without supporting models such as FVS and LMS (Barrett 2001). Basing landscape results on FVS and LMS also creates consistency between multiple modeling and planning scales, as FVS and LMS are designed to support site-specific, individual stand management decisions. Finally, after comprehending the fire disturbance model, landscape results should be relatively easy to understand, with results based on area scaling of per acre values.
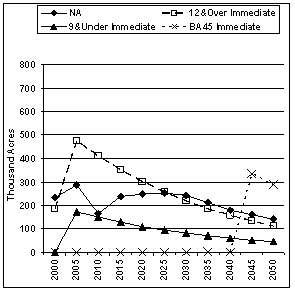
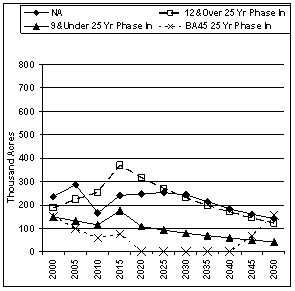
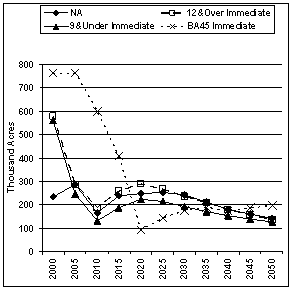
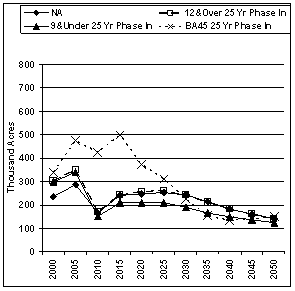
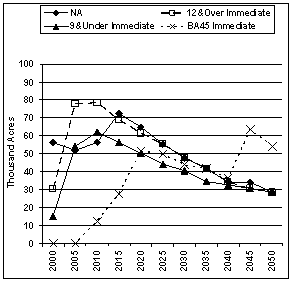
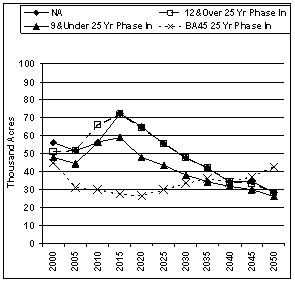
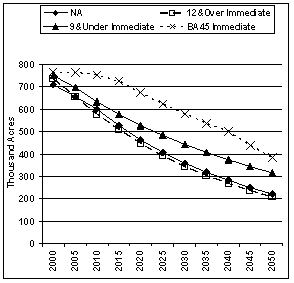
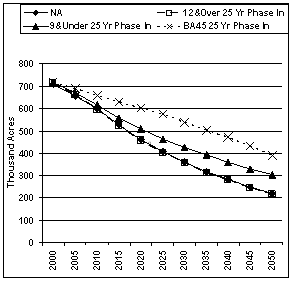
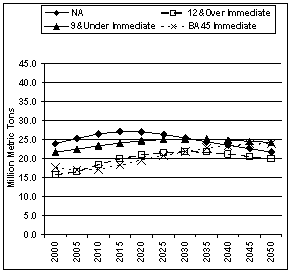
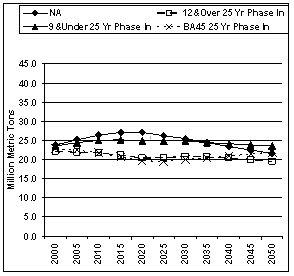
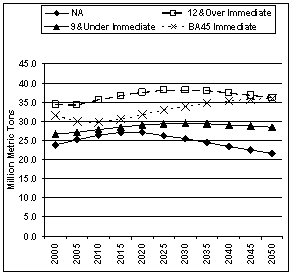
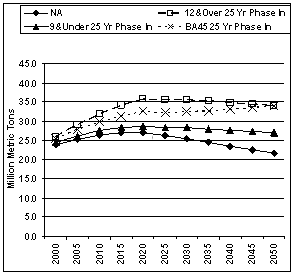
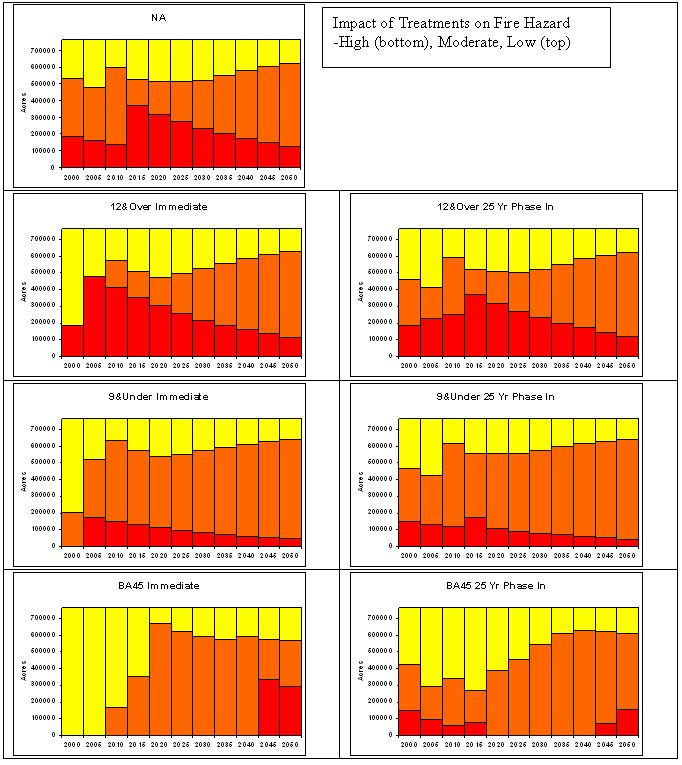
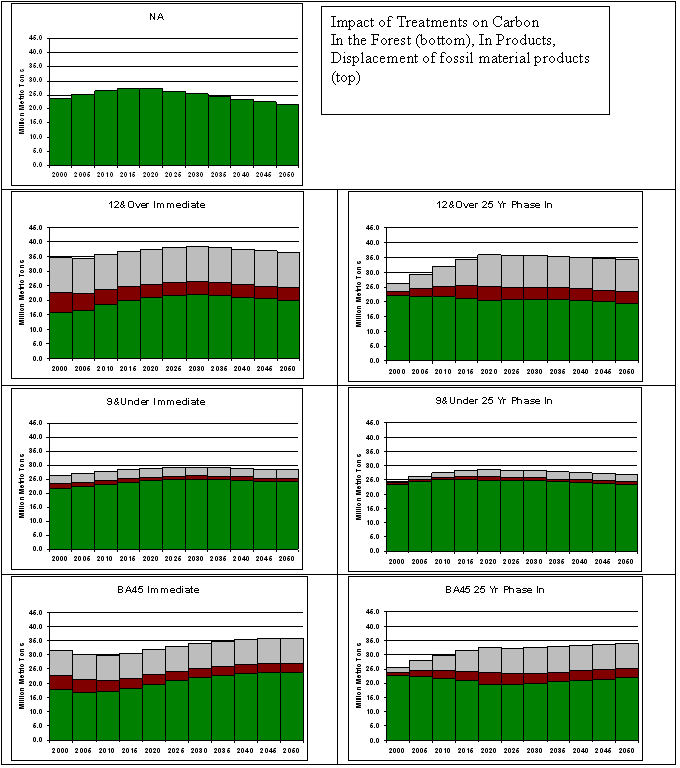
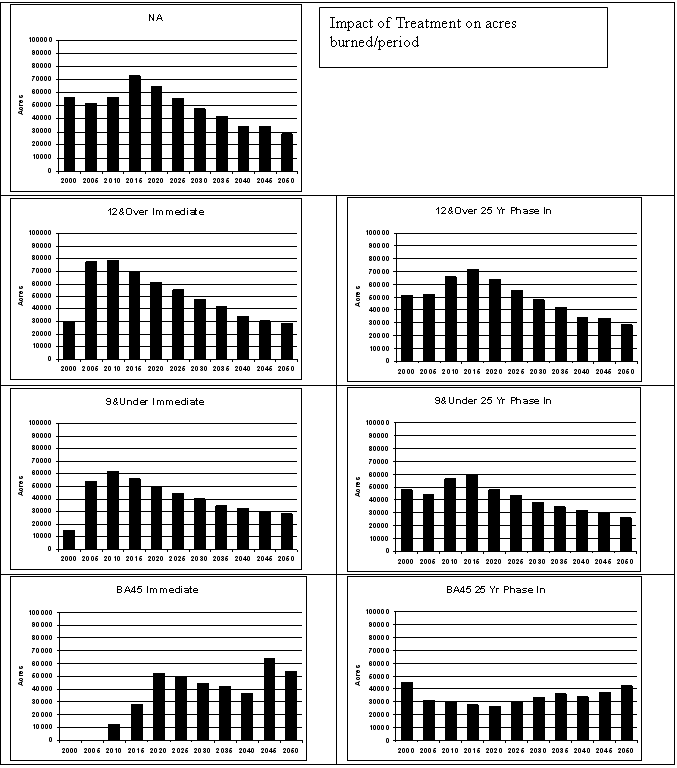
Fire Hazard ReductionThe effectiveness of treatments in reducing the number of high hazard acres and raising the number of low hazard acres (reducing fire risk) compared to No Action is shown in figures 4 & 5. The BA 45 treatment eliminates high hazard acres for almost 45 years but regrowth after treatment eventually moves these acres back into high hazard status. Likewise, those acres initially categorized as low hazard, quickly move into moderate and high hazard categories as a result of stand growth. . After 20 years the hazard begins to move into a moderate category unless a second round of mechanical treatments or controlled burns are implemented. Neither the 9&Under or the 12&Over treatment reduce the ladder fuels significantly so the reduction in high hazard acres and decrease in low hazard acres is relatively short lived. While the 9&Under treatment does move some acres from a High to Moderate classification and some from Moderate to Low this transition is transient as the initial Low Hazard acres move into the Moderate class. The transition to moderate and high classification takes longer for the BA45 treatment because it removes more fuels and greatly reduces ladder fuels. The 12&Over treatment retained most ladder fuels as well as adding some downed material which increased fire risk and minimized the transition to lower hazard classification even though the character of fire would be changed. The No Action alternative results in a steady rate of fires and new burned acres that maintains 25-30% of the acres in the low hazard category much like the initial condition. With the more feasible 25 Yr Phase-In period the share of acres in the Low Hazard class after a BA45 treatment increases by about 80% over the alternatives but restoration of hazardous undergrowth reduces the benefit in about a 25 year interval. Some Low Hazard acres are maintained even under the No Action alternative as a direct result of fires reducing the number of High and Moderate hazard acres. If all at risk acres could be treated with BA 45 immediately, Figure 6 shows that the acres burned each period would fall to low levels for 20 years but without continued treatments be no better than the other alternatives after 25 years. However for the 25Yr Phase-in the rate of burn is cut almost in half from 60,000 acres per year to 32,000 per year. The increase in acres burned in 15 years under the No Action alternative is a response to the decline in the Low hazard acres as many stands moved to a higher hazard class as did our characteristic stand for this class. As a caveat, fire hazard trends would likely be more gradual and slower to transition. Using a continuous fire hazard function rather than discrete hazard categories and greater resolution in grouping would capture more variation and smooth out the transitions. Some initially Low hazard acres may also be at the forest-range interface. These marginal forests might not be expected to ever grow into the Moderate hazard class due to very limited growing space and grazing. However, forests that have unprecedented fuel loads, more homogenous fuel load distributions than patchy pre-European forests, and are decades outside of historic fire return cycles are likely to burn larger acreages with intense fires sooner rather than later (Hessburg et al. 2005). During later periods, the number of acres that burn steadily decline as many of the High and Moderate hazard acres have experienced fire simulations by this time. By applying the assumption that reburns do not occur during the simulation interval the number of eligible acres is reduced. Reburns could occur within the 55 year analysis period and could be expected given the drop in low hazard acres as shown in Figure 5. The scenarios with immediate treatment schedules resulted in a range of fire hazard reduction effectiveness compared to NA. The BA 45 Immediate scenario is most effective from 2000 to 2020 with a 70% decrease in the mean number of acres burned, a 124% increase in mean number of low hazard acres, and a 24% increase in mean number of unburned acres. However, the BA45 Immediate treatment results in understory regrowth that causes many acres to return to Moderate and High hazard classes over time, again suggesting the need for future fuel reduction treatments or controlled burns. If forests are thinned heavily from below to remove ladder fuels, and understory regrowth is periodically burned or otherwise removed, stands are more likely to grow into more sustainable savanna conditions. These stands would be characterized by sparse densities of large overstory conifers with high crown bulk density, and be more resistant to fire ( Everett , 2005). CarbonThe carbon estimates for the NA simulation Figure 8 show increasing carbon in the forest until 2015 and coincident with increased fires, decreasing carbon during the latter time periods (2015-2050). Nearly 5 million metric tons of carbon is released into the atmosphere during the analysis period due to forest fire events. The influence of high mortality disturbance events such as forest fires results in very different carbon estimates for NA scenarios when compared to the no action/no disturbance west side example shown earlier (Figure 2). All treatment scenarios remove carbon from the forest, resulting in lower mean carbon in the forest during the early periods (2000 - 2020). However, the BA45 and 9&Under scenarios resulted in more carbon in the forest by 2050. Differences in forest carbon between scenarios can primarily be attributed to fire hazard reduction effectiveness which decreases the number of fire events (burned acres) that release carbon into the atmosphere. Table 6 and Figure 9 show that all treatment scenarios result in more total carbon than the NA scenario when we account for the carbon in products and avoided emissions that are estimated from the life cycle analysis. The NA scenario results in higher burn rates than any of the other treatments which effectively caps the potential for carbon storage in the forest below that which might be anticipated in the absence of high fire risk. The high fire risk in untreated stands actually increases carbon emissions relative to treatments that capture more of that carbon in products and reduce the need for fossil fuel based energy sources through substitution and displacement channels. In comparing the treatment scenarios, it is apparent that while the 12&Over treatment moves larger volumes of carbon into long lived products quickly, it does not reduce fires as effectively as the BA 45 treatment. Over the total period BA45 stores about 6.5 million metric tons more than NA compared to 8.5 more for 12&Over in products, substitution and displacement carbon pools.. The relative rankings of these treatment regimes shift when we consider the additional benefit of reducing carbon emissions from wild fires with the BA45 scenario producing 12 million metric tons more carbon than NA by the end of the period. When comparing treatments to NA in percentage terms the increase in the mean total carbon storage is substantial (26% during the total analysis period, 38% during the later period between 2025 and 2050, and more than 50% by the end of the 50 year period). Figure 8 demonstrates that the high carbon in forest biomass associated with the NA alternative cannot continue to increase. Over time the High and Moderate hazard classes (highest biomass and carbon stores) experience forest fires with subsequent carbon release Not unlike fire hazard reduction effectiveness, the carbon results for the 25 Yr Phase-In scenarios demonstrate reduced impacts from delaying treatments. BA45 Phase-In is 5% below BA Immediate over the total period, with the difference somewhat less at the end of the period. When the carbon releases associated with fire events are considered, it is apparent that delaying implementation of fuels reduction activities can result in a significant compromise to over all treatment effectiveness. The CORRIM model highlights the significance of using life cycle analysis (LCA) to better understand how stored carbon in the form of avoided emissions, short and long-lived products and fossil fuel offsets can alter the ranking and assessment of alternative forest treatments designed to reduce wild fires. The dynamic modeling process allows us to vary the degree to which biofuels are used to displace fossil fuels as well as vary levels of substitution of wood for steel or concrete in building alternatives in response to changing market conditions. We can demonstrate the relative rankings of different treatment regimes in not only reducing carbon emissions from fires, but also storing carbon in products and substitution channels as part of a larger carbon accounting system. Coupling CORRIM research with studies on fire hazard reduction demonstrates one approach in analyzing the complexities inherent in developing successful strategies for reducing carbon emissions from the inland west forests.
EconomicsA simple analysis was conducted to demonstrate economic trade-offs between scenarios (Table 6). Due to estimated recurring fire fighting cost liabilities through the investigation period, the simulations show that failure to reduce fuel loads (NA scenario) results in a public cost exposure for fire suppression activities through the simulation period of approximately $237 million (net present value). If weather events contribute to forest fires occurring sooner than the predicted return interval this estimated cost of suppression would logically increase. Harvest returns and fuels treatment costs, as mentioned above, indicate that treatment alternatives could result in net revenue or cost depending upon the amount and value of merchantable logs removed in the treatment simulation. The composite economic analyses for the treatment scenarios presented here examined the interaction between reducing firefighting costs by lowering hazard classification and incurring additional treatment costs or generating revenue from log and slash removals. The 12&Over scenarios (Immediate and 25 Yr Phase-In) resulted in the only Total Value positive returns, due to the high value of wood removed. However, the 12&Over treatments were least successful at fire hazard reduction and resulted in the most acres burned. Log revenues removed early in the period were of sufficient magnitude to absorb high fire fighting costs. The 9&Under scenarios (Immediate and 25 Yr Phase-In) result in negative treatment values and provide only marginal fire hazard reduction. While the net present value of firefighting costs is reduced by approximately $56 million compared to NA, the 9&Under scenarios produce the largest overall public cost after treatment expenditures are included. Total net present cost exposure for the ONF with the 9&Under Immediate treatment is $366 million and $302 million for 9&Under 25 Yr Phase-In. The BA45 scenarios (Immediate and 25 Yr Phase-In) produce marginal but positive average thinning treatment returns of $61/acre. Therefore, differences from NA are almost entirely caused by the reduced fire hazard and subsequent firefighting costs. The BA45 scenarios resulted in significant reduction of net present public cost exposure as compared to NA: nearly $183 million less for BA45 Immediate, and $110 million less for BA45 25 Yr Phase-In. Note that while the BA45 scenarios appear most successful in achieving the range of management objectives considered, the BA45 scenarios still result in costs greater than revenue. However, the difference between the magnitude of the positive return generated by the 12&Over Immediate (in spite of higher fire fighting expenses) and the BA45 Immediate may indicate that a slight modification in this treatment prescription to increase merchantable timber removals could provide a cost neutral hazard reduction option while still maximizing carbon storage and restoring large diameter savannah-like forest conditions. As with other management objectives, the cost of delaying treatments can be quantified as total savings are reduced by nearly 40% for BA 45 25 Yr Phase-In as compared to the BA45 Immediate treatments. It was noted earlier that fire suppression costs on non-federal acres are roughly twice as high as on federal acres increasing the return for treatments. If in addition to fire fighting costs, other avoided costs such as fatalities, facility losses, and regeneration costs are included, the treatment schedule with the least number of acres burned will provide the most favorable economic result (Mason et al 2006). Effective carbon markets would also contribute value to the BA45 treatment. For most of these non-market values, the net cost of BA45 would be reduced while that of 12&Over would increase. Average values are only appropriate for relative comparisons of landscape trends and treatment performance. A more comprehensive landscape-level hazard reduction would logically include a mix of customized treatment intensities sensitive to actual inventory conditions, public values at risk and local concerns. ConclusionsPrevious research has demonstrated that treatment thinning intensity is an important factor in successful stand fire hazard reduction. On a National Forest, several thinning intensities could be successful depending on site-specific forest inventory conditions with heavier thinnings from below (BA45) typically being more successful in most forest conditions (Fiedler et a. 2004, Mason et al. 2003). This research demonstrated that treatment implementation timing is an important factor in landscape fire hazard reduction. Compared to immediate treatments, delayed treatment schedules resulted in more acres burned, decreased total carbon, and increased public exposure to firefighting costs. The NA scenario produced the worst results. Benefits from thinning however may be relatively short-lived as re-growth results in increased hazard within about 25 years. Periodic re-entry for fuels removal is required to keep the fire hazard low. The complex accounting required to accurately assess carbon strategies for high fire hazard in Inland-West forests was also demonstrated. The NA scenario illustrated that the disturbance-free Pacific Northwest forest carbon projection (Figure 2) while realistic for wetter coastal forests does not accurately reflect Inland West carbon storage and emissions given that frequent and intense fire disturbances are part of the natural disturbance pattern of the region. In the long-term, the most carbon in the forest will likely be stored by successfully reducing fire hazard and the number of acres burned. Simulations also demonstrate that while fire reduction treatments remove carbon from the forests, much of the carbon is then stored in long lived products. When total carbon accounting is considered, the NA scenario results in significantly more carbon emissions to the atmosphere than all other landscape scenarios. From a carbon storage perspective the most attractive scenario includes production of long lived products from as much of the volume as practical, using the remaining residuals as a biofuel, and reducing fire risk. The ability to use FVS and FFE to predict forest vegetation growth, treatment impacts, and fire impacts, and any of the tree list analyses developed for LMS to predict other results such as carbon provides many advantages. Basing landscape results on FVS and LMS creates consistency between multiple modeling and planning scales, as FVS and LMS are designed to support site-specific, individual stand management decisions for operational or planning support. The analysis can easily be extended to consider the impacts on stand structure, habitat and forest health where the simulated tree lists provide the necessary structural information to measure other factors that may be considered important in any given geography. ReferencesBabbitt, B. & D. Glickman. 2000. Managing the impacts of wildfires on communities and the environment: A report to the President. 35p. Barrett, T.M. 2001. Models of vegetation change for landscape planning: a comparison of FETM, LANDSUM, SIMPPLLE, and VDDT. Gen. Tech. Rep. RMRS-GTR-76-WWW. Ogden , UT : U.S. Department of Agriculture, Forest Service, Rocky Mountain Research Station. 14 p. Bowyer, J., D. Briggs, B. Lippke, J. Perez-Garcia, J. Wilson. 2004. Life Cycle Environmental Performance of Renewable Materials in Context of Residential Building Construction: Phase I Research Report. Consortium for Research on Renewable Industrial Materials CORRIM Inc. Seattle WA . 60pp +15 chapter modules of approximately 600pp. Beukema, S.J. & W.A. Kurz. 1998. Vegetation dynamics development tool: user's guide (v. 3.0). Available from: ESSA Technologies Ltd., #300-1765 West 8 th Avenue , Vancouver , BC V6J 5C6 . 104 p. Beukema, S.J., D.C. Greenough, C.E. Robinson, W.A. Kurtz, E.D. Reinhart, N.L. Crookston, J.K. Brown, C.C. Hardy, & A.R. Stage. 1997. An introduction to the fire and fuels extension to FVS. In: R. Teck, M. Moeur, & J. Adams (Eds.), Proceedings of the Forest Vegetation Simulator Conference, 1997 February 3-7 (Pp. 191-195). Fort Collins , CO : U. S. Dept. of Agriculture, Forest Service, Intermountain Forest Range and Experiment Station. Birdsay, R.A. 1992. Carbon storage and accumulation on United States forest ecosystems. Gen. Tech. Rep. GTR-WO-59.USDA Forest Service. Bowyer, J., D. Briggs, B. Lippke, J. Perez-Garcia, and J. Wilson. 2004. Life cycle environmental performance of renewable building materials in the context of residential construction. Consortium for Research on Renewable Industrial Materials (CORRIM, Inc). Phase I final report. University of Washington , Seattle , WA . approximately1300 pages. www.corrim.org/reports. Camp, A., C. Oliver, P. Hessburg, and R. Everett. 1996. Predicting late-successional fire refugia pre-dating European settlement in the Wenatchee Mountains . Forest Ecology and Management 95 (1997): 63-77. Chew, J.D. 1995. Development of a system for simulating vegetative patterns and processes at landscape scales. Missoula : The University of Montana , Mansfield Library. Dissertation. 182 p. Crookston, N.L. 1990. User's guide to the event monitor: Part of prognosis model version 6. Gen. Tech. Rep. INT-GTR-275. Ogden , UT : U. S. Dept. of Agriculture, Forest Service, Intermountain Research Station. Crookston, N.L., S.J. Beukema, and C. E. Robinson. 2002. User's guide in the fire and fuels extension to forest vegetation simulator: Chapter 3. (RMRS-GTR-000). Ogden , UT : USDA Forest Service, Rocky Mountain Research Station. Dixon , G. E. comp. 2003 . Essential FVS: A User's Guide to the Forest Vegetation Simulator . Internal Rep. Fort Collins, CO: U. S. Dept. of Agriculture, Forest Service, Forest Management Service Center . 193p. Everett, R. 2005. Eastside Forests Project Update. Rural Technology Initiative Annual Technical Review Streaming Video. http://www.ruraltech.org/video/2005/annual_review/08_everett/fdeflt.htm ESSA Technologies Ltd. 2005. Vegetation Dynamics Development Tool User Guide, Version 5.1. Prepared by ESSA Technologies Ltd., Vancouver , BC . 188 pp. Fiedler, C. E., Keegan, C. E.III, Woodall, C.W., Morgan, T. A. 2004. A strategic assessment of crown fire hazard in Montana : potential effectiveness and costs of hazard reduction treatments. Gen. Tech. Rep. PNW-GTR-622. Portland , OR : U.S. Department of Agriculture, Forest Service, Pacific Northwest Research Station. 48 p. Finney, M. A. 2004. FARSITE: Fire Area Simulator - Model Development and Evaluation. Research Paper RMRS-RP-4 Revised, Ogden , UT. U.S. Department of Agriculture, Forest Service, Rocky Mountain Research Station. 47 p. Franklin Associates. 1998. Combustion of wood in industrial boilers. SimaPro5 Lifecycle Assessment Software Package. Version 36, 2001. Gholz, H.L., C.C. Grier, A.G. Campbell [et al.]. 1979. Equations for estimating biomass and leaf area of plants in the Pacific Northwest . Corvallis , OR : Forest Research Lab, Oregon State University. Hardy, C. 2005. Wildland fire hazard and risk: Problems, definitions, and context. Forest ecology and management 211 (2005): 73-82. Harmon , M.E. 1992. Long-term experiments on the log decomposition at the H.J. Andrews Experimental Forest . Gen. Tech. Rep. PNW-GTR-280. Portland , OR : USDA Forest Service, PNW Research Station Hessburg, P., J. Agee, J. Franklin. 2005. Dry forests and wildland fires of the inland Northwest USA : Contrasting the landscape ecology of pre-settlement and modern eras. Forest Ecology and management. 211 (2005): 117-139. Keane, R.E., D.G. Long, D. Basford, B.A. Levesque. 1997. Simulating vegetation dynamics across multiple scales to assess alternative management strategies: proceedings for GIS '97; 1997 February 17-20; Vancouver , BC . Fort Collins , CO : GIS World Books. 640 p. Lippke, B., J. Wilson. J. Bowyer, J. Perez-Garcia, J. Bowyer, J. Meil, 2004. CORRIM: Life Cycle Environmental Performance of Renewable Building Materials. Forest Products Journal . June 2004. Vol. 54, No. 6 page 17. Mason, L., K. Ceder, H. Rogers, T. Bloxton, J. Comnick, B. Lippke, J. McCarter, K. Zobrist. 2003. Investigation of Alternative Strategies for Design, Layout and Administration of Fuel Removal Projects. Rural Technology Initiative, College of Forest Resources, University of Washington . Seattle . 78pp plus appendices. Manriquez, A.C. 2002. Carbon sequestration in the Pacific Northwest : A model . Seattle , WA : University of Washington 167p. M.S. thesis. McCarter J., J. Wilson, P. Baker, J. Moffett, and C. Oliver. 1998. Landscape management through integration of existing tools and emerging technologies. Journal of Forestry 96: pp.17-23. McKenzie, D., Z. Gedalof, D. Peterson, and P. Mote. 2004. Climate Change, Wildfire, and Conservation. Conservation Biology. 18:4. pages 890-902. Olson, D. 2000. Fire in riparian zones: a comparison of historical fire occurrence in riparian and upslope forests in the Blue Mountains and southern Cascades of Oregon. Seattle , WA : University of Washington 274p. M.S. thesis. Omni, P.N., & E.J. Martinson. 2002. Effect of fuels treatment on wildfire severity. Joint Fire Sciences Program Report. http://www.warnercnr.colostate.edu/frws/research/westfire/FinalReport.pdf Perez-Garcia, J., B. Lippke, J. Comnick, and C. Manriquez. 2005. An Assessment of Carbon Pools, Storage, and Wood Products Market Substitution Using Life-Cycle Analysis Results . Wood Fiber Sci. 37 Dec. 2005: p140-148 Reinhardt, E. and N.L. Crookston. (Technical Editors) 2003. The Fire and Fuels Extension to the Forest Vegetation Simulator. Gen. Tech. Rep. RMRS-GTR-116. Ogden , UT : U.S. Dept. of Agriculture. Forest Service. Rocky Mountain Research Station. 209p. Scott, J.H. & E.D. Reinhardt. 2001. Assessing crown fire potential by linking models of surface and crown fire behavior. Research Paper. RMRS-RP-29. Fort Collins , CO : U. S. Dept. of Agriculture, Forest Service, Rocky Mountain Research Station. WADNR. 2004. A Desirable Forest Health Program for Washington 's Forests: Forest Health Strategy Work Group Report. Washington Dept. of Natural Resources. Dec. 2004. Western Governors Association. 2001 and 2002. Western Governors Association: A collaborative approach for reducing wildland fire risks to communities and the environment. The 10-Year Comprehensive Strategy Implementation Plan. http://www.westgov.org/ Wood and Fiber Science. 2005. Special Issue: CORRIM Reports on Environmental Performance of Wood Building Materials. Wood and Fiber Science Vol. 37 Dec. 2005. 155pages. Appendix:Values per Period for Fire Hazard Class, Burned and Treated Acres, Carbon, and Economics
|
|||||||||||||||||||||||||||||||||||||||||||||||||||||||||||||||||||||||||||||||||||||||||||||||||||||||||||||||||||||||||||||||||||||||||||||||||||||||||||||||||||||||||||||||||||||||||||||||||||||||||||||||||||||||||||||||||||||||||||||||||||||||||||||||||||||||||||||||||||||||||||||||||||||||||||||||||||||||||||||||||||||||||||||||||||||||||||||||||||||||||||||||||||||||||||||||||||||||||||||||||||||||||||||||||||||||||||||||||||||||||||||||||||||||||||||||||||||||||||||||||||||||||||||||||||||||||||||||||||||||||||||||||||||||||||||||||||||||||||||||||||||||||||||||||||||||||||||||||||||||||||||||||||||||||||||||||||||||||||||||||||||||||||||||||||||||||||||||||||||||||||||||||||||||||||||||||||||||||||||||||||||||||||||||||||||||||||||||||||||||||||||||||||||||||||||||||||||||||||||||||||||||||||||||||||||||||||||||||||||||||||||||||||||||||||||||||||||||||||||||||||||||||||||||||||||||||||||||||||||||||||||||||||||||||||||||||||||||||||||||||||||||||||||||||||||||||||||||||||||||


