 |
 |
 |
 |


IMPACTS OF THE FOREST AND FISH RULES
ON SMALL FOREST LANDOWNERS IN EASTERN WASHINGTON: SOME KEY CONSEQUENCES
FROM RIPARIAN ZONE CASE STUDY ANALYSIS
|
Elaine E. Oneil
Impacts of the forest and fish rules on small forest landowners
in eastern Washington: by Elaine Ellen Oneil Chairperson of the Supervisory Committee: Professor Bruce Lippke In June 2001, the Washington State Forest Practices Board adopted changes to its regulations to meet the requirements of the Clean Water Act and the Endangered Species Act. The new regulations, known as the "Forest and Fish Rules" include significant restrictions on timber harvest in riparian areas across the state. The stated intent of the rules in eastern Washington is to provide for restoration of riparian function while allowing activities that can ameliorate risks associated with fire, disease, and insects within riparian zones. In order to better understand how these new rules might affect eastern Washington small forest landowners, simulations of forest stand development and economic outcomes were modeled for nine case studies located in Okanogan, Pend Oreille, Stevens, and Whitman counties. For each case study, treatment scenarios were simulated over a 90-year growth period using the Forest Vegetation Simulator (FVS) growth models and the Landscape Management System (LMS). Simulations of multiple harvest options and treatment regimes for both upland and riparian management units for each case study were compared to assess potential economic outcomes. By comparing the FFR to a 'baseline' of the "permanent rules" in effect immediately prior to June 2001, a measure of the incremental impact of the new legislation was determined. Four riparian area management scenarios were evaluated under the FFR rules including a no harvest option, harvest in the outer zone only, a single harvest entry in the inner zone, and multiple harvest entries in the inner zone. Analysis indicates that the economic losses for
case study simulations, when compared to the baseline, range from
a 0 to 49% reduction in discounted cash flows. In many instances
economic losses can become gains if the landowner qualifies for
and chooses to participate in a state funded compensation program
called the Forest Riparian Easement Program (FREP). While FREP
may address economic considerations if adequately funded, it does
not provide incentive for stewardship activities such as removal
of excessive fuel loads or control of insect damage. In cases
where forest health or economic considerations cannot be addressed
within the current FFR parameters, alternate plans are allowed.
Alternate plans that address fire risk and insect attack from
Mountain Pine Beetle (Dendroctonus ponderosae Hopkins) while providing
for riparian functional requirements were also examined.
**Here's a link to the PDF version of this ThesisTable of Contents
List of Figures
List of Tables
Glossary
AcknowledgmentsThe author wishes to acknowledge Rural Technology
Initiative at the University of Washington, College of Forest
Resources for their support of this project. Thanks to Prof. Bruce
Lippke, Larry Mason, Kevin Zobrist, Don Hanley and Dave Briggs
for their valuable input and feedback. Thanks to Jim McCarter,
Kevin Zobrist and Luke Rogers for their technical support. Thanks
to the silviculture lab for feedback and encouragement. Bob Playfair
provided a thoughtful perspective, wise words, and inspiration
from the trenches. Roger and Fernne Rosenblatt provided a sound
perspective to hone the approach to alternate plans. Field support
for this project was provided by Brian Vrablick of Northwest Management
Inc. and Maurice Williamson of Williamson Consulting Inc. Special
thanks to all the landowners who participated in and gave input
to this study.
1.0 Historical OverviewThis section provides a historical overview of the policy design and regulatory approach of Washington State's Salmon Recovery Act (ESHB 2091), originally know as the Forest and Fish Rules (FFR). When the National Marine Fisheries Service (NMFS) gave notice that salmon and steelhead were to be listed as endangered in Washington State, the Governor's Office, state natural resource agencies, and affected economic sectors were quick to work toward a solution that would keep some degree of autonomy within their realm of decision making. The drive to address salmon listing at the local level arose because both state government agencies and timber harvesters had the potential to be subject to litigation for 'take' of habitat in the process of conducting otherwise lawful activities during timber harvest. Salmon listing also introduced significant uncertainty in administrative procedures and the ability to conduct business for both government and industry. It is apparent that while the FFR was intended as a measure to protect salmon, there was a significant impetus to keep decision making at the state level, rather than allowing federal intervention in forest resource management, and particularly timber harvest, through the mechanism of the Endangered Species Act (WA State governors office, 1999). This need to have some control over the outcome of salmon listing as an endangered species was an implicit goal of the process. In fact, state entities were so successful in meeting this goal, that Washington State's forest practices legislation is the only forestry related legislation mentioned as exempt from 'take' provisions under the various listings of Pacific salmon species in the Federal Register (NOAA 2000). This exemption from 'take' meant that if forestry activities occurred as substantially put forth in the Forest and Fish Report, the National Marine Fisheries Service (NMFS) would not litigate under the ESA against the forestry entity or the Washington Department of Natural Resources (DNR) which is responsible for permitting forestry activities within the state. There is continued negotiation between the DNR and NMFS to obtain these federal assurances (DNR, 2003). Because of ongoing developments in forest management law and regulation, a multi-party caucus that included resource agencies, timber harvesters, and environmental groups already existed in Washington State prior to the enactment of the FFR. This caucus was called Timber, Fish, and Wildlife (TFW) and its members played a key role in drafting the FFR and determining the outcome of the bill as it traveled through the legislative process. Once the Salmon Recovery Act was approved as an emergency rule, further work was done to make it a 'final rule' that has become Washington State's Forest Practices Act (RCW 76.09) and the Forest Practices Rules (WAC 222) as of July 2001.
1.1 The GoalsAs outlined in the preamble to the Forest Practices Rules, there were four key goals that the new legislation was designed to meet (WAC 222, 2001). They are:
While the intent of these environmental and economic goals is clearly articulated, they are conflicting, and imply that salmon listings are directly proportional to the amount of forest harvest activity adjacent to streams. This is particularly apparent as the policy scope of the FFR is limited to public and private forestry operations within Washington State where one is harvesting trees and plans to reforest the area for future tree production. The policy does not extend to timber harvest where the denuded land will be used for agriculture or urban development. This limitation in scope arises because there were policies mandating the extent of forest operations near streams prior to the FFR, and the mechanisms to increase the mandated protections were relatively easy to achieve within the current framework. The implicit understanding behind the FFR is that previous riparian buffer widths and sediment mitigation measures mandated under Washington State forestry legislation were insufficient to protect salmon and meet the provisions of the Clean Water Act. Thus the FFR was instituted to increase the emphasis on riparian protection and water quality by increasing riparian buffer widths, limiting road development and in some instances eliminating harvest in forested areas. While the causal relationships between forestry activities and salmon are still hotly debated, (Buchal 1998) it is clear that the legislation was directed at a target audience that had accepted a responsibility for environmental management and thus significant regulatory influence in their business. This is obvious from the long standing pre-existent presence of the TFW advisory group. The FFR legislation was acknowledged to pose significant compliance costs and challenges for all target groups, with a disproportionate impact on small forest landowners. To address the limited compliance capacity of small landowners, a segment of the FFR legislation was dedicated to the establishment of a small forest landowners office (SFLO) within the DNR. The SFLO is charged with assisting small landowners with compliance issues as well as voluntary programs that are part of the policy package. This action was seen as instrumental in ensuring small landowners would continue to keep their property in forestry and thus provide the environmental benefits anticipated by enactment of the FFR. 1.2 Historical TimelineA historical timeline culminating in the enactment of the FFR is summarized in Table 1.2.1. Table 1.2.1 is adopted from the summary of the rule history as identified on the Washington State DNR website www.wa.gov/dnr/htdocs/fp/fpb/ruleshist.html with the addition of specific information found on the Washington State Governor's Office website. Original TFW information, as provided from the DNR website, has been included in the table to demonstrate the strength and continuity of the TFW process through several ESA listings within Washington State.
1.3 Voluntary Policy Elements of the Forest and Fish RulesGiven that the FFR is derived from a negotiated process that included state and federal government agencies, industrial interests, environmental and tribal coalitions and individuals, and small forest landowners, one would expect that there would be a significant voluntary component to the policy. However, its final form prescribes exactly the processes and outcomes that must occur in riparian zones if timber harvesting and reforestation are to occur. This command and control approach to regulation was deemed necessary to achieve exemption from the ESA take provisions, though the tactic had predictable negative economic outcomes for small landowners. To address the unfair regulatory burden on small landowners, there are two voluntary policy elements within the FFR. The first voluntary element entails the option for private timber owners to sell the timber rights along riparian areas to the government for a 50 year 'easement' period for a value equal to half the value of the timber required to be left unharvested. This program is known as the forestry riparian easement program (FREP). A second voluntary element allows for the use of alternate plans that will be 'at least as effective' as the current legislation in meeting the four goals of the FFR. The alternate plans are intended to provide habitat value in a more cost effective manner. While these two voluntary elements conceptually form a minor element of the FFR, in fact they can have a significant impact on environmental and economic outcomes, both for individuals and for the state as a whole. Consider that small landowners eligible for the voluntary programs collectively own 18% of the timber land in Washington State. As approximately 51% or 21 million acres of the state is timberland, small forest landowners own a significant amount of the state and the state's timber harvest that can be affected by these voluntary elements, particularly when we consider that 33% of the timber land in the state is Federal where very little harvest occurs for a variety of reasons. (All percentages from Edelson 2001 as extracted from Adams et al 1992, and Bare et al. 1995) The voluntary instruments were included in the FFR because they were required under the Regulatory Fairness Act (RCW 19.85) to address the disproportionate impact of the rules on small forest landowners (Perez-Garcia et al. 2001). As such, these voluntary elements contain both a legislative mandate to find solution for regulatory unfairness, as well as elements of negotiated compromises to address differences in land management between industrial and non-industrial (i.e. small) private forest landowners. While the instruments have been included in the FFR to address regulatory fairness, their application has proven to be so problematic that they may prove largely ineffective unless streamlined administrative procedures can be adapted. Given funding issues and budget deficits, the FREP will not likely be effective in advancing the policy goals of addressing regulatory fairness for small landowners. According to Zobrist (2000) the current funding levels for the riparian easement program over the entire state amounts to $2.5 million per biennium, but the need is equivalent to a $24 million per biennium ($600 million net present value over 50 years) for WesternWashington alone, excluding all eligible participants in Eastern Washington. In fact, according to personal communication with Steve Stinson, the head of the Department of Natural Resources, Small Forest Landowner Office, one riparian easement in Western Washington cost the state 1/5 of the total biennium allotment. With these types of fiscal shortfalls, alternative mechanism to address regulatory fairness will likely be required.
Alternate planning, the second voluntary component of the FFR, was heralded as a first of its kind by industry. Unfortunately, the terminology and definition of this section of the FFR is so vague as to make the adoption and implementation of alternate plans extremely difficult. As noted by Kubasek and Silverman (2002), environmental laws are often made intentionally vague so that they may be passed with the specifics becoming defined by the ensuing case law. In terms of alternate planning, the FFR is no exception to this general rule. Though alternate plans are permitted in specific situations, such as disproportionate levels of impact, or on a small harvest unit, they must provide 'protection to public resources at least equal in overall effectiveness as provided by the act and rules ' (WAC 222-12-040). However, the rules represent a political compromise for all stakeholders in an effort to secure federal assurances of exemption from 'take' under the 4d rule of the Endangered Species Act. In such cases, defining the terms 'protection' and 'overall effectiveness' in order to avoid litigation is problematic particularly given that the rules as defined in the FFR were negotiated on a tree by tree basis. To address the issues of protection and overall effectiveness, approval to harvest under an alternate plan requires an assessment by an interdisciplinary team (WAC 222-040-0401). At a minimum this team is comprised of environmental professionals from the Washington State Departments of Natural Resources, Ecology, and Fish and Wildlife as well as the National Marine Fisheries Service, the United States Department of Fish and Wildlife, affected tribes, and perhaps a professional forester hired by the landowner in question. Given the amount of government staff time required to conduct a field visit to determine the appropriateness of an alternate plan, relative to the number of potential alternate plans that exist, this process of permitting and approving alternate plans is onerous and unwieldy indeed. From the landowners' perspective, the alternate planning approval process has been difficult, time consuming and costly (Playfair, 2002). Part of the unwieldiness of the alternate planning process is the expectation that the agencies involved can facilitate the review process for alternate plans given that 18% of 21 million acres of timberland or 4.86 million acres potentially fall within the ownership category available for this program. Implementation problems are compounded by the fact that the average size of these holdings is 84 acres which translates into 67,500 alternate plan approvals (Rural Technology Initiative 2001). To address these implementation issues the Small Forest Landowners Office of the Department of Natural Resources is designing 'templates' that could facilitate the review of potential alternate plans. These templates are intended to simplify the alternate planning process for commonly occurring scenarios while providing a mechanism to integrate site specific information into forest management decisions. With the adoption of alternate plans, there is a mechanism whereby visionary members of the regulated community can advance the science and art of forestry. Because these alternate plans occur on relatively small acreages, the opportunity to test current scientific assumptions and protocols does exist with only minimal risk to aquatic resources. It is in these situations that adaptive management mechanisms can be tested prior to implementation in the larger regulated community. Alternate plans become particularly germane in eastern Washington for the intent of the rules in eastern Washington is to provide for restoration of riparian functions, while allowing activities that can ameliorate risks associated with fire, disease and insects within riparian zones. While general trends and impacts of the FFR were
predicted and addressed by measures such as the FREP and alternate
plans, no specific impacts were estimated. When placed inside
this historical perspective, the case studies that will be discussed
in the remaining sections become key to elucidating the consequences
that arise from the FFR. The consequences examined include economic
outcomes, the benefits and shortcomings of the two voluntary elements
of the FFR, some potential biological consequences under different
disturbance regimes, and finally some prospective opportunities
to move into a phase of forest riparian management that truly
takes an adaptive, integrated approach. |
|||||||||||||||||||||||||||||||||||||||||||||||||||||||||||||||||||||||||||||||||||||||||||||||||||||||||||||||||||||||||||||||||||||||||||||||||||||||||||||||||||||||||||||||||||||||||||||||||||||||||||||||||||||||||||||||||||||||||||||||||||||||||||||||||||||||||||||||||||||||||||||||||||||||||||||||||||||||||||||||||||||||||||||||||||||||||||||||||||||||||||||||||||||||||||||||||||||||||||||||||||||||||||||||||||||||||||||||||||||||||||||||||||||||||||||||||||||||||||||||||||||||||||||||||||||||||||||||||||||||||||||||||||||||||||||||||||||||||||||||||||||||||||||||||||||||||||||||||||||||||||||||||||||||||||||||||||||||||||||||||||||||||||||||||||||||||||||||||||||||||||||||||||||||||||||||||||||||||||||||||||||||||||||||||||||||||||||||||||||||||||||||||||||||||||||||||||||||||||||||||||||||||||||||||||||||||||||||||||||||||||||||||||||||||||||||||||||||||||||||||||||||||||||||||||||||||||||||||||||||||||||||||||||||||||||||||||||||||||||||||||||||||||||||||||||||||||||||||||||||
| Table 2.1: | Eastern Washington RMZ for streams with bankfull width of less than or equal to 15 feet wide. (From WAC Chapter 222-30-022, 2001) |
|
Site
Class |
Total
RMZ Width |
Core Zone Width
|
Inner
Zone Width |
Outer
Zone Width |
|
I
|
130'
|
30'
|
45'
|
55'
|
|
II
|
110'
|
30'
|
45'
|
35'
|
|
III
|
90'
|
30'
|
45'
|
15'
|
|
IV
|
75'
|
30'
|
45'
|
0'
|
|
V
|
75'
|
30'
|
45'
|
0'
|
![]()
| Table 2.2: | Eastern Washington RMZ for streams with bankfull width of greater than 15 feet wide. (From WAC Chapter 222-30-022, 2001) |
|
Site
Class |
Total
RMZ Width |
Core Zone Width
|
Inner
Zone Width |
Outer
Zone Width |
|
I
|
130'
|
30'
|
70'
|
30'
|
|
II
|
110'
|
30'
|
70'
|
10'
|
|
III
|
100'
|
30'
|
70'
|
0'
|
|
IV
|
100'
|
30'
|
70'
|
0'
|
|
V
|
100'
|
30'
|
70'
|
0'
|
No harvest is allowed in the "core zone" closest to the stream. Harvest is permitted in the middle or "inner zone" if the forest condition meets a dual criteria for minimum basal area and tree count of a specified diameter size. Harvest is also allowed in the "outer zone" as long as a stream-adjacent parallel road is not present. Tables 2.1 and 2.2 apply to fish bearing streams only. Stream classification is based on the width, gradient, and flow metrics of the stream as well as basin characteristics. Presence or absence of any particular species of fish is not considered in stream classification.
2.1.3 Habitat Types
Legislatively defined forest habitat types are used to define legally acceptable riparian zone management based on the average elevation of the stream reach. This legislative definition does not depend on the species on site or on the ecological capability of the site. The requirements for inner zone retention in the habitat types that apply to the eastern Washington riparian case studies included in this report are outlined in Table 2.3
![]()
| Table 2.3: | Eastern Washington inner zone entry and retention requirements by habitat type (adapted from WAC Chapter 222-30-022, 2001) |
|
1
|
2
|
3
|
4
|
5
|
6
|
7
|
|
Habitat type
|
Elevation Range
|
Minimum Basal area in
Trees > 6" dbh prior to harvest
|
Minimum number of trees
to be left > 10" dbh after harvest
|
Minimum basal area of
trees to be left after harvest that meet the criteria of column
4.
|
Minimum number of trees
left under basal area override clause
|
Average residual tree
diameter required to avoid basal area override
|
|
Ponderosa Pine
|
Below 2500'
|
110 sq feet
|
50 including 21 largest,
plus 29 more > 10"
|
60 sq feet
|
All trees > 6" up to a
maximum of 100 TPA
|
>14.8"
|
|
Mixed conifer
|
2501'-5000'
|
110 - low site indices
(SI)
130 - medium site indices (SI) 150 - high site indices (SI) |
50 including 21 largest,
plus 29 more > 10"
|
70 - low site indices
(SI)
90 - medium site indices (SI) 110 - high site indices (SI) |
All trees > 6" up to a
maximum of 100 TPA
|
>16.0" - low SI
>18.2" - med SI >20.1" high SI |
Basal area override occurs when more than 50 trees/acre (TPA) are
required to meet the minimum basal area required by habitat type
and site index. This situation occurs if the average dbh of the
50 residual trees is less than the value indicated in column 7 of
Table 2.3. In effect, the over-ride clause prevents harvest under
some conditions when thinning would be advantageous to the stand
development. High density stands have additional legislative criteria
that must be met prior to harvest. Because of legislative limitations
and negative pulp market values, small diameter high density stands
were not harvested under simulated FFR scenarios. However, small
diameter trees and pulp quality material were harvested in instances
where the value of merchantable logs was sufficient to generate
a positive economic return. This harvested pulp material was not
included in the total harvest value, as it would reduce overall
return.
Riparian outer zone retention requirements are substantially less complex than the inner zone requirements. At harvest, a minimum of 10 dominant or codominant trees must be left in the Ponderosa Pine habitat type and a minimum of 15 dominant or codominant trees must be left in the mixed conifer habitat type.
Where a stream is classified as non-fish bearing but perennial (prior class 4), retention requirements vary by management strategy. If the adjacent upland will be managed through partial cutting, retention requirements for inner zone harvest apply as outlined in Table 2.3. If the adjacent upland will be managed using even-aged management regimes, a two sided 50' wide no cut buffer is required along upland portions of the management unit. The 50' no cut buffer must meet basal area limits as indicated in Table 2.3, column 3. In addition, the stream boundary must be less than 300 feet long, be greater than 500' from a fish bearing water, be outside sensitive sites, and be less than 30% of the total length of the stream in the harvest unit (WAC 222-30-022, 2(b) (i) and (ii)).
![]()
2.1.4 Forest Riparian Easement Program
Under the FFR, a program to compensate small landowners who were disproportionately affected by the rules was implemented. This program is called the Forest Riparian Easement Program (FREP) (WAC 222-21). The FREP recognizes that small landowners may have a significant portion of their land affected by the riparian rules. Assuming adequate appropriations are available, the FREP will pay landowners for a portion of the estimated net value of the timber they are required to leave under the FFR at the time they harvest a contiguous upland forest unit. In return the state acquires a 50 year 'easement' or 'ownership' over the trees in that area. The trees that can be considered in the easement are denoted as 'qualifying timber'.
Depending on the relative amount of harvest in riparian versus upland areas under a given Forest Practices Application (FPA), the compensation for qualifying timber may equal ½ its value or all its value. If the timber to be left is less than 12.2% of the total value of timber harvested under the FPA, then only ½ the value of the timber is compensated for under the FREP. If the timber to be left is greater than 12.2% of the total value of the timber harvested under the FPA, then the timber in excess of 12.2% is compensated for at 100% of its value. This variation is based on a high impact over-ride of 12.2% for small landowners in eastern Washington. The formula used to calculate the FRE as given in WAC 222-21-050 is:
Compensation for easement = (HIO * TV) + ((t * TV)/2)
Where:
HIO = high impact override = (Vq/TV) - t
TV = total value of all timber covered under FPA = Vq + Vh
t = high impact of regulatory threshold of 12.2% for eastern Washington
Vq = value of qualifying timber
Vh = value of harvested timber
The equations given above apply to both eastern and western Washington. However, because of opportunities to re-enter the riparian zone in eastern Washington, additional FRE covenants apply. If a second entry into the riparian zone is planned within the 50 year easement period, a reduced valuation rate is applied to trees other than the 21 largest trees per acre (TPA) that have to remain regardless of basal area and tree count limits. This reduced valuation rate is linked to the 30 year treasury bill interest rate minus an anticipated growth rate on the value of the trees covered under the easement (WAC 222-21-045). In order to quantify this value within the easement, 'replacement timber' had to be identified at the initial stand entry. For purposes of this analysis, 'replacement timber' was not left at the initial entry to serve as a replacement for the 29 smaller trees that could theoretically be removed at a second entry into the riparian inner zone. The rationale for this approach is based on two premises. First, as stand re-entry was delayed 30-40 years into the future because of stand characteristics, there was natural mortality of larger trees. Second, harvest levels at the first entry were set to remove all merchantable trees, except for those required to be left under the FFR, as a safety precaution against further erosion of timber value in the riparian zone. This management approach typically left very few trees that would move into the range of acceptability as potential reserve trees under FFR for the second entry. Thus, for the most part, the original 50 reserve trees, with a few additions through time to account for mortality, were still within the stand at the end of the simulation, regardless of the number of stand re-entries that may occur. While minor changes in value might accrue from this approach, the relative amount of change is deemed insignificant for purposes of the analysis.
A second peculiarity of the eastern Washington FFR as it relates to the FRE is the upper basal area limit and its impact on harvest timing. Under the FREP, easements are granted at the time of harvest, but only when the riparian area is part of a commercially reasonable harvest unit. Typically this means that the riparian area must be harvested when the adjacent upland is harvested. If an adjacent upland stand is ready for a regular harvest entry, then the riparian zone should also be entered at that time to qualify for the easement. However, on very dry, poor ecosystems the riparian stands often did not have adequate basal area to permit any stand entry at all at the point when adjacent uplands had sufficient volume to permit an economically viable harvest. In such cases, the FRE was calculated based on the value of all the standing timber in the core and inner zone of the riparian area, as in such cases no timber harvest whatsoever was permitted in these areas. This particular condition did not occur on wetter, richer ecosystems, as the first riparian stand entry, upon which the FRE was calculated, almost always had sufficient basal area to permit at least one entry in these cases.
![]()
2.1.5 Fire Impacts on Riparian Areas
Fire impacts and the effects of a century of fire suppression in landscapes characterized by frequent fire disturbance regimes have been well documented (Agee 1993, 1994, 1999, Everett et al 1994, 2001, Hann et al 1997, Sampson and Adams, eds., 1994, and others). As broader landscape level questions regarding historic fire regimes and natural range of variability have evolved, there has been an increasing interest in the role of riparian areas as fire refugia (Camp 1995), and as potential fire propagation areas (Agee 1999). Potential differences in fire behavior in upland and riparian areas have been studied by examining stand structural attributes (Williamson 1999, Everett et al. 2001, Olson 2000) as well as topographic and physiographic influence (Camp 1995, Morse, 2000, Olson 2000). These studies illustrate that there is wide variability in potential fire behavior and resulting stand structures within riparian areas depending on disturbance history (Camp 1995, Everett et al. 2001) and topographic features (Morse, 2000, Everett et al. 2001).
Assessing fire impacts within riparian areas in Eastern Washington is particularly salient because of the policy and management direction that creates no touch buffers along streams in these fire dependent ecosystems (Everett et al. 1994, 2001, WAC 222, 1998 and 2001). The adoption of riparian protection rules for eastern Washington under WAC 222 are specifically mandated to ensure habitat protection under the Endangered Species Act (ESA) for endangered salmonids and bull trout (Federal Register 2000, 65(132):42424). At the same time, the rules are "Designed to mimic eastside disturbance regimes within a range that meets functional conditions and maintains general forest health" (WAC 222-30-022 2001). Everett et al. 2001 maintain that 'We do not know the effects of the establishment and separate management of administrative riparian buffer zones." To understand the effects of separating management into riparian and upland zones may require extensive studies under an adaptive management regime.
To date, adaptive management regimes that examine the effects of separation of management between upland and riparian zones have not been tried in favor of maintaining riparian buffer regimes. Opportunities exist within the FFR for adaptive management using the alternate planning process to "facilitate voluntary landscape, riparian or stream restoration" (WAC 222-12-040, 2001) although the use of alternate planning processes to facilitate both riparian protection and fire safe forests has not been well documented to date. Without extensive field experimentation, one option to examine potential impacts of fire behavior in new riparian buffers is to use existing models to simulate potential outcomes.
![]()
3.0 Methods and Assumptions
Sample forested properties for case study analysis were obtained
by canvassing eastern Washington Farm Forestry Association (WFFA)
members and consultants to find landowners willing to allow their
property to be used as a case study. As indicated in Figure 3.1,
a total of nine case study sites were offered for use in the analysis:
3 in Pend Oreille County, 4 in Stevens County, 1 in Okanogan County,
and 2 in Whitman County.
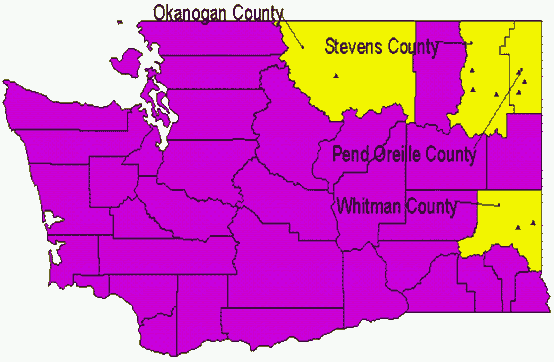 |
| Figure 3.1: Location of the case studies under review. |
3.1 Modeling
The US Forest Service has developed a number of tools that are used to predict stand growth and development and interactions between cohorts in multi-layered stands. One of these tools is the Forest Vegetation Simulator (FVS) which has evolved from the Prognosis model first developed in 1973 by the Intermountain Forest and Range Experiment Station. In the past 30 years this model has been refined for various forest types and management regimes throughout the US. It has become an accepted tool for predicting the stand level outcomes of silvicultural intervention (Wykoff et al. 1982).
For each case study, treatment scenarios were simulated over a 90-year growth period using FVS growth models and the Landscape Management System (LMS) forestry software (McCarter, 2001) developed at the University of Washington's Silviculture Laboratory. Fire simulations were conducted for a subset of the case studies using the North Idaho (NI) variant of the Forest Vegetation Simulator (FVS) and the Fire and Fuels Extension (FFE) component of that modeling system.
![]()
3.1.1 Growth Models
The FVS model has evolved to the degree that tree growth and yield, suppression of understory, and mortality variables are specified to the level of ecological habitat type as defined by Daubenmire and Daubenmire (1968) and refined by Cooper et al. (1987). Habitat type is derived from a combination of tree species composition, understory vegetation characteristics, and soil parameters. Where understory and soil estimates were missing, default habitat types where chosen as recommended within the North Idaho variant of FVS. Cases in Stevens, Pend Oreille and Whitman counties used the North Idaho variant of FVS. The North Idaho variant relies on forest location and habitat type to simulate tree growth. Each case study uses the forest location for the nearest National forest. Stevens County case studies used growth parameters from Colville National Forest, Pend Oreille County case studies relied on growth parameters from Kaniksu National Forest and Whitman County case studies used St Joe National Forest growth variables (*Kaniksu and St Joe National Forests have been combined as the Idaho Panhandle National Forest but FVS maintains the separate growth equations by forest). The habitat type variable is a simulation parameter that FVS used to fine tune growth estimates based on ecologically defined conditions.
The case in Okanogan county used the East Cascades variant of FVS. Unlike the North Idaho variant of FVS, this variant relies on forest location and site class to determine tree and stand growth patterns. The Okanogan National Forest was used as the nearest National Forest and site index was estimated from interpolating soil survey maps for the area (Lenfesty, 1980). Habitat type was not a variable required for growth simulation, although it does become pertinent when evaluating alternate plans.
3.1.2 Fire Prediction Models
Predicting fire behavior within forest stands can be facilitated with the use of an array of modeling tools. One such tool is the Fire and Fuels Extension (FFE) to FVS that has been developed within the last decade to model the impacts of fire behavior and fuel dynamics over time. The model has been developed and calibrated using the NI variant of FVS (Crookston 2002, Beukema et al. 2002). The FFE model integrates existing models for surface fire behavior (BEHAVE) (Andrews 1986) with methods for predicting mortality adapted from the First Order Fire Effects Model (FOFEM) (Reinhardt et al. 1997). Based on weather, fuels and geographic input parameters, BEHAVE predicts rate of spread, flame length, and fireline intensity. FOFEM uses estimates of downed woody fuel, duff, live fuels and weather conditions to predict stand mortality on an individual tree basis. FFE establishes linkages between individual tree mortality as predicted by FOFEM and the potential for passive and active crowning given the outcomes from BEHAVE to arrive at stand level mortality estimates. Estimates of crowning potential are based on approaches developed by Van Wagner (1977) and later refined by Scott and Reinhardt (2001). As FFE requires stand and tree inputs from FVS, the combined models must be used together and are symbolized as FVS-FFE.
Beukema et al. 2002, provide the following general model description of FVS-FFE. FVS-FFE can be initialized to a range of fuel models, fuel moisture conditions, and potential fire weather indices. FFE takes FVS supplied forest inventory data, site data, and habitat classification data and predicts potential fire behavior for two sets of conditions; high and moderate severity fires. Simulations of high severity fire impacts use parameters that might exist during a wildfire. Simulations of moderate severity fire impacts use inputs that might be more common during prescribed burning operations. Critical parameters for fuel models, fuel moisture conditions and potential fire weather indices can be chosen by the user. Without user specified inputs the following default values are used:
- High severity conditions - mid canopy windspeed defaults to
20 miles per hour.
- Moderate severity conditions - mid canopy windspeed defaults
to 6 miles per hour.
- Both sets of conditions - default temperature is 70 degrees.
F.
- Default or initialized fuel behavior models are chosen from
14 potential fire behavior models (Anderson, 1982) based on initial
FVS stand and site characteristics.
- Canopy characteristics used to model the base of the live crown
use a 13 foot running mean weight of greater than 30 lbs/acre/foot
(Beukema et al. 2002:15)
- Fuel moisture conditions for high severity conditions use row 1 parameters and moderate severity fire conditions use row 3 parameters from the following table adapted from Beukema et al. 2002:28.
![]()
| Table 3.1.1: | Fuel Moisture Conditions under moderate and severe fire conditions. |
|
Field Value
|
Moisture level
|
Fuel Size Class
|
|||||
|
1 hour
|
10 hour
|
100 hour
|
>3 inch
|
Duff
|
live
|
||
|
1
|
Very dry
|
4
|
4
|
5
|
10
|
15
|
70
|
|
3
|
moist
|
12
|
12
|
14
|
25
|
125
|
150
|
3.1.3 LMS and Data requirements
Modeling forest stand growth in FVS requires the input of stand variables. These stand variables include average slope, aspect, and elevation, all of which affect how the growth model behaves. Growth model behavior ultimately drives the forest stand volume and harvest piece size, both of which determine harvest re-entry potential and economic return. Each stand grown within FVS gets its stand variables from a LMS portfolio that is built from inventory data provided by landowners and from stand data derived from a number of publicly available sources. Stand data include: digital elevation models, digital line graphs of riparian features including rivers, streams, lakes and swamps, forest cover data, public land survey data, roads data, ortho photo coverage and 7.5 quadrangle maps.
LMS is used to integrate the many data sources and tools used in the analysis. Stand and landscape visualization of the case studies is done using Envision, a USDA Forest Service modeling tool that allows the viewer to 'see' the predicted results of long term management (McGaughey 2000). Tables, charts, and graphs are built using Microsoft Excel© functionality embedded within LMS.
3.2 Management Scenarios
Simulations of multiple harvest options and treatment regimes for both upland and riparian management units for each case study were compared to assess potential economic outcomes. Upland simulations were developed based on typical eastside management regimes that emphasize 20-30 year harvest re-entry periods. In most cases, successive harvests produced continuously lower harvestable volumes until such time as a final 'shelterwood' harvest was simulated to permit the re-establishment of shade intolerant seral species in the understory layer. While each simulation is unique to address the specific stand conditions currently present, all are predicated on maintaining a relatively consistent cash flow over time as well as meeting biological and legislative requirements for site occupancy, tree growth, and harvest adjacency issues. Because of negative harvest values for small diameter trees and narrow margins of return, scenarios did not remove the accumulation of small growth within riparian areas. Merchantability requirements were a significant driver in assessing the timing of re-entry into the stands.
Over a 90 year simulation, planting and natural ingress can be expected to occur. When areas were treated such that planting became a desirable or viable option, trees were planted at densities recommended by eastside practitioners. Natural ingress levels were estimated using a combination of existing understory data, including numbers and species, and habitat type attributes.
3.2.1 Baseline scenario
A baseline performance scenario was created that simulated management requirements for the permanent rules that were in place prior to enactment of the Forest and Fish Rules. By comparing the FFR to a 'baseline' of the permanent rules in effect prior to June 2001, a measure of the incremental impact of the new legislation is possible. The baseline does not consider the parameters included in the emergency rule that was in effect immediately prior to June 2001. Under the baseline, riparian protection was implemented with the parameters outlined in Table 3.1
![]()
| Table 3.1: | Eastern Washington baseline riparian retention requirements (adapted from WAC Chapter 222-30-020, November 1998) |
| 1 | 2 | 3 | 4 | 5 | 6 | 7 |
|
Harvest type
|
Min
RMZ width |
Max
RMZ width |
Average RMZ
width |
Min
harvest diameter |
Minimum number of trees
left > 12" dbh |
Minimum number of trees
left > 4" dbh |
|
Partial cut
|
30'
|
50'
|
N/A
|
Leave all
trees < 12" dbh |
16 conifers 12-
20" and 3 conifers > 20" dbh and 2 deciduous > 16" dbh or 2 conifers > 20" |
75 TPA on boulder bedrock
stream bed types and lakes and ponds or
135 TPA on gravel/cobble stream bed types |
|
Clearcut
(even-aged management) |
30'
|
300'
|
50'
|
Leave all
trees < 12" dbh |
16 conifers 12-
20" and 3 conifers > 20" dbh and 2 deciduous > 16" dbh or 2 conifers > 20" |
75 TPA on boulder bedrock
stream types and lakes and ponds or 135 TPA on gravel/cobble
stream bed types
|
Depending on the stand characteristics, baseline requirements could
also preclude riparian zone harvest. In particular, the minimum
number of trees > 4" dbh had an impact on the harvestable
inventory on some case study sites, particularly if the stream had
a gravel or cobble bottom.
3.2.2 FFR scenarios
Four riparian area management scenarios were evaluated under the FFR rules that included a no riparian harvest option, harvest in the outer zone only, a single harvest entry in the inner zone, and multiple harvest entries in the inner zone. Riparian area treatment simulations were designed to coincide temporally with adjacent upland harvest simulations.
No outer zone simulations were completed if the soil capability classes were IV or V for streams <15" wide or classes III, IV, or V for streams > 15" wide as no outer zone is required in these situations. Case studies 6, 7, 8, and 9 fall into this category. In case studies 5, 7, and 8, the multiple harvest entry scenario was not possible because the stands did not produce sufficient volume and basal area to permit an economically viable second entry over the 90-year simulation period.
3.3 Economic Assumptions and Analysis
Economic analysis looked at discounted cash flows over a 90 year simulation period. This is reported in the tables and figures as the net present value (NPV) of cash flows. Harvests were planned to obtain a relatively even cash flow through time, while recognizing harvest adjacency issues and economies of scale. For landholdings in the 20 - 40 acre size category, the entire holding was harvested at a given interval in keeping with logistically feasible harvest strategies for these small holdings. For some cases, harvest occurred early in the simulation period, whereas others with recent harvest activity had a 20-30 year time lag prior to the first entry. This variability in timing of first entry is reflected in the range of NPV/acre values across the case studies. To calculate the estimated returns the following assumptions were used.
![]()
3.3.1 Annual costs
Annual administrative costs were estimated at $10/acre per year. Forest excise taxes were calculated at 5% for the baseline scenario, and 4.2% for FFR scenarios. Land taxes and forest patrol tax were based on an average estimate of $13/1000 of assessed value.
3.3.2 Layout costs
Where harvest occurred within the inner zone of the riparian area, layout costs accrued. These costs were estimated at $1200/acre and included the cost of the 100% cruise in the inner zone, flagging core, inner, and outer zones, marking inner and outer zone trees where required, and measurement of stream parameters to ensure accurate stream classification. This cost estimate is based on data provided by eastern Washington consultants and SFLO personnel (DeCook 2001).
3.3.3 Harvest Values
Harvest values were derived from the price range for domestic delivered logs reported in the Inland Northwest Market Report, Northwest Management Inc. for the year 2001. These values are given in Table 3.2:
| Table 3.2: | Eastern Washington log prices per thousand board feet (MBF) for 2001 |
|
Species
|
1st quarter
|
2nd quarter
|
3rd quarter
|
4th quarter
|
|
Douglas-fir/ Western Larch
|
380-477
|
330-460
|
380-490
|
360-490
|
|
Grand fir, alpine fir, western hemlock
|
290 -370
|
280-400
|
300-430
|
330-390
|
|
White pine
|
450-525
|
400-525
|
475-625
|
450-600
|
|
Old growth ponderosa pine
|
500-825
|
450-800
|
500-850
|
500-800
|
|
Second growth ponderosa pine
|
350-500
|
300-475
|
352-560
|
350-565
|
|
Spruce
|
275-325
|
200-365
|
325-400
|
300-350
|
|
Western red cedar
|
450-675
|
400-670
|
500-750
|
500-750
|
|
Lodgepole pine
|
300-325
|
200-300
|
352-450
|
330-425
|
|
Pulp
|
25-35/green ton
|
24/green ton
|
25-35/green ton
|
25-35/green ton
|
![]()
3.3.4 Harvest Costs
Harvested logs were bucked and sorted based on size parameters for sawlog, hewsaw, and pulp as well as estimates of falldown taken from case study cruise data. Harvest and silviculture costs were based on interviews with eastern Washington landowners and consultants. These costs are given in Tables 3.3 and Table 3.4.
| Table 3.3: | Eastern Washington harvesting costs (including falling, ground based skidding, processing, loading and hauling) |
|
> 15 MBF/acre
|
$130/acre
|
|
10-15MBF/acre
|
$140/acre
|
|
5-10 MBF/acre
|
$160/acre
|
|
2.5 - 5 MBF/acre
|
$165/acre
|
|
< 2.5 MBF/acre
|
$175/acre
|
|
Hewsaw (small sawlog)
|
$195/acre*
|
|
Pulp
|
$270/acre*
|
| * values calculated from real year 2001 costs/ green ton for hewsaw and pulp multiplied by the Department of Revenue conversions of 6.5 green tons/MBF for small sawlog and 9.0 green tons/MBF for pulp. Harvesting costs for sawlogs are apportioned according to the size of the operation and the relative quality and amount of wood harvested/acre as per recommendations of eastside forest practitioners. Calculations used to derive these values are consistent with costs estimates of the State of Washington, Department of Revenue, Forest Excise Tax Return instructions for July 1 through December 31, 2001 for stumpage valuation areas 6 and 7. |
3.3.5 Silviculture Costs
| Table 3.4: | Post harvest treatment costs: Not all costs were incurred on all acres depending on treatment regime. |
|
Planting (350 trees/acre @ $0.50/tree)
|
$175/acre
|
|
Mechanical site preparation
|
$150/acre*
|
|
Burning site preparation
|
$160/acre
|
|
Thinning
|
$110/acre
|
| *Also fire hazard reduction costs in the absence of pulp harvest |
3.4 Fire Model Assumptions
To assess the potential interaction between fire and the stand conditions in riparian areas under the FFR, a subset of four case study sites were chosen in North Eastern Washington. The subset chosen for the fire analysis met two criteria:
- They fall within the elevation range of the legislatively defined
'Ponderosa Pine habitat type'.
- They are on lands that can be analyzed using the North Idaho (NI) variant of the Forest Vegetation Simulator (FVS) and the Fire and Fuels Extension (FFE) component of that modeling system.
These criteria were essential in the analysis of potential fire impacts on Eastern Washington riparian areas under the FFR for two reasons. First, the FFE has currently been calibrated for the NI variant of FVS and second, the measure of potential fire impacts is not immediately apparent in mixed or high severity fire regimes that might be expected to occur at higher elevations. In addition, the current versions of FVS and FFE have recently (November 21, 2002) been upgraded and improved to facilitate their use inside the Landscape Management System (LMS) framework that has been used to development management scenarios in line with FFR requirements.
![]()
3.4.1 Fire Simulation Methods
Management scenarios were developed that met both the riparian protection criteria of the FFR and a reasonably even-flow of economic return to the landowner. Once these criteria were satisfied, the riparian stands and the upland stands immediately adjacent to the riparian stands were re-simulated with the management scenarios using the FVS-FFE model to assess the potential fire impacts at the end of eight 10 year simulation periods. These fire impacts are reported through LMS on a 10 year cycle for each stand. The stand data were aggregated by zone to assess the relative potential for adverse fire impacts in the core, inner and outer riparian zones in comparison to the impacts in the upland zones immediately adjacent to the riparian area.
The FFE simulations used default parameters calibrated for the NI variant of FVS. The default fuel model parameters are based on stand and site data. As stands change through time, these models are automatically updated to reflect new stand characteristics that result from management, growth, and senescence. Default parameters for severe and moderate fire weather that are built into FFE were used to calibrate fuel moisture conditions and windspeeds used to assess both severe and moderate conditions. All these default parameters can be changed by the modeler, but were not altered for the purposed of this analysis.
4.0 Case Study Results and Discussion
A summary of FFR results is given in section 4.1. This summary illustrates the wide disparity of impacts between cases under the various options available within the forest and fish legislation. The potential economic benefits associated with the Forest Riparian Easement Program (FREP) are given in section 4.2. To illustrate the nuances, or potential areas of improvement under the FFR, a thorough analysis of the results of Case 5 is found in section 4.3. To avoid repetition, detailed results for all remaining case studies are given in Appendix A. Predicted fire outcomes are presented in section 4.4. An alternate planning framework is developed in section 4.5 outlining potential solutions to bark beetle infestation.
4.1 Results under the Forest and Fish Rules
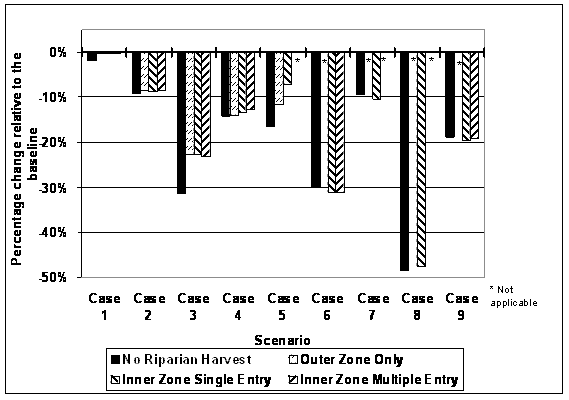
Analysis indicates that the economic losses for case study simulations when compared to the baseline (pre-FFR) range from a 0 to 49% reduction in discounted cash flows (Table 4.1.1 and Figure 4.1.1.). These results are indicative of the potential adverse economic impacts of the FFR on small forest landowners in eastern Washington.
| Table 4.1.1: | Percent change (compared to the baseline) in NPV of cash flows over 90 years without `FRE compensation |
|
Case
1 |
Case
2 |
Case
3 |
Case
4 |
Case
5 |
Case
6 |
Case
7 |
Case
8 |
Case
9 |
|
-2%
|
-9%
|
-31%
|
-14%
|
-17%
|
-30%
|
-9%
|
-49%
|
-19%
|
|
0%
|
-8%
|
-23%
|
-14%
|
-12%
|
N/A
|
N/A
|
N/A
|
N/A
|
|
0%
|
-9%
|
-23%
|
-13%
|
-7%
|
-31%
|
-10%
|
-48%
|
-20%
|
|
0%
|
-9%
|
-23%
|
-13%
|
N/A
|
-31%
|
N/A
|
N/A
|
-19%
|
Economic losses toward the high end of the scale occurred in situations where streams were reclassified from non-fish bearing to fish bearing as in case 3 or where there are significant water resources found within the study area as in case 6. Size of landholding was not a proxy for impact as case 6 is the largest in the study at 825 acres and case 3 is the smallest at 20 acres. In case 1 an inadequate number of trees > 10" dbh restricted harvest to approximately the same degree under the baseline and FFR rules, resulting in a 0-2% variation in economic value under either rule depending on harvest scenario.
![]()
 |
|
| Figure 4.1.1: | Percent change (relative to the baseline) in the NPV of forest management cash flows over 90 years under the Forest and Fish Rules. Case 6 -9 are low site classes with no requirement for an outer zone. Cases 5, 7 and 8 have no economic opportunity to re-enter the inner zone after the initial entry. |
4.2 Results under the Forest Riparian Easement Program
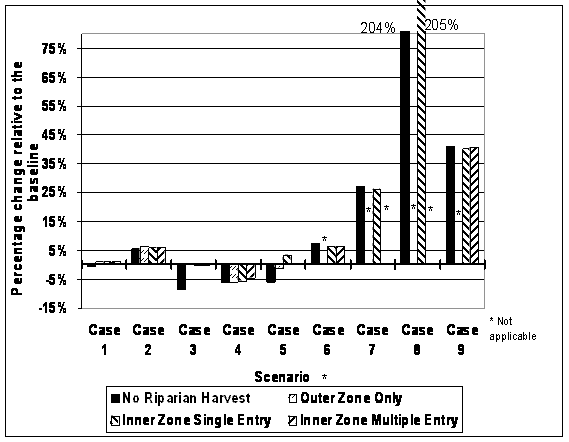
Under the FREP, landowners are offered compensation for a percentage of the stumpage value of trees left uncut to meet FFR requirements in exchange for entering into a 50-year commitment or "easement" to leave these trees unharvested. In 7 of 9 cases, economic losses can become gains if the landowner qualifies for and chooses to participate in the FREP, as indicated by the positive values noted in Figure 4.1.2 and Table 4.1.2. This positive result is particularly apparent under high impact over-ride situations as defined in section 2.4.
| Table 4.1.2: | Percent change (compared to the baseline) in NPV of cash flows over 90 years with FRE compensation |
|
Case
1 |
Case
2 |
Case
3 |
Case
4 |
Case
5 |
Case
6 |
Case
7 |
Case
8 |
Case
9 |
|
-1%
|
5%
|
-9%
|
-6%
|
-6%
|
7%
|
27%
|
204%
|
41%
|
|
1%
|
6%
|
0%
|
-6%
|
-1%
|
N/A
|
N/A
|
N/A
|
N/A
|
|
1%
|
6%
|
0%
|
-6%
|
3%
|
6%
|
26%
|
205%
|
40%
|
|
1%
|
6%
|
0%
|
-5%
|
N/A
|
6%
|
N/A
|
N/A
|
41%
|
|
|
![]()
 |
| Figure 4.1.2: | Percent change (relative to the baseline) in the NPV of forest management cash flows over 90 years under the Forest and Fish Rules with compensation from the FREP included. The FREP includes compensation for timber that would not have been harvested under the baseline case. |
As with the FFR, the case by case variation of impacts is equally
apparent under the FREP. This variability is illustrated in case
7 where baseline harvest was prohibited because of inadequate tree
count as in case 1. However, because of differences in tree sizes
between the two cases, for case 7 the relative economic benefit
of the FREP is substantial. Positive values under the 'No Riparian
Harvest' scenario arise when harvest activities at a normal re-entry
period in adjacent upland stands occur at a point that riparian
stands have not met the minimum basal area or tree count required
for stand entry. This outcome is particularly apparent in drier
ecosystems where basal area increase takes a substantial time period
or where stands have high tree densities, but few trees exceeding
10" dbh.
Positive values relative to the baseline occur because landowners
would be compensated for the value of all timber they are required
to leave under the FFR, whereas under baseline rules that included
stream protection and shade criteria, no such compensation had been
available. This finding is consistent with the results of a recent
Department of Revenue (DOR) study that compares the value of riparian
leave trees to the forest excise tax credit (Rice et al. 2002).
The DOR report indicated that the value of timber left in riparian
areas in eastern Washington was 65% attributable to requirements
under the baseline rules and only 35% attributable to requirements
under the FFR. These eastern Washington harvester results include
large and small holdings. If only small harvesters are considered,
riparian timber values accounted for 49% the value of residual timber
under the old rules. The small harvester figure applies to all Washington
regions, not just eastern Washington. Thus, while impacts to small
landowners in eastern Washington cannot be definitively determined
from these results, the implication is that somewhere between 49%
and 65% of the value of riparian timber that must be left under
the FFR, was also required to be left under the baseline. Payment
for this timber, particularly in high impact over-ride situations,
accounts for the positive economic results under the FREP for the
majority of the case studies.
Optimal scenarios vary depending on the landowner's choice of participation
in the FRE Program and the site and stand characteristics within
riparian areas. Values in Table 4.1.3 identify the best economic
outcomes by case under FFR, both with and without enrolling the
lands in the FREP.
![]()
| Table 4.1.3: | A comparison of the possible changes in economic return to the landowner under FFR if a Forest Riparian Easement is taken on all riparian stands. |
|
Case
1 |
Case
2 |
Case
3 |
Case
4 |
Case
5 |
Case
6 |
Case
7 |
Case
8 |
Case
9 |
% Change in NPV with no FREP compensation |
-2%
|
-8%
|
-23%
|
-13%
|
-7%
|
-30%
|
-9%
|
-48%
|
-19%
|
% change in NPV with FREP compensation |
1%
|
6%
|
0%
|
-5%
|
3%
|
7%
|
27%
|
205%
|
41%
|
4.3 Specific impacts of FFR - Case study example
The most significant result of the analysis is the wide disparity of impacts that can occur when applying a consistent set of rules to forest riparian management for small forest landholdings in eastern Washington. While the sampling methodology and sample size are inadequate to derive statistical relationships, these nine cases are illustrative of real world results of the regulatory impact of the FFR. To better understand what might occur on a single ownership, an 'average' impact case was chosen to illustrate how and why specific impacts might occur under the FFR and FREP. Case study 5 was chosen for illustrative purposes as it is neither wet nor dry; low elevation nor high elevation; has some water, but not a relatively high percentage of water; has north, south, and west aspects along with flatter areas; and has a mix of management regimes and potentials that are common in eastern Washington. An aerial view of the property is given in Figure 4.3.1.
Case study 5 is located in Stevens County. The average elevation
for this case study is 2473 feet; only 27 feet lower than the threshold
for rule changes between low and mid elevation forests. Riparian
areas are classified as Site Class III or medium sites according
to the soil survey of Stevens County (USDA SCS 1982). Overall statistics
for the property are given in Table 4.3.1.
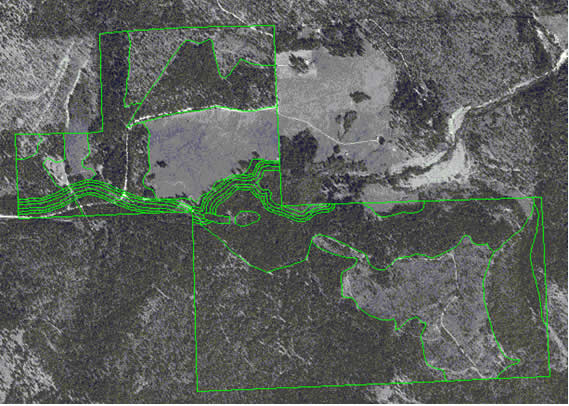 |
| Figure 4.3.1: | Digital ortho-photo of Case Study 5. There is a stream adjacent parallel road along the middle portion of the stream. Farmland within the ownership boundary is excluded from the analysis. |
![]()
| Table 4.3.1: | Case Study 5 acreage. |
|
468.9
|
|
|
15.4
|
3.30%
|
|
||
|
8.7
|
1.80%
|
|
9.6
|
2.00%
|
|
6.2
|
1.30%
|
|
4.2
|
0.80%
|
|
28.7
|
6.10%
|
There is wide variability in ecological habitat type over the case study area. Riparian areas were modeled using the Abies grandis/Clintonia uniflora (Grand fir/beadlilly) habitat type, while most upland stands were modeled using the Psuedotsuga menzeisii/ Physocarpus malvaceus (Douglas-fir/ninebark) and Psuedotsuga menzeisii/ Symphoricarpus albus (Douglas-fir/snowberry) habitat types. A sensitivity analysis determined that stand volume and consequent value was affected by choice of modeled habitat type. This factor was controlled between scenarios to ensure that the effects were from treatment options rather than inherent growth model variation. This variation across habitat types can be used to derive suitable alternate plan scenarios as will be discussed in section 4.5.
Riparian stands on case study 5 are characterized by densely stocked western red cedar stands that had established from advance growth under an original ponderosa pine, larch, and white pine seral stand. Understory vegetation is sparse to non-existent from almost complete shading by overstory trees. Where small openings exist, they typically have a dense canopy of advance regeneration cedar and western hemlock. By virtue of their stage of ecological development, the riparian stands have some management challenges. Because the existing stand developed under a seral overstory, trees tend to be short, with relatively large diameters. Height growth rates were low which had prompted the landowner to delay harvest for the past 15 years to allow some value to accumulate on the stands, with the intent to clear the area and replant to shade intolerant ponderosa pine, whitepine and larch as had occurred during the last natural disturbance cycle. With the advent of prior forest practices rules, this plan was altered to reflect a new stream classification level and legislative limits. With the enactment of the FFR, this plan was further altered to reflect an increasing level of riparian protection. What is left along the riparian area now is reflective of an interaction of past legislative requirements to maintain all trees < 12" and prior management practices which took high value overstory trees with the expectation that the understory would become the next crop. This history, which is very common in eastern Washington, has produced forest conditions that are not reflective of historic conditions. By arresting stand development in its current state, the ability to address the environmental risks created by historical management and policy directives, is severely hampered.
While the FFR permits multiple stand entries to address insect, disease, and fire risks, the requirement to meet basal area limits of 60 square feet per acre (ft2/ac) with a minimum tree count of 50, including the 21 largest trees, results in the post harvest stands carrying a significantly higher level of basal area than envisioned under the rules. This higher basal area retention effectively eliminates understory development of seral species and severely curtails recruitment of understory trees as replacements to meet riparian functional requirements. For case study 5, the end result is that the riparian stands may only be entered once over a 90 year simulation period under FFR rules.
Under FFR, harvest levels are reduced by 671 MBF relative to the baseline over the 90 year period as indicated in Table 4.3.1 and Figure 4.3.2. This is in addition to loss of timber value occurring under prior rules. Because pulp has a negative value using the 2001 pricing schedule used for this analysis, no pulp was counted in the harvest volume. Excluding pulp volume may inflate estimated net present value figures found in Figure 4.3.3 and Table 4.3.2, though a consistent application of this pulp exclusion ensures that the relative position of each scenario would remain the same.
![]()
| Table 4.3.1: | Total commercial harvest volume (MBF) over the next 90 years for Case Study 5. |
|
Harvest Volume
|
|||
|
Pulp
|
Hewsaw
|
Sawlog
|
|
0
|
4,958
|
12,580
|
|
0
|
4,725
|
11,764
|
|
0
|
4,598
|
12,071
|
|
0
|
4,636
|
12,231
|
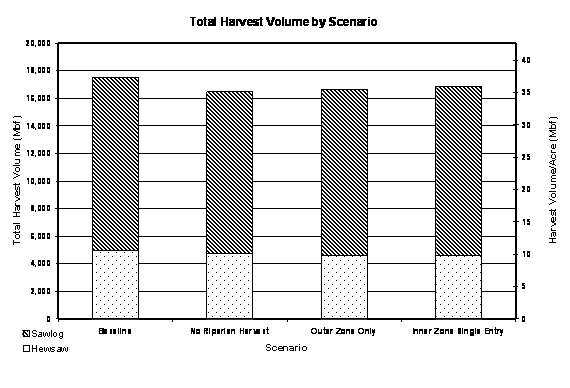 |
| Figure 4.3.2: | Harvest volume by scenario for Case Study 5. Pulp values are not included as pulp is not merchantable at this time. |
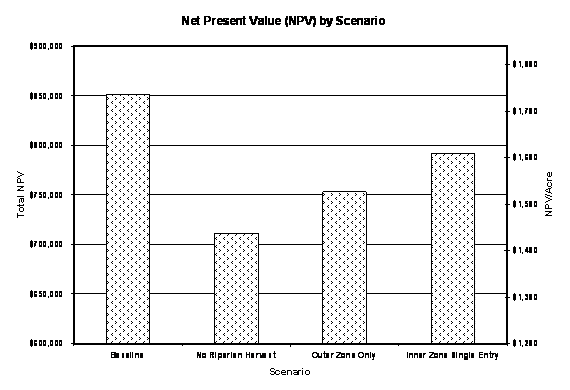
| Table 4.3.2: | NPV of cash flows over the next 90 years for Case Study 5. |
|
NPV
|
NPV with Easement
|
|||||
|
Scenario
|
Total
|
Per Acre
|
% Change
|
Total
|
Per Acre
|
% Change
|
|
$851,798
|
$1,816
|
$851,798
|
|||
|
$711,232
|
$1,516
|
-17%
|
$799,848
|
$1,705
|
-6%
|
|
$753,102
|
$1,606
|
-12%
|
$841,718
|
$1,795
|
-1%
|
|
$791,502
|
$1,688
|
-7%
|
$880,117
|
$1,876
|
3%
|
![]()
 |
| Figure 4.3.3: | NPV by scenario for Case Study 5. To meet the inner zone TPA requirement, 73-90 square feet of basal area was retained in the first riparian entry. The species composition and retention level precluded the development of merchantable regeneration over the entire simulation period. |
Under the FREP, case 5 can regain the economic losses resulting from both the FFR and the prior rules. This gain occurs because the significant level of retention that was required along this stream under the baseline rules is compensated for under the FREP. The discounted NPV over 90 years under the baseline was $1816/ac while under the most advantageous FFR scenario with FREP funding it is $1876/acre. Visually this is apparent in Figure 4.3.4. Overall, if this landowner chooses, the optimum economic solution is to enter the riparian zone once and take a FREP for the remaining timber value for an overall 3% gain in NPV over a 90 year time frame relative to baseline conditions (Figure 4.3.5). However, this optimum solution does depend on adequate funding for the FREP in the biennium that the initial riparian harvest occurs.
Given the stand history and current condition, taking a FRE may not be the best biological choice in the long run. It also may not be economically optimal, if the opportunity costs of lost productivity are factored in by keeping slow growing species on a site that can produce high value species in much shorter time frames. In fact this landowner indicated an interest in alternate planning to address biological conditions. As such, case 5 will be revisited in the alternate planning section.
![]()
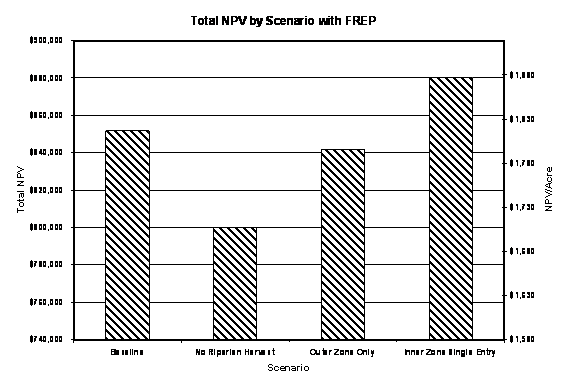 |
| Figure 4.3.4: | NPV with FREP by scenario for Case Study 5. |
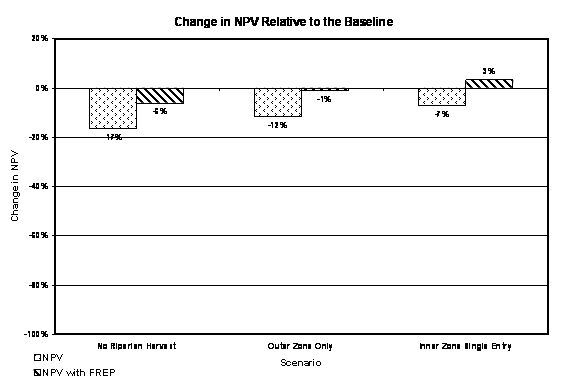 |
| Figure 4.3.5: | Percent change (compared to the baseline) in NPV of cash flows over 90 years for Case Study 5. There is sufficient volume in the inner zone to make it economically viable to enter once. Further re-entry generates a negative economic return. The FREP does mitigate the impact of the FFR as well as some losses incurred under the baseline if an inner zone entry is conducted. |
![]()
4.4 Fire Simulation Results
4.4.1 Riparian simulations
Four cases were chosen to demonstrate the potential impacts of wildfire on riparian zones in low elevation eastern Washington forests. These cases were all in Stevens and Pend Oreille Counties. For consistency, FFR treatment regimes were used in this analysis to test the potential impacts that might occur under average management conditions. Alternative treatment regimes to attain fire safe conditions were not specifically designed because economic returns from removing understory were negative under those regimes.
Of the four possible simulation options, scenarios that simulated harvest in the inner zone were chosen to test the potential fire mortality outcomes that might result under application of the FFR. Potential basal area mortality was predicted for each stand for each decade using the FVS-FFE default parameters for high severity fire conditions (i.e. wildfire conditions). The FVS-FFE model predicts mortality based on the standing tree inventory for a specific decade with no assumption of carryover mortality to future decades. This system permits prediction of fuel build-up over time under different management regimes and estimation of basal area mortality in a given decade assuming no fires have occurred at any time prior in the simulation. Because fire is generally a landscape level event, the individual stands were averaged and grouped into riparian and upland zones for each time period of the simulation. The series of four graphs in Figure 4.4.1 indicate the potential basal area mortality in riparian stands for the four case studies under consideration if a fire were to occur in any given decade.
 |
 |
 |
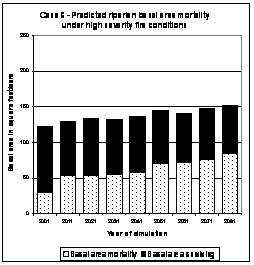 |
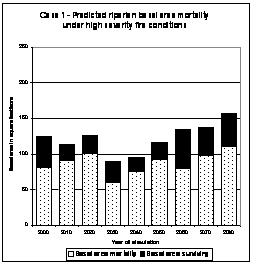
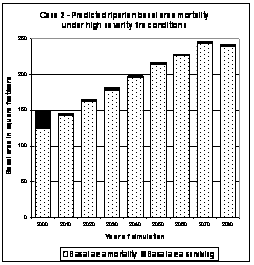
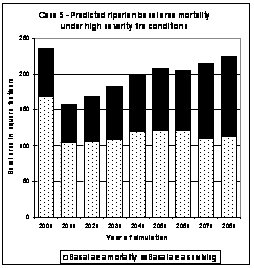
| Figure 4.4.1: | Basal area mortality in riparian stands by decade using high severity fire parameters of 20 mph winds, 70°F temperature, and very dry moisture conditions. |
![]()
Each case shows wide variability in overall stocking and mortality, but general trends indicate that mortality exceeds survival in all decades for cases 1, 2, and 5. Mortality exceeds survival approximately 50% of the time for case 6.
In cases 1, 2 and 5 the riparian forests are dominated by shade tolerant, but fire intolerant species. These stand conditions are a result of partial overstory harvests at some point in the past. In addition, since 1988, riparian harvests were limited to removal of a portion of the dominant, large diameter trees, thus maintaining and establishing riparian stands largely composed of densely stocked shade tolerant species in smaller diameter classes. Differences in basal area mortality between cases 1, 2 and 5 can be attributed to the diameter distribution and understory conditions within the stands. Where stratified canopy layers are combined with high basal area, as in case 2, potential mortality is maximized. In contrast, where densely stocked stands have precluded understory as in cases 1 and 5, predicted mortality is lower. Differentials in mortality between case 1 and 5 are a result of the differences in diameter distribution between the cases. Case 5 survivorship is concentrated on a few very large individuals in the stands, while case 1 survivorship is in a smaller diameter component of more fire resistant species.
In contrast to the other 3 cases, riparian forests in case 6 are characterized by an overstory of large diameter fire resistant species. There is an understory component in these stands that experiences significant mortality, but fire conditions are predicted to remain as surface fires or passive crowning fires for much of the simulation time period. Active crowning fires are not predicted to occur in most of the stands comprising the riparian area until the 5th decade. After the 5th decade these riparian stands begin to experience more than 50% basal area mortality.
Under the FFR requirements, several common situations occurred within the four case study sites. First, the harvest re-entry limit of a minimum 110 square feet of basal area in the riparian zone in trees greater than 6" dbh did result in some instances where treatments could not occur in the riparian zone at the time the upland stand was treated. Future riparian treatments were delayed until the next harvest re-entry period which was 20 or 30 years into the simulation. In some instances these stands had a significant understory component as could be expected given historic legislative requirements to leave all trees < 12" dbh along with an overstory component (WAC 222, 1998). The trend in potential fire impacts in the 2 to 3 decades without understory treatment was toward higher mortality in the riparian stands as a whole.
The 21 largest tree requirement always resulted in the retention of at least a portion of the canopy containing fire intolerant species such as western red cedar, grand fir and spruce. The retention of large diameter fire intolerant species in concert with the basal area outcomes generally precluded the long term development of fire tolerant stand conditions.
The dual requirement of basal area and tree count often resulted in the retention of much higher basal areas than the minimum required to meet the rule. This higher basal area retention level effectively precluded the establishment of seral understory species. The outcome was often the development of a dense understory of shade tolerant species that contributed to the ladder fuels between surface and crown within the stands.
4.4.2 Upland Simulations
The series of four graphs in Figure 4.4.2 indicate the potential basal area mortality in upland stands for the four case studies under consideration. As areas of regeneration cuts are included in the upland the overall basal area is much lower than in riparian stands. The individual upland stands had highly variable fire potential mortality rates through time because management action affected the number and kind of stand structural stages present at any one time. Because the entire ownership was managed to produce a relatively even flow of harvest value over time while addressing adjacency issues, in any given decade at least some stands on the landscape are predicted to survive a wildfire of
![]()
 |
 |
 |
 |
| Figure 4.4.2: | Basal area mortality in upland stands by decade using high severity fire parameters of 20 mph winds, 70°F temperature, and very dry moisture conditions. |
the magnitude that was simulated. The averaging of all stands and structural stages in Figure 4.4.2 reflects what the outcome might be over the landscape, as opposed to individual stands within the landscape.
In comparing riparian to upland conditions, the fire simulations suggest that fire mortality would be significant in both parts of the landscape but that the heterogeneity created through upland management results in discontinuous impacts, both spatially and temporally. Riparian areas would experience slightly greater percentage losses of basal area than upland areas overall. Riparian areas are predicted to experience losses exceeding 50% of the total basal area in most years and on most stands. Upland stands have a much wider range of predicted losses, with an overall loss of less than 50% for 30-50% of the 90 year simulation period. This simulation period was taken to coincide with the simulation period used for the economic analysis. While it is expected that fire impacts will change through time, the trends in potential fire risk as a result of FFR management regimes indicate that risks from fire cannot adequately be addressed within the current framework.
The simulations indicate that the stated FFR intent to provide opportunities for creating fire safe outcomes is not probable because current stand conditions coupled with allowable and economically viable treatments are not conducive to creating a trajectory of stand development that moves the stands toward a fire safe condition envisioned in the FFR. Under current conditions thinning from below to reduce ladder fuel build-up in the understory incurs substantial economic costs to the landowner. To alter these fire risk outcomes requires a change in current economic value for small diameter wood such that thinning from below becomes economically viable.
4.5 Alternate plans
Given the negative economic outcomes under FFR and the funding uncertainties under the FREP, pursuing an alternate plan may be a logical choice for landowners. Alternate plans (AP) are sanctioned within the framework of the FFR (WAC 222-12-040) to permit treatments that are at least as effective as the FFR in meeting riparian functional requirements, while allowing flexibility in meeting small landowner objectives. For landowners to pursue AP, they must provide economic relief, while providing administrative flexibility and reducing the risks and uncertainty inherent in forest management decisions. In particular, addressing the risks and/or impacts of common disturbance agents such as insects, disease, and fire are reasons for pursuing an AP. Depending on the specific goals and conditions found on the land, a number of approaches to AP can be taken. If vectors such as root disease are prevalent, a strategy that moves the stand from susceptible to non-susceptible species may be optimal. If the riparian stand is at risk from fire, then both alterations of stand structure and species composition may be required. If the stand is at risk from insect attack, measures to alter stand structure, density, and growth patterns to limit losses are preferred.
As alternate plans contain 3 specific elements, namely riparian function, economic viability, and biological limitations, it is necessary to determine the role of each element. To determine an appropriate methodology for developing AP for eastern Washington it is essential to understand the biological limits of systems for a given disturbance vector. For illustrative purposes, the biological conditions that precipitate insect infestations are explored to determine the most appropriate approach for alternate planning under such circumstances.
4.5.1 Biological Criteria determining insect infestation:
Controlling for insects and disease is often not possible through density manipulation, except in the case of mountain pine beetle (MPB) and perhaps western pine beetle (Dendroctonus brevicomis LeConte) (Cochran et al. 1994). Literature on MPB risk and susceptibility indicates that stands move into the range of susceptibility to insect infestations at approximately 80-100 ft2/ac of basal area (Cochran 1988, Cochran et al. 1994, Larsson et al.1983, Schmid 1988). Mitchell et al. (1983) suggest that thinning to 10-20 m2/ha (44 - 87 ft2/ac) would be sufficient to increase tree vigor and resistance to bark beetles in lodgepole pine. Olsen et al. (1996) suggests that MPB attack is reduced when there is minimal variability in diameter among adjacent trees. When examining the potential for insect attack, the literature indicates that variability in site quality also drives insect infestation with drier and poorer ecosystems experiencing mortality at lower stocking levels (Cochran 1992). Vigor indices indicate that for low site classes, the lower limit of susceptibility is approximately 85 ft2/acre (Cochran 1988). Given that the threshold of bark beetle susceptibility is between the upper and lower basal entry limits for inner riparian zone management in the FFR, managed riparian stands will remain very close to this limit or in many cases exceed it under the FFR as demonstrated in Figure 4.5.1. Stands will exceed this limit, even at completion of harvest, when the combination of minimum tree count and 21 largest tree requirement result in basal area retention exceeding 85 ft2/acre of basal area. Basal area growth between harvest entries will always exceed this limit of susceptibility because re-entry is not permitted until the upper basal area limit established under FFR is reached.
![]()
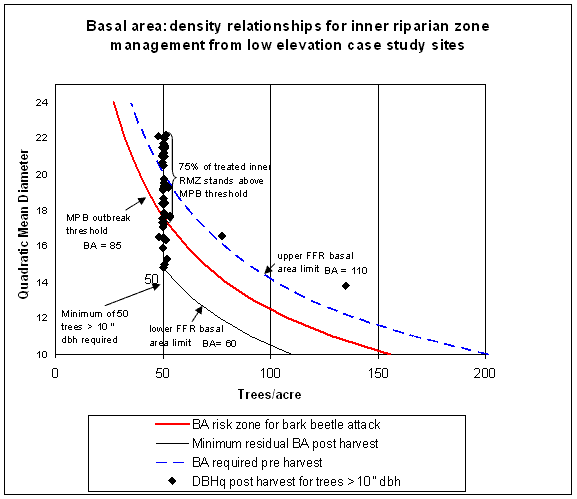 |
| Figure 4.5.1: | Basal area distribution post harvest for riparian inner zones in low elevation case study sites under the FFR. |
Figure 4.5.1 illustrates the actual quadratic mean diameter, and basal area for all inner zone low elevation case study stands once treatment is completed to the extent allowed under FFR. Two stands where the minimum tree count > 10" dbh occurred because of non-merchantable and deciduous components greater than 10" dbh. The lowest isoline represents the lower basal area limit for trees > 10" dbh. This line is truncated at 50 trees/acre to account for the minimum tree count required under FFR. The middle line represents a basal area of 85 ft2/ac which is the competition level where MPB infestation begins to manifest in a stand. The upper line represents the basal area limit that must be reached prior to harvest entry. Figure 4.5.1 indicates that the multiple limits on trees per acre, size distribution, and basal area for inner zone management results in increased risk of MPB infestation in over 75% of the low elevation inner zone stands if they are of susceptible tree species. Stand growth after harvest will exacerbate this trend as basal area increment increases in the residual stand.
The same kinds of relationships apply for mid elevation stands as for low elevation stands, though there are 3 upper and 3 lower limits to reflect site class differences acknowledged under the FFR. From Figure 4.5.2 it is apparent that the majority of treated riparian inner zone stands have basal areas exceeding the 85 ft2/ac outbreak threshold for MPB infestation. However, more data is required to clarify the MPB threshold relationships for mid elevation stands as moister and richer sites could be expected to support higher basal areas without triggering the stress factors that lead to MPB infestation.
![]()
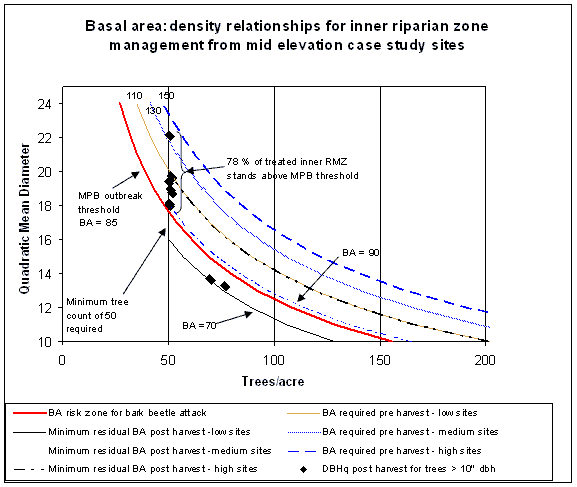 |
| Figure 4.5.2: | Basal area distribution post harvest for riparian inner zones in mid elevation case study sites under the FFR. |
In both Figures 4.5.1 and 4.5.2 only trees exceeding 10" dbh are considered. In many instances a component of small diameter trees were not removed, either to facilitate a second stand entry at a later time or because it was un-economic to do so. The presence of an understory may exacerbate risk of insect attack on the required leave trees due to increased competition for site resources. However, the impacts of multi-storied canopies on relationships between MPB and the host species are not as clearly defined as those in even-aged stands. The presence of the small diameter trees increases basal area above insect attack thresholds as illustrated in Figures 4.5.3 and 4.5.4.
![]()
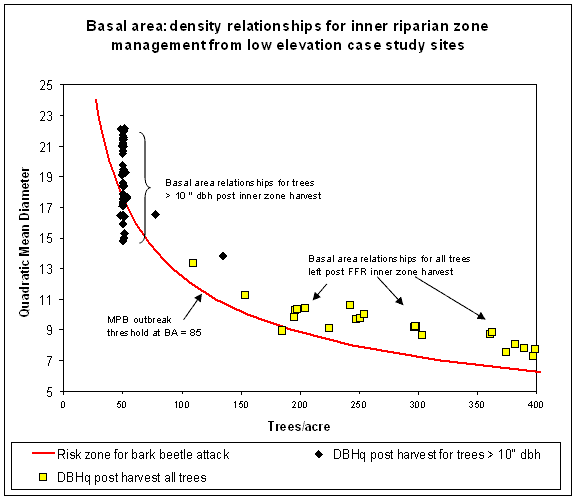 |
| Figure 4.5.3: | Basal area distribution of low elevation riparian inner zones in case study sites under FFR, including trees < 10" dbh. |
Figure 4.5.3 illustrates the actual stocking levels post harvest for low elevation inner zone case study sites harvested to the specifications of FFR. Large understory components that were not economical to remove increased the residual basal area substantially in some stands. The intent was to re-enter these high basal area stands once these trees became merchantable and thus could be economically removed. In Figure 4.5.4 the actual stocking levels post harvest for mid-elevation inner zone stands are depicted in similar fashion.
![]()
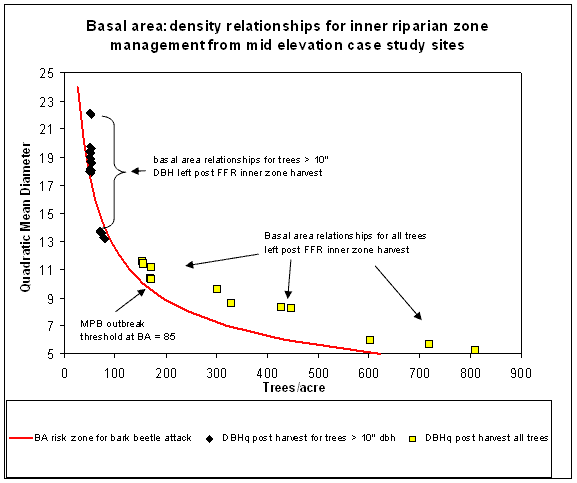 |
| Figure 4.5.4: | Basal area distribution of mid elevation riparian inner zones in case study sites under FFR, including trees < 10" dbh. |
Given the types of outcomes depicted in Figures 4.5.1-4, there are clear opportunities for implementing AP that alter stand density, insect vector relationships while still meeting economic and riparian functional requirements. When implementing AP, the appropriate tree densities to address MPB risk must consider "stockability". Stockability refers to the inherent biological carrying capacity of the site which can be inferred from the plant association or 'ecological' habitat type (Hall 1973, Cochran et al. 1994, Fiedler et al. 1988). Stockability measures are derived relative to 'normal' or full stocking using site index (SI), maximum stand density index (SDI), and growth basal area (GBA) (Cochran 1994). Using these stand metrics and the ecological habitat types prevalent for ecosystems in the case studies, the maximum stocking levels and related insect infestation levels by ecological habitat type group are defined in Figure 4.5.5 for ponderosa and lodgepole pine. The ecological habitat types found in the study area have been grouped based on similarities in maximum stocking levels. These groups have been identified as "LP" for lodegepole pine ecological habitat types, "DF med" for Douglas-fir ecological habitat types with medium moisture regimes, and "PP med" and "PP dry" for ponderosa pine ecological habitat types with medium and dry moisture regimes.
![]()
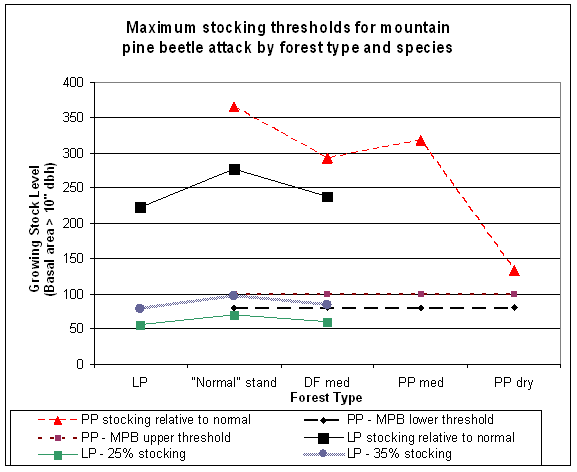 |
| Figure 4.5.5: | Relationship between forest type and maximum potential stocking as a function of ecological parameters including moisture and habitat type. |
The 25% and 35% isolines for lodgepole pine are derived from an integration of concepts of site carrying capacity from Cochran (1994) and the non-linear relationships of MPB attack as elucidated in Anhold and Long (1996). Anhold and Long determined that MPB attack in Lodgepole pine occurred at intermediate densities of between 25 and 35% of maximum SDI. Their values for 25 and 35% of SDI were 140 and 245 respectively which are considerably higher than the values derived when considering SDI as a function of habitat types found in the case studies. Further refinement of this concept is warranted. The 80 - 100 ft2/acre isolines indicate the area where MPB infestation becomes likely for ponderosa pine stands where the average diameter exceeds 8-10" (Schmid 1988, Olsen et al. 1996, Schmid and Matta 1992, Cochran 1992, Larsson et al. 1983, Cochran et al. 1994). The types of relationships between inherent carrying capacity of low productivity sites and insect attack identified in the figures and literature would indicate that AP on low productivity sites should look at maintaining lower basal areas than those that occur under the FFR criteria, given current stand conditions and the outcomes of simulations. To integrate these insect parameters into riparian functional requirements, it is necessary to consider one additional metric: stand density index or SDI.
4.5.2 Riparian Functionality under Alternate Planning Scenarios:
Stand density index (SDI), as given by the equation SDI = TPA(DBHq/10)1.6, gives a relative density measure of the number of 10" trees/acre of land (Reineke 1933). Calculating a SDI for the FFR riparian requirements of 50 TPA> 10" and a basal area of 60 square feet/acre gives a SDI value of 95; that is the minimum stand density post harvest under FFR is equivalent to 95, 10" dbh trees/acre. By using SDI as a minimum value for riparian functionality we can eliminate the double floor created by considering a minimum TPA and a minimum basal area (BA) (which is a function of TPA and quadratic mean dbh (DBHq)). If the minimum acceptable target SDI is 95, and only trees >10" dbh can be considered acceptable in meeting riparian functional requirements, the options for meeting those requirements can be expanded by considering the dual metrics of stand density (TPA) and quadratic mean diameter (DBHq). Table 4.5.1 outlines the relationship between these metrics in meeting the SDI goal of 95. It should be noted that in all cases the basal area for a SDI of 95 is below the threshold for MPB infestation for either ponderosa or lodgepole pine.
![]()
|
SDI
|
TPA
|
DBHq
|
BA
|
|
|
95
|
95
|
10
|
52
|
|
|
95
|
82
|
11
|
54
|
|
|
95
|
71
|
12
|
56
|
|
|
95
|
62
|
13
|
58
|
|
|
95
|
55
|
14
|
59
|
|
| FFR |
95
|
50
|
14.9
|
60
|
|
95
|
50
|
15
|
61
|
|
|
95
|
45
|
16
|
63
|
|
|
95
|
41
|
17
|
64
|
|
|
95
|
37
|
18
|
66
|
|
|
95
|
34
|
19
|
67
|
|
|
95
|
31
|
20
|
68
|
|
|
95
|
29
|
21
|
70
|
|
|
95
|
27
|
22
|
71
|
|
|
95
|
25
|
23
|
72
|
|
|
95
|
23
|
24
|
74
|
Depending on site and stand characteristics, an AP may be developed
to create few very large diameter trees in instances where open
stand conditions would best meet management objectives, or conversely,
a large number of smaller (10-14") diameter trees where a higher
stocking density is required to address a specific management concern.
Which option to choose would be driven by a combination of biological
and economic objectives.
4.5.3 Integrating all variables into Alternate Planning Scenarios:
Four case studies were chosen to examine potential alternate planning scenarios as permitted by the FFR under WAC 222-12-0401 (2001). These alternate planning scenarios arose because some biological feature or constraint suggested that an alternate planning strategy would optimize management objectives beyond what could be accomplished under the FFR. Three cases were used to examine MPB consequences, while the fourth looked at re-establishing seral species. The case studies chosen for alternate planning scenarios specifically related to MPB risk are cases 7, 8 and 9. Case 7 is a mid elevation site in Okanogan County that continues to experience mortality from mountain pine beetle. Cases 8 and 9 occur in very dry ecosystems in Whitman County.
Mortality and growth rate declines were apparent in the simulation results for these dry, poor ecosystems with declines occurring once the stands exceed 80-90 square feet of basal area/acre. This decline is consistent with the literature which indicates that growth rates, as determined by basal area increment, decline at these stocking levels (Fiedler 1988, Larsson et al. 1983, Mitchell et al. 1983). For stands that exhibited significant declines in growth rates once reaching threshold values of 80-90 square feet of basal area, alternative strategies were targeted to maintain a Stand Density Index (SDI) of approximately 95, with some flexibility as to the minimum basal area and number of residual trees greater than 10" dbh.
Using a SDI of 95 as a minimum acceptable value, alternate plan scenarios for cases 7, 8, and 9 were created using existing stand data and growth conditions. Alternate plan management regimes targeted the retention of approximately 50 trees > 10" dbh and 50-60 square feet of basal area to address riparian functional requirements, without the limits on diameter distribution, minimum tree size, and minimum upper limit for stand re-entry. This flexibility to remove very large diameter trees, while still retaining a larger number of trees with appropriate characteristics for riparian function was seen as a reasonable trade-off to reduce basal area and subsequent insect infestation risk while maintaining riparian integrity, shade potential from overstory trees and relatively large diameter trees for large woody debris recruitment.
For alternate planning simulations on cases 7, 8, and 9, stand entry occurred prior to meeting the required upper basal area limit. An analysis of stand metrics at the point of harvest completion yield the range of values given by case in Tables 4.5.2, 4.5.3, and 4.5.4. If a proxy for eastern Washington riparian function is given by the 50 TPA > 10" and 60 square feet of basal area which is equivalent to a stand density index (SDI) of 95, then these riparian stands largely meet or exceed that goal.
![]()
| Table 4.5.2: | Range of riparian stand metrics over a 90 year simulation period for Case 7 |
|
metric
|
Ave dbh
|
DBHq
|
DBHq
>6" dbh |
TPA
|
TPA >6" dbh
|
Height of tallest 40 TPA
|
TBA
|
SDI
|
standing MBF/acre
|
harvested MBF/acre
|
| average |
6.5
|
8.2
|
11.9
|
176
|
75
|
77.4
|
58.2
|
116
|
6983
|
11069
|
| max |
10
|
10.9
|
14
|
282
|
117
|
86.3
|
66.5
|
141
|
9165
|
17370
|
| min |
3
|
5.8
|
9.8
|
93
|
49
|
71.4
|
51
|
97
|
5640
|
2934
|
| Table 4.5.3: | Range of riparian stand metrics over a 90 year simulation period for Case 8 |
|
metric
|
Ave dbh
|
DBHq
|
DBHq
>6" dbh |
TPA
|
TPA >6" dbh
|
Height of tallest 40 TPA
|
TBA
|
SDI
|
standing MBF/acre
|
harvested MBF/acre
|
| average |
9.3
|
12.6
|
18.4
|
86
|
42
|
72.2
|
67.2
|
113
|
16239
|
5872
|
| max |
14.9
|
16.8
|
25.8
|
129
|
70
|
88.1
|
79.3
|
126
|
19519
|
7661
|
| min |
5.7
|
9.9
|
11.8
|
43
|
18
|
56.5
|
54.1
|
96
|
11285
|
3019
|
| Table 4.5.4: | RRange of riparian stand metrics over a 90 year simulation period for Case 9 |
|
metric
|
Ave dbh
|
DBHq
|
DBHq
>6" dbh |
TPA
|
TPA >6" dbh
|
Height of tallest 40 TPA
|
TBA
|
SDI
|
standing MBF/acre
|
harvested MBF/acre
|
| average |
7.4
|
8.9
|
11.9
|
140
|
76
|
78.7
|
58
|
112
|
7643
|
13307
|
| max |
10.2
|
10.5
|
15.1
|
181
|
88
|
87.7
|
60
|
121
|
9673
|
14886
|
| min |
6
|
7.4
|
10.3
|
91
|
47
|
70
|
53.7
|
98
|
6306
|
12164
|
In assessing what these outcomes look like over a 90 year simulation period, it is instructive to compare biological outcomes under FFR and AP scenarios. Figure 4.5.6 shows these relationships for case study 7. What is apparent for case study 7 is that the alternate plan is much more likely to address a currently existing MPB infestation than the FFR. This type of stand condition becomes a proxy for a suitable AP template that could be applied for many situations where stocking control is desirable to avoid the unintended consequences of MPB infestation within riparian zones.
![]()
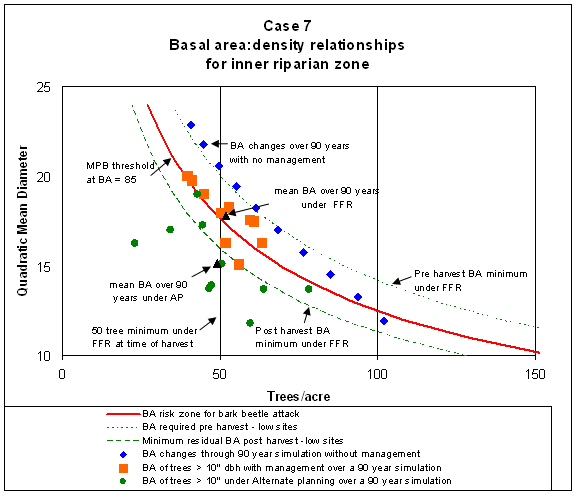 |
|
Figure 4.5.6:
|
area relationships under AP and FFR scenarios
for Case 7 riparian zone.
|
Figure 4.5.6 indicates that the average stand condition over 90 years under the FFR scenario is on the isoline where mortality from MPB can be expected. In only 2 of 9 decades does the basal area fall below the risk zone for MPB infestation in the FFR scenario. Under a no management scenario, as would occur in the core zone, stands fall below the MPB risk zone in only 1 of 9 decades. In contrast, the AP scenario maintains an average basal area below the MPB risk level in all decades. Despite being below the basal area and trees per acre > 10" dbh minima required under FFR, the AP stands do have an average and minimum SDI > 95 as indicated in Table 4.5.2. Taken together, Table 4.5.2 and Figure 4.5.6 indicate that though stand conditions under this AP regime do not meet basal area and tree count minima, riparian functional requirements as measured by SDI are provided.
Case study 5 had some significantly different challenges from the other alternate plan cases. The riparian stands in case 5 are characterized by large diameter cedar, with virtually no understory vegetation or regeneration present. Because of the diameter distribution of retained trees, the minimum 50 TPA retained under FFR rules results in basal area retention of 73-91 square feet/acre depending on the decade of initial stand entry under the FFR. This level of overstory retention prevents the establishment and development of a replacement seral understory which would be most biologically appropriate for the site. A history of maintaining continuous forest cover in the riparian area through low volume partial overstory removals has created the current stand conditions. This long term conversion from a stand dominated by seral species to one dominated by climax species has led to increased risk of disease and poor utilization of the site for timber production. Signs of root rot (Armillaria ostoyea) are prevalent within the stand, with cedar being particularly susceptible to this disease.
The landowner indicated a desire to convert these riparian stands from slow growing shade tolerant species to a mix of ponderosa pine, larch and white pine, all of which would more effectively use the site to produce wood fiber, provide for long term large diameter wood for riparian function, and provide a more disease resistant stand. Because of silvicultural limitations in establishing these seral species under the dense forest cover currently present on site, an approach that clearcut harvested 1/8 of the riparian zone per decade was chosen to minimize negative impacts on riparian function during the species conversion. Stand metrics at the point of harvest entry yield the range of values for case 5 in Table 4.5.5. These average statistics indicate that even while undertaking stand conversion to create more disease resistant forests, the overall landholding can come close to the FFR target SDI of 95 (90) and basal area of 60 (52.8) square feet per acre at the point of harvest entry.
![]()
| Table 4.5.5: | Range of riparian stand metrics over a 90 year simulation period for Case 5 |
|
metric
|
Ave dbh
|
DBHq
|
DBHq
>6" dbh |
TPA
|
TPA
>6" dbh |
Height of tallest 40 TPA
|
TBA
|
SDI
|
standing MBF/acre
|
harvested MBF/acre
|
| average |
10.1
|
11.3
|
16.2
|
115
|
36
|
65.1
|
52.8
|
90
|
7178
|
14869
|
| max |
20.5
|
20.8
|
25.5
|
282
|
93
|
89.6
|
107.9
|
148
|
14891
|
34833
|
| min |
1.4
|
3.3
|
6.9
|
8
|
6
|
22.9
|
3.9
|
8
|
257
|
2121
|
A comparison of all alternate planning cases with a riparian stand entry that exactly meets the FFR requirements is given in Table 4.5.6.
| Table 4.5.6: | Average riparian stand metrics at time of harvest under alternate planning scenario |
|
metric
|
Ave dbh
|
DBHq
|
DBHq
>6" dbh |
TPA
|
TPA
>6" dbh |
Height of tallest 40 TPA
|
TBA
|
SDI
|
standing MBF/acre
|
harvested MBF/acre
|
| FFR |
-
|
14.9
|
14.9
|
50
|
50
|
Varies
|
60
|
95
|
Varies
|
varies
|
| 5 |
10.1
|
11.3
|
16.2
|
115
|
36
|
65.1
|
52.8
|
90
|
7178
|
14869
|
| 7 |
6.5
|
8.2
|
11.9
|
176
|
75
|
77.4
|
58.2
|
116
|
6983
|
11069
|
| 8 |
9.3
|
12.6
|
18.4
|
86
|
42
|
72.2
|
67.2
|
113
|
16239
|
5872
|
| 9 |
7.4
|
8.9
|
11.9
|
140
|
76
|
78.7
|
58
|
112
|
7643
|
13307
|
While alternate plans must demonstrate that they meet riparian functionality requirements, they must also be economically viable. The economic outcomes of these alternate planning strategies are listed in Table 4.5.7 and the volume differentials between treatments are listed in Table 4.5.8. Table 4.5.7 illustrates that these alternate planning strategies are more economically viable than other FFR options for all cases.
Timber volume and value figures indicate that treating stands to address insect and disease risk can be economically beneficial. In case 7, both economic benefit and insect control are derived using the alternate planning framework as described. In addition, more timber was removed which may prove beneficial for fire risk reduction. In all cases the alternate planning strategy is limited by the current condition of the stands and the over-arching requirement to address riparian functional conditions.
| Table 4.5.7: | Comparison of NPV of cash flows over 90 years between FFR and alternate plans including percent change as compared to the baseline. |
|
Scenario
|
Case 5
|
%
change |
Case 7
|
%
change |
Case 8
|
%
change |
Case 9
|
%
change |
| Baseline |
$851,798
|
$108,425
|
$4,737
|
$22,802
|
||||
| No Riparian Harvest |
$711,232
|
-17%
|
$98,430
|
-9%
|
$2,436
|
-49%
|
$18,507
|
-19%
|
| Outer Zone Only |
$753,102
|
-12%
|
N/A
|
N/A
|
N/A
|
N/A
|
N/A
|
N/A
|
| Inner Zone Single Entry |
$791,502
|
-7%
|
$97,357
|
-10%
|
$2,484
|
-48%
|
$18,333
|
-20%
|
| Inner Zone Multiple Entry |
N/A
|
N/A
|
N/A
|
N/A
|
N/A
|
N/A
|
$18,428
|
-19%
|
| Alternate Plan |
$898,652
|
6%
|
$119,070
|
10%
|
$4,908
|
4%
|
$24,955
|
9%
|
![]()
| Table 4.5.8: | Total commercial harvest volume (MBF) over 90 years under FFR and alternate planning scenarios for four selected cases. |
|
Scenario
|
Case 5
|
Case 7
|
Case 8
|
Case 9
|
||||
|
|
Hewsaw
|
Sawlog
|
Hewsaw
|
Sawlog
|
Hewsaw
|
Sawlog
|
Hewsaw
|
Sawlog
|
| Baseline |
4,958
|
12,580
|
550
|
7,175
|
73
|
376
|
41
|
743
|
| No Riparian Harvest |
4,725
|
11,764
|
400
|
6,856
|
66
|
294
|
29
|
617
|
| Outer Zone Only |
4,598
|
12,071
|
N/A
|
N/A
|
N/A
|
N/A
|
N/A
|
N/A
|
| Inner Zone Single Entry |
4,636
|
12,231
|
450
|
6,883
|
67
|
310
|
30
|
633
|
| Inner Zone Multiple Entry |
N/A
|
N/A
|
N/A
|
N/A
|
N/A
|
N/A
|
31
|
641
|
| Alternate Plan |
4,915
|
12,622
|
646
|
8,636
|
59
|
412
|
35
|
833
|
5.0 Summary
5.1 Economic Impacts
This analysis indicates that the range of economic impacts are just as variable in eastern Washington as were found in western Washington. Factors influencing the variability include the relative amount of riparian to upland area; the riparian stand structure and stage of development, stream class changes as a result of the FFR, and site quality. Contrary to the intent of the FFR, multiple harvest entries within riparian zones are generally not economically practical. Re-entry of the riparian zone was shown to benefit the landowner economically in only two of the nine cases under review.
What is unique to eastern Washington is the influence of prior rules and accepted management activity on economic viability. As the analysis compared the FFR to permanent rules in place immediately prior to FFR, only a measure of incremental impact can be derived. Further analysis of the FREP did quantify a portion of this lost value. The gains greater than the baseline scenario give a measure of some of the lost value from the permanent rules. While the losses that can be calculated under FREP can be quantified, other losses cannot. Because of the interplay between prior rules and harvest activities, many of the riparian stands had slow growing species that had become dominant by virtue of overstory harvest at some time in the past. These species were often low value and because of the stand conditions under which they developed, they did not and can not capture the growth potential of the site. This loss in value can only be measured in terms of the opportunity cost of replacing slow growing stands with faster growing stands and in measuring the costs and benefits of reduced risks of insects, disease, and fire. The valuation of these factors was outside the scope of this study.
![]()
5.2 FREP Benefits
Under the FREP, landowners in eastern Washington have the potential for significant economic gain. In 7 of 9 cases, taking an easement on all riparian areas will increase the economic return to landowners over what they could have obtained under baseline rules. The largest gain accrued on the lowest value acres with a net present value increase from $225/acre under the baseline to $687/acre under FREP. While this gain is substantial, it still indicates that forestry on these dry sites is at best a marginal economic activity. Placing increasing regulatory burdens on forestry related activities in such cases may result in the removal of these lands from forest management into another use entirely. Other land uses which may provide more attractive economic returns currently are not regulated to protect fish and water quality as strictly as are forest lands.
While the FREP may provide some forest landowners with economic relief, sufficient funding for this program is not secure (Zobrist 2001). Some landowners report that in spite of FREP compensation benefits, they are unwilling to grant a 50-year state-held covenant on their forestland (Playfair 2002). While FREP compensates for a portion of the lost timber value, it does not provide incentive for stewardship activities such as removal of excessive fuel loads or restoration of early seral habitat types. To meet the biological intent of the FFR, alternate plans that balance economic return with stewardship values may be needed.
5.3 Fire simulations
Active management that established seral species in upland stands produced a trend toward a more fire safe condition. In contrast, the more passive management approach taken within riparian zones tended to create conditions more favorable to stand replacement fire events. Survival of the seral species under riparian canopies is even less certain and is reflected by higher mortality rates within the model for stands with higher residual basal areas after riparian harvest completion.
While one may argue that the fire mortality trends are perhaps contrived by the management options chosen, more active management, including planting seral species under an overstory of shade tolerant dominant trees, is not a likely landowner choice because there can be no return on such investment. In fact, the DNR reports that many landowners are choosing to avoid treatment in the riparian zone entirely (DeCook, 2001). Under such conditions, the impacts of avoiding riparian harvest entirely have to be considered as one probable outcome. This assessment looks at one potential approach to the legislative mandate and how it would impact fire risk through time. If landowners adopt a no treatment approach to riparian areas or endeavor to obtain what value is available to them through the FFR, then the simulation results are reflective of probable outcomes in the face of a wildfire. The predicted fire impacts to these riparian areas seem to be at odds with the stated intent of the FFR to provide for riparian protection and the reduction of risks associated with general forest health.
It is clear that the forest and fish rules do not work in a vacuum. First, prior legislation and forest practices have resulted in the development of densely stocked riparian stands that often have a large component of shade tolerant, but fire intolerant species. Second, Clean Water and Endangered Species Acts dictated that some significant control on forest management be required adjacent to streams to avoid federal penalties on harvest activities. These two factors combined have resulted in the riparian mandate currently in place. While the FFR meet the intent of protecting fish and water quality currently, this analysis demonstrates a trend in predicted fire impacts that may result in negative unintended ecological consequences. Whether such unintended ecological consequences will inspire modifications to the FFR is unknown. Current policy initiatives such as the President's Healthy Forests plan are meant to reduce fire risk and create fire safe conditions. Perhaps upland fuel treatments will be sufficient to provide fuel breaks and discontinuities in fuels that reduce the crowning behavior of wildfires such that when they do enter riparian zones, the higher vegetative moisture reduces crowning potential. Perhaps alternate planning strategies that are possible within WAC 222 can be used to create management alternatives that support healthy fish stocks and fire safety within the riparian zone.
![]()
5.4 Alternate Plans
Alternate plans may provide economic relief in situations where
landowners are unwilling or unable to take advantage of the FREP.
Alternate plans can be used to reduce risks associated with insect
and disease vectors or fire and do not preclude the option to place
the residual stand into a FRE. This option may be the most desirable
from a variety of perspectives. First, the public would benefit
from forests where the risks from fire and MPB are substantially
reduced. Second, public costs associated with the FREP are reduced
when AP are used to minimize the number of leave trees subject to
compensation arrangements. Third, the landowner would receive compensation
for having provided a public good at the expense of private investment
opportunity.
In all cases, sound decision making regarding alternate plans will
require analysis and weighting of the potential economic and biological
outcomes arising from the revised management strategies. Adoption
of a multi-metric approach that develops a window of opportunity
for flexibility around the double floor (minimum basal area and
minimum TPA) imposed under the FFR appears to provide promising
opportunities to meet biological and financial goals. Evaluation
of forest attributes using biologically based habitat types may
be a useful approach to permit a wider range of upper basal area
limits that more accurately address risks associated with insect
vectors. This analysis and development process must produce alternate
plan templates that are simple and affordable to facilitate the
landowner application process. In addition, AP time frames may need
to be lengthened to permit the multiple entries needed to ensure
that biological conditions that lead to insect and fire risk are
kept under control.
6.0 Conclusions
The stated intent of the rules in eastern Washington is to provide for restoration of riparian function while allowing activities that can ameliorate risks associated with fire, disease, and insects within riparian zones. While the FFR do provide for variation in management as a function of elevation, this inherent variability in eastside requirements appears to be insufficient to reduce the wide disparity of economic impacts for small forest landowners. Poor markets for small diameter trees compound the economic difficulties as thinning trees not required for riparian function is not economically feasible under these market conditions.
Variation in the stand characteristics of riparian forests has a significant impact on the economic losses and/or gains that can be accrued under the FFR. The current rule structure, while acknowledging this variability, does not seem to be sensitive to the magnitude of economic disparity that the variation produces. The FREP can be beneficial in many cases assuming that adequate funding can be secured to support this program. Given the uncertainties in FREP funding and the inherent limitations of applying a consistent set of rules over a highly variable landscape, the development of alternate plans appears to be the most likely method to achieve both biological and economic goals for eastern Washington riparian forests.
Considering the number of small landowners in the state, participation rates in the voluntary programs have not been significant. However the limits of financial resources currently available to pay for forest riparian easements have been reached (Stinson, 2003) calling into question the financial viability of the FREP. One reason for the lack of participation in the voluntary programs may lie in the relative amounts of effort versus advantage they confer. Regardless of funding availability, landowners report many reasons for uneasiness about FREP that include complexity, cost, and lack of desire to grant the state a 50 year easement on their private property.
It is important to note that the entire FFR was designed and negotiated to keep regulatory control within the state. To date this effort appears to be successful, but federal assurances are not yet finalized and litigation from environmental groups remains unresolved. The legislature realized that small landowners could be disproportionately affected by the FFR. To mitigate impacts to small forest landowners, the FFR contain provisions for special voluntary treatment under the FREP and AP. While these voluntary measures may provide relief, delivery and acceptance have proven problematic. Results from this study suggest that some combination of compensation from the FREP and management flexibility under an AP is most likely to produce environmental and economic outcomes in keeping with the stated goals of the FFR. However, AP time frames need to be addressed to ensure that management can occur over the period of an easement provided under the FREP.
![]()
7.0 Further Study
Economic Outcomes
The economic outcomes in this study are based on a small but diverse
sample of cases. Statistical analysis of the trends is not possible
within the framework of this study. However, the variability found
within this study could be used to determine an appropriate sample
size to ensure representative estimation of economic costs to landowners
and to more closely predict FREP expenditures that would be required
to compensate landowners for losses resulting from FFR.
Restoration of forests to a fire safe, insect resistant condition
will require the on-going removal of small diameter wood. The current
negative value of pulp limited the economic outcomes possible in
the case study scenarios. Exploration of opportunities and measures
to increase the value of this small diameter wood are required to
bring the economic and biological goals into alignment. For this
alignment to occur, markets for the product(s) must be created and
maintained. Assessing the viability of alternative products from
small diameter wood is the next challenge that should be addressed.
Valuation of non-market benefits that accrue from forest management,
such as reduced MPB and fire risk, could significantly alter the
economic outcomes and should also be explored.
Alternate Plans
Given the sample size for this study, further assessments would be beneficial to confirm the biological outcomes. In particular, case evaluations further south along the Cascade crest as well as additional studies in the Wenatchee or Okanogan areas might be beneficial to determine if there are any idiosyncrasies specific to those areas that need to be addressed in an AP framework. Additional analysis of insect thresholds over a wider range of ecological habitat types is warranted.
Much work is required to develop an alternate planning process that will reduce the complexity and difficulty of obtaining a plan. The development of AP templates for eastern Washington small landowners is seen as an essential step in moving forward with effective riparian management strategies. This study has demonstrated that with current technologies, an estimation of potential economic and biological impacts of the FFR can be predicted. Sensitivity analysis indicated that the growth models were sensitive to site and ecological habitat type parameters. Using this information and a broader forest data set, the FFR rules could be refined to reflect more biologically oriented outcomes. These outcomes could then become the basis for sub-regional rules which could be established as AP templates.
Fire Simulations
The data subset used for this fire analysis could be extended to other parts of Eastern Washington to garner a broader picture of probable fire outcomes that might arise under the FFR. This study would require further refinements of FFE that are not currently available. While this analysis relied on default parameters chosen by FFE model developers as representative of severe and moderate fire risk situations, other choices of fuel moisture conditions, fire weather, and fuel model are possible and should be explored to determine how sensitive the trends are to variation in these fire related parameters. A larger data set may yield results that would lend themselves to statistical analysis. A statistical analysis would be useful to determine if the fire mortality trends between upland are riparian zones are significant.
![]()
References
- Adams, Darius M., Ralph J. Alig, David J. Anderson, James A.
Stevens, John T. Chmelik, 1992, Future Prospects for Western Washington's
Timber Supply, College of Forest Resources, University of Washington,
Institute of Forest Resources Contribution # 74, 201 pp.
- Agee, James K, 1993, Fire Ecology of Pacific Northwest Forests,
Island Press, Washington, DC, 493 pp.
- Agee, James K, 1994, Fire and weather disturbances in terrestrial
ecosystems of the eastern Cascades, Gen Tech Report PNW-GTR-320,
Portland OR, USDA, Forest Service, Pacific Northwest Research
Station, 52p.
- Agee, James K, 1999, Fire Effects on Landscape Fragmentation
in Interior West Forests, p 43-60 in Rochelle, James A., Leslie
A. Lehnmann, and Joe Wisniewski (eds), Forest Fragmentation -
Wildlife and Management Implications, Brill, Leiden; Boston; Koln.
- Agee, James K., 1993, Fire Ecology of Pacific Northwest Forests,
Island Press, Washington D.C., 493 pp.
- Alexander, Robert R. and Carleton B. Edminster, 1980, Management
of ponderosa pine in even-aged stands in the Southwest. U-S-D-A-For-Serv-Res-Pap-RM-U-S-Rocky-Mt-For-Range-Exp-Stn.
Fort Collins, Colo., Dec 1980. (225) 11 p.
- Anderson, H.E., 1982, Aids to determining fuel models for estimating
fire behavior. Gen. Tech. Rep. INT-122. Ogden, UT: U.S. Department
of Agriculture, Forest Service, Intermountain Research Station.
22 pp.
- Andrews, P.L., 1986, BEHAVE- Fire behavior prediction and fuel
modeling system - BURN subsystem, Part 1. USDA Forest Service,
Intermountain Forest and Range Experiment Station, Ogden UT, Gen
Tech Rep INT-GTR-194, 130 pp.
- Anhold, J.A., M.J. Jenkins, and J.N. Long, 1996, Management
of Lodgepole Pine Stand Density to reduce susceptibility to Mountain
Pine Beetle Attack, W Journal of Applied Forestry 11(2):50-53.
- Baumgartner, David M, and James E. Lotan (eds.), 1988, Ponderosa
Pine The Species and its Management, Symposium Proceedings from
September 29- October 1, 1987, Spokane Washington, Published by
Washington State University, Pullman, 281.
- Bare, B. Bruce, Bruce R. Lippke, Chadwick D. Oliver and Scot
Zens, 1995, Eastern Washington Timber Supply, Cintrafor Special
Paper # 18, Center for International Trade in Forest Products,
University of Washington, Seattle, 191 pp.
- Beukema, Sarah; Reinhardt, Elizabeth; Greenough, Julee; Robinson,
Don; Kurz, Werner. 2002. Chapter 2-Model Description. In: Reinhardt,
Elizabeth; Crookston, Nicholas L. (tech eds). 0000. The Fire and
Fuels Extension to the Forest Vegetation Simulator. Gen. Tech.
Rep. RMRS-GTR-000. Ogden, UT: U.S. Department of Agriculture,
Forest Service, Rocky Mountain Research Station. 00 p.
Working draft at : http://forest.moscowfsl.wsu.edu/gems/ModelDescrJuly2002.pdf
![]()
- Beukema, S.J., E. Reinhardt, J.A. Greenough, W.A. Kurz, N. Crookston,
and D.C.E. Robinson. 2000 Fire and fuels extension model description.
Prepared by ESSA Technologies Ltd., Vancouver BC for USDA Forest
Service, Rocky Mountain Research Station, Moscow ID, 80 pp.
- Brown, Thomas C. and Benjamin L. Harding, 1987, A preliminary
economic assessment of timber and water production in subalpine
forests in Management of Subalpine Forests: Building on 50 years
of research, Rocky Mountain Forest and Range Experimental Station,
Fort Collins, Co, GTR-RM-149.
- Buchal, James L, 1998, The Great Salmon Hoax, Iconoclast Publishing
Co, Aurora, OR, 384 pp.
- Camp, Ann Elizabeth, 1995, Predicting Late Successional Fire
Refugia from Physiography and Topography, PhD dissertation, University
of Washington, 137 pp.
- Cochran, P.H., 1992, Stocking levels and underlying assumptions
for uneven-aged ponderosa pine stands, USDA Forest Service, PNW
Station, Research Note #509. (PNW-RN-509, February 1992).
- Cochran, 1988, Stocking Levels for Managed even-aged stands
of Ponderosa Pine in Baumgartner David M. and James E. Lotan eds.,
Ponderosa Pine - The Species and its Management, Symposium Proceedings,
Sept 29-Oct 1, 1987, Spokane WA, WSU Cooperative Extension, Pullman
WA.
- Cochran, P.H., 1992, Stocking Levels and Underlying Assumptions
for Unevena-aged Ponderosa Pine Stands, USDA Forest Service, PNW
Station, Research Note #509. (PNW-RN-509, Feb 1992).
- Cochran, P.H., J.M. Geist, D.L, Clemens, Roderick R. Clausnitzer
and David C. Powell, 1994, Suggested stocking levels for forest
stands in northeastern Oregon and southeastern Washington., USDA
Forest Service, PNW Station, Research Note #513. (PNW-RN-513,
April 1994).
- Cooper, Stephen V. et al. 1987, Forest habitat types of northern
Idaho: a second approximation, USDA Forest Service, Intermountain
Forest and Range Experiment Station, Ogden UT, Gen Tech Report,
INT-GTR-236, 135 pp.
- Crookston, Nicholas L. 2002. Chapter 1-Purpose and Applications.
In: Reinhardt, Elizabeth; Crookston, Nicholas L. (tech eds). 0000.
The Fire and Fuels Extension to the Forest Vegetation Simulator.
Gen. Tech. Rep. RMRS-GTR-000. Ogden, UT: U.S. Department of Agriculture,
Forest Service, Rocky Mountain Research Station. 00 p.
Working draft at: http://forest.moscowfsl.wsu.edu/gems/Chapter1July2002.pdf
- Crookston, Nicholas L.; Beukema, Sarah; Robinson, Donald C.E.
2002. Chapter 3-Users' Guide. In: Reinhardt, Elizabeth; Crookston,
Nicholas L. (tech eds). 2002. The Fire and Fuels Extension to
Forest Vegetation Simulator. Gen. Tech. Rep. RMRS-GTR-000. Ogden,
UT: U.S. Department of Agriculture, Forest Service, Rocky Mountain
Research Station. 00 p. Working draft at: http://forest.moscowfsl.wsu.edu/gems/UsersGuideJuly2002.pdf
- Crookston, Nicholas L., Werner A. Kurz, Sarah J. Beukema and
Elizabeth D. Reinhardt, Pre-publication draft, RELATIONSHIPS BETWEEN
MODELS USED TO ANALYZE
FIRE AND FUEL MANAGEMENT ALTERNATIVES, 6pp.
http://forest.moscowfsl.wsu.edu/gems/boisePaperPDFversion.pdf
![]()
- Daubenmire, R and J Daubenmire, 1968, Forest Vegetation of Eastern
Washington and Northern Idaho, Washington State Agric Exp Stn
Bulletin 60, Pullman WA.
- DeCook, Steve, 2001, pers. Comm.., a DNR employee with the Small
Forest Landowners Office in North East Region.
- DNR, 2003, Federal Assurances for Washington's Forests &
Fish Report, Washington State Department of Natural Resources
at http://www.dnr.wa.gov/htdocs/agency/federalassurances/
- Donaldson, Norman C., 1980, Soil Survey of Whitman County, Washington,
United States Department of Agriculture, Soil Conservation Service
in cooperation with Washington State University, Agricultural
Research Center.
- Edelson, Jane, 2001, Impact of the Forest Sector in the Washington
State Economy, RTI Factsheet #1, Rural Technology Initiative,
College of Forest Resources, University of Washington.
- Everett, Richard L., Richard Schellhaas, Pete Ohlson, Don Spurbeck
and David Keenum, 2001, Continuity in Fire Disturbance Between
Riparian and Adjacent Sideslopes in the Douglas-fir Forest Series,
http://www.srs.fs.usda.gov/pubs/abstract/viewpub.jsp?index=2848
- Everett, Richard L., Paul F. Hessburg and Terry R. Lillybridge,
1994, Emphasis areas as an alternative to buffer zones and reserved
areas in the conservation of biodiversity and ecosystem processes,
p 283-292 of the special issue on Assessing Forest Ecosystem Health
in the Inland West Part II, Sampson, R. Neil and David L. Adams
(Guest eds.), Journal of Sustainable Forestry, Vol 2(3), Hayworth
Press Inc, New York.
- Federal Register 2000, Endangered and Threatened Species; Final
Rule Governing Take of 14 Threatened Salmon and Steelhead Evolutionarily
Significant Units (ESU's), National Marine Fisheries Service and
National Oceanic and Atmospheric Administration, US Department
of Commerce, July 10, 2000, 65(132):42424
- Fiedler, Carl, Roland Becker and Steve Haglund, 1988, Preliminary
Guidelines for Uneven-aged Silvicultural Prescriptions in Ponderosa
Pine in Baumgartner David M. and James E. Lotan eds., Ponderosa
Pine - The Species and its Management, Symposium Proceedings,
Sept 29-Oct 1, 1987, Spokane WA, WSU Cooperative Extension, Pullman
WA.
- Hann, Wendel J et al. 1997, Landscape Dynamics of the Basin,
Chapter 3 in Quigley, Thomas M., Syliva J. Arbelbide (Tech eds)
An Assessment of Ecosystem Components in the Interior Columbia
Basin and Portions of the Klamath and Great Basins, Vol II, USDA
Forest Service, Pacific Northwest Research Station, PNW-GTR-405.
- Harvey, Alan E., J Michael Geist, Gerald I. McDonald, Martin
F. Jurgensen, Patrick H. Cochran, Darlene Zabowski, and Robert
T. Meurisse, 1994, Biotic and Abiotic Processes in Eastside Ecosystems:
The Effects of Management on Soil Properties, Processes, and Productivity,
USDA Forest Service, PNW_GTR 323.
- Kubasek, Nancy K. and Gary S. Silverman, 2002, Environmental
Law, 4th Edition, Prentice Hall, New Jersey, 370 pp.
- Korol, R.L., 1993, Incorporating inter-tree competition into an ecosystem process model, University of Montana. Ph.D. thesis.
![]()
- Harrison, Kathryn, 1999, Talking with the Donkey: Cooperative
Approaches to Environmental Protection, Journal of Industrial
Ecology, 2(3),: 51-72.
- Larsson, S., R. Oren, R.H. Waring, J.W. Barrettt, 1983, Attacks
of Mountain Pine Beetle as Related to Tree Vigor of Ponderosa
Pine, Forest Science 29(2):395-402.
- Law, B. E., Waring, . R. H., Anthoni, P. M. & Aber, J. D.
Measurements of gross and net ecosystem productivity and water
vapour exchange of a Pinus ponderosa ecosystem, and an evaluation
of two generalized models . Global Change Biology 6 (2), 155-168.
Available from: http://dx.doi.org/10.1046/j.1365-2486.2000.00291.x
- Leaf, Charles F., 1999, Past, Present, and Future Effects of
Forest Service Management Policies on North Platte River Water
Yields, Research Paper PRHRC#6, Platte River Hydrologic Research
Center, Merino, Colorado
- DeCook, Steve, 2001, pers. Comm.., a DNR employee with the Small
Forest Landowners Office in North East Region.
- Lenfesty, Charles, D., 1980 , Soil survey of Okanogan County
Area, Washington, USDA Soil Conservation Service and Washington
State University, Agriculture Research Center, Washington. 153
pp.
- McCarter, James B., 2001, Landscape management system (LMS)
: background, methods, and computer tools for integrating forest
inventory, GIS, growth and yield, visualization and analysis for
sustaining multiple forest objectives, PhD Dissertation, University
of Washington, 101 pp.
- McGaughey, Robert, 2000, EnVision Environmental Visualization
System, USDA Forest Service, PNW Research Station, http://forsys.cfr.washington.edu/envision.html
- Mitchell, R.G., R.H. Waring, G.B. Pitman, 1983, Thinning Lodgepole
Pine Increases Tree Vigor and Resistance to Mountain Pine Beetle,
Forest Science 29(1):204-211.
- Morse, Richard A, 2000, Topographic and Physiographic Influences
on Fire Severity in Stream Valleys of Northern Wenatchee National
Forest, M.S. Thesis, University of Washington, Seattle WA, 164
pp.
- NOAA, 2000, Endangered and Threatened Species; salmon and steelhead;
final rules, 50 CFR Part 223, United States Dept of Commerce,
National Oceanic and Atmospheric Administration, Federal Register,
July 10, 2000, Vol 65 No 132.
- Northwest Management, Inc., 2001, Inland Northwest Market Report,
Volume 4, Issues 1-4. (quarterly market reports for reported eastern
Washington log prices.)
- O'Hara, K.L. and N.L. Valappil, 1995, Age class division of
growing space to regulate stocking in uneven-aged stands IN (K.L.
O'Hara ed) Uneven-aged Management: Opportunities, constraints,
and methodologies, Montana Forest and Conservation Experiment
Station, School of Forestry, University of Montana, Miscellaneous
Publication #56.
- Oliver, Chadwick Dearing, Larry L. Irwin, and Walter H. Knapp,
1994, Eastside Forest Management Practices, Historical Overview,
Extent of Their Applications, and Their Effects on Sustainability
of Ecosystems, USDA Forest Service PNW GTR -324, 73 pp.
- Oliver, Chadwick Dearing and Bruce C. Larson, 1996, Forest Stand Dynamics, John Wiley and Sons Inc, New York, 520 pp.
![]()
- Olsen, W.K., J.M. Schmid and S.A. Mata, 1996, Stand Characteristics
Associated with Mountain Pine Beetle infestations in Ponderosa
Pine, Forest Science 42(3):310-327.
- Olson, Diane, 2000, Fire in riparian zones : a comparison of
historical fire occurrence in riparian and upslope forests in
the Blue Mountains and southern Cascades of Oregon, .M.S. Thesis,
University of Washington, Seattle WA, 164 pp.
- Perez-Garcia, J.M., Edelson, J., and Zobrist, K., (2001) New
Proposed Forest Practices Rules Small Business Economic Impact
Statement. Washington State Department of Natural Resources, Olympia,
WA, 37 pp.
- Potoski, Matthew, and Aseem Prakash, 2002, Protecting the Environment:
Voluntary Regulations in Environmental Governance, Policy Currents,
11(4):9-11.
- Playfair, Bob, 2002, pers comm.., Bob is the President of the
Washington Farm Forestry Association (WFFA) and a small forest
landowner. He has been involved in obtaining his own alternate
plan and working with other WFFA members to obtain theirs.
- Reineke, L.H., 1933, Perfecting a stand density index for even-aged
forests, J. Agric Res. 46:627-638.
- Reinhardt, E.D., R.E. Keane, and J.K. Brown, 1997, First Order
Fire Effects Model: FOFEM 4.0 User's Guide, USDA Forest Service,
Intermountain Forest and Range Experiment Station, Ogden UT, Gen
Tech Rep. INT-GTR-344, 65pp.
- Rice, William M, Lawrence Reeves, et al., 2002, Comparing the
Value of "Forest and Fish" Leave Trees with the Forest
Excise Tax Credit, Report to the Legislature, Washington State
Department of Revenue, November 1, 2002, Olympia, WA, 16 pp.
- Rural Technology Initiative, 2001, Newsletter of the Rural Technology
Initiative, Fall 2001 vol.2(1) at url: http://www.ruraltech.org/pubs/newsletter/Q42001/index.asp
- Sampson, Neil and David Adams, eds., 1994, Assessing Forest
Ecosystem Health in the Inland West, Journal of Sustainable Forestry,
Volume 2 No 1-4.
- Scott, Joe H. and Elizabeth D. Reinhardt, 2001, Assessing crown
fire potential by linking models of surface and crown fire behavior,
Rocky Mountain Research Station Research Paper #29, USDA Forest
Service, Fort Collins, CO, 59 p.
- Scott, Joe H. and Elizabeth D. Reinhardt, 2001, Assessing crown
fire potential by linking models of surface and crown fire behavior,
Rocky Mountain Research Station Research Paper #29, USDA Forest
Service, Fort Collins, CO, 59 p.
- Schmid, J.M. and S.A. Mata, 1992, Stand Density and Mountain
Pine Beetle caused Tree Mortality in Ponderosa Pine Stands, USDA
Forest Service, Rocky Mountain Forest and Range Experimental Station,
Research Note #515.. (RN-RM-515, Mar 1992).
- Stinson, Steve, 2003, Presentation given at the Rural Technology
Annual Review, Jan 31 2003, University of Washington, Seattle.
http://www.ruraltech.org/about/meetings/annual_review_03/
- USDA SCS, 1982, Soil Survey of Stevens County, Washington, United
States Department of Agriculture, Soil Conservation Service in
cooperation with Forest Service, US Dept. of Interior, Bureau
of Indian Affairs, Washington State DNR and Washington State University,
Agricultural Research Center.
- USDA SCS, 1989, Soil Survey of Pend Oreille County Area, Washington, United States Department of Agriculture, Soil Conservation Service in cooperation with USDA Forest Service, Washington State DNR and Washington State University, Agricultural Research Center.
![]()
- Van Wagner, C.E., 1977, Condtions for the start and spread of
crown fire, Can J of For. Res., 7:23-34.
- Washington Administrative Code (WAC) 222, 1992, Washington Forest
Practices Rules and Regulations, Washington State Department of
Natural Resources, Forest Practices Division, Olympia WA
- Washington Administrative Code (WAC) 222, June 1993, Washington
Forest Practices Rules, Washington State Department of Natural
Resources, Forest Practices Division, Olympia WA
- Washington Administrative Code (WAC) 222, July 1995, Washington
Forest Practices Rules, Washington State Department of Natural
Resources, Forest Practices Division, Olympia WA
- Washington Administrative Code (WAC) 222, 1998, Washington Forest
Practices Rules, Washington State Department of Natural Resources,
Forest Practices Division, Olympia WA
- Washington Administrative Code (WAC) 222, 2001, Washington Forest
Practices Rules, Washington State Department of Natural Resources,
Forest Practices Division, Olympia WA
Wash. Admin. Code § 222-16-010 General Definitions, (2001).
Wash. Admin. Code § 222-12-040 Alternate Plans - Policy, (2001).
Wash. Admin. Code § 222-30-022 Eastern Washington Riparian Management Zones, (2001).
Wash. Admin. Code § 222-30-020 Eastern Washington Riparian Management Zones, (1998).
- WA State governors office, 1999, The Governor's Salmon Plan
entitled "Extinction is not an Option", http://www.governor.wa.gov/gsro/strategy/summary/roadmap.htm
- Weeks, Joe, 2001, pers comm., Joe Weeks is one of committee
that drafted the Eastside portion of the FFR while working as
a co-director of the eastside CMER group - SAGE, he is currently
a DNR employee with the Small Forest Landowners Office in South
East Region.
- Whitehead,-D. and Hinckley,-T.M., Models of water flux through
forest stands: critical leaf and stand parameters. Tree-Physiol.
Victoria, B.C. Heron Publishing. July/Sept 1991. v. 9 (1/2) p.
35-57.
- Williams, Clinton K., Brian F. Kelley, Bradley G. Smith, and
Terry R. Lillybridge, 1995, Forested Plant Associations of the
Colville National Forest, USDA Forest Service, Pacific Northwest
Research Station, Gen Tech Rpt., PNW-GTR-360.
- Williamson, Nathan, 1999, Crown fuel Characteristics, Stand
Structure and Fire Hazard in Riparian Forests of the Blue Mountains,
Oregon, M.S. Thesis, University of Washington, Seattle WA, 96
pp.
- Wykoff, William R., Nicholas L. Crookston and Albert Stage,
1982, User's Guide to the Stand Prognosis Model, USDA Forest Service,
Intermountain Forest and Range Experiment Station, Ogden UT, Gen
Tech Report, INT-GTR-133, 113 pp.
- Zobrist, Kevin, 2000, Case studies examining the economic impacts
of the Forests and Fish rules on NIPF landowners in Western Washington,
Rural Technology Initiative Factsheet #2, Rural Technology Initiative,
College of Forest Resources, University of Washington, Seattle
WA. 4 pp.
- Zobrist, Kevin, 2002, Economic impacts of the Forests and Fish
Rules on small NIPF landowners, Ten western Washington case studies,
Rural Technology Initiative Working Paper #1, Rural Technology
Initiative, College of Forest Resources, University of Washington,
Seattle WA. 68 pp.
![]()
Appendix A
A.1 Case Study 1
Case Study 1 (Figure A.1.1) is 160.9 acres of forest land in Pend Oreille County at 2453' in elevation. The property has a range of site classes and ecological habitat types with riparian areas classified as a Thuja plicata/Clintonia uniflora (red cedar/beadlilly) habitat type for modeling purposes. Initial stocking is a mix of Douglas-fir, western red cedar, lodgepole pine, and larch overstory with an understory of grand fir and western red cedar. Stands are a combination of stratified canopies and single layered canopies.
| Table A.1.0: | Case Study 1 acreage. |
| Location: |
Pend Oreille County
|
|
| Total acres of commercial forestland: |
160.9
|
|
| Acres previously in buffers (estimated): |
2.2
|
1.40%
|
| Acres in buffers under new rules: | ||
| Core |
1.4
|
0.90%
|
| Inner |
1.8
|
1.10%
|
| Outer |
2.2
|
1.40%
|
| Total |
5.4
|
3.40%
|
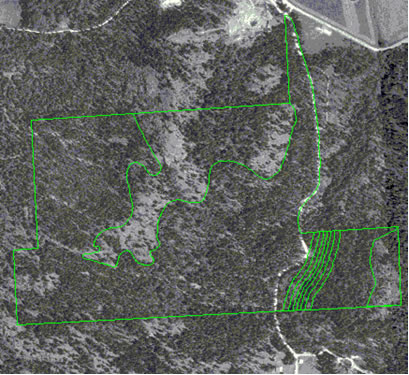 |
| Figure A.1.1: Case Study 1. |
| Table A.1.1: | Total commercial harvest volume (MBF) over the next 90 years for Case Study 1. |
|
Harvest Volume
|
|||
| Scenario |
Pulp
|
Hewsaw
|
Sawlog
|
| Baseline |
0
|
1,007
|
4,401
|
| No Riparian Harvest |
0
|
1,043
|
4,186
|
| Outer Zone Only |
0
|
1,072
|
4,234
|
| Inner Zone Single Entry |
0
|
1,080
|
4,243
|
| Inner Zone Multiple Entry |
0
|
1,080
|
4,247
|
![]()
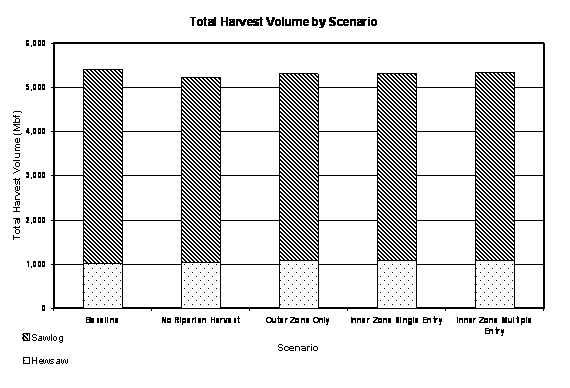 |
| Figure A.1.2: | Harvest volume by size class for Case Study 1. As pulp has a negative value, pulp harvested has not been included in the analysis. |
| Table A.1.2: | NPV of cash flows over the next 90 years for Case Study 1. |
|
NPV
|
NPV with Easement
|
|||||
| Scenario |
Total
|
Per Acre
|
% Change
|
Total
|
Per Acre
|
% Change
|
| Baseline |
$166,649
|
$1,035
|
$166,649
|
|||
| No Riparian Harvest |
$163,386
|
$1,015
|
-2%
|
$165,557
|
$1,029
|
-1%
|
| Outer Zone Only |
$166,387
|
$1,034
|
0%
|
$168,558
|
$1,048
|
1%
|
| Inner Zone Single Entry |
$166,386
|
$1,034
|
0%
|
$168,556
|
$1,047
|
1%
|
| Inner Zone Multiple Entry |
$166,385
|
$1,034
|
0%
|
$168,555
|
$1,047
|
1%
|
 |
| Figure A.1.2: | NPV by scenario for Case Study 1. Value in the riparian zone outweighs the cost of obtaining it in this case study. Sufficient volume is present in the inner zone to permit multiple entries. |
 |
| Figure A.1.3: | NPV with FREP by scenario for Case Study 1. Compensation under the FREP improves the overall economic position of this landowner because the baseline rules dictated that most of the riparian timber be left without compensation. |
 |
| Figure A.1.4: | Percent change (compared to the baseline) in NPV of cash flows over 90 years for Case Study 1. Because the stand structure within the riparian zone does not permit removal of merchantable trees under the baseline, the relative impacts of FFR are minor. |
![]()
A.2 Case Study 2
Case study 2 is 296.1 acres of forest land in Pend Oreille County
located at 2440' in elevation. Ecologically the habitat types on
this forest land range from lodgepole pine to grand fir to Douglas-fir
types. Riparian areas are classified as a Thuja plicata/Clintonia
uniflora (red cedar/beedlilly) habitat type for modeling purposes.
Initial stocking is a mix of spruce, Douglas-fir, western red cedar,
lodgepole pine, and larch overstory with an understory of grand
fir and western red cedar.
| Table A.2.0: | Case Study 2 acreage. |
| Location: |
Pend Oreille County
|
|
| Total acres of commercial forestland: |
296.1
|
|
| Acres previously in buffers (estimated): |
6.6
|
2.20%
|
| Acres in buffers under new rules: | ||
| Core |
A.9
|
1.60%
|
| Inner |
10.1
|
3.40%
|
| Outer |
1.4
|
0.50%
|
| Total |
16.4
|
5.50%
|
 |
| Figure A.2.1: | Digital ortho-photo of Case Study 2. Note the stream adjacent parallel road along the southern portion of the stream. This road has a substantial impact on the economic viability of this case. |
| Table A.2.1: | Total commercial harvest volume (MBF) over the next 90 years for Case Study 2. |
|
Harvest Volume
|
|||
| Scenario |
Pulp
|
Hewsaw
|
Sawlog
|
| Baseline |
0
|
3,552
|
5,771
|
| No Riparian Harvest |
0
|
3,263
|
5,565
|
| Outer Zone Only |
0
|
3,272
|
5,584
|
| Inner Zone Single Entry |
0
|
3,300
|
5,594
|
| Inner Zone Multiple Entry |
0
|
3,305
|
5,658
|
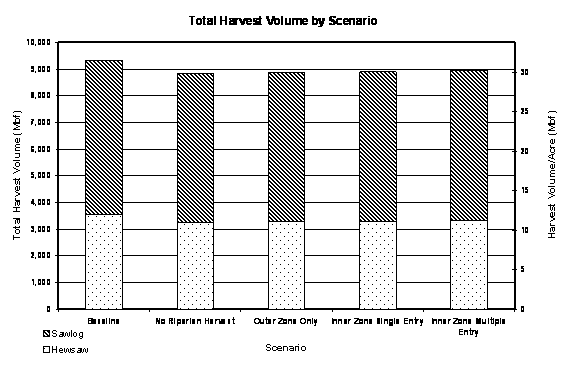 |
| Figure A.2.2: | Harvest volume by scenario for Case Study 2. Pulp values are not included as pulp is not merchantable at this time. |
![]()
| Table A.2.2: | NPV of cash flows over the next 90 years for Case Study 2. |
|
NPV
|
NPV with Easement
|
|||||
| Scenario |
Total
|
Per Acre
|
% Change
|
Total
|
Per Acre
|
% Change
|
| Baseline |
$279,225
|
$943
|
$279,225
|
|||
| No Riparian Harvest |
$253,820
|
$857
|
-9%
|
$294,373
|
$994
|
5%
|
| Outer Zone Only |
$255,707
|
$863
|
-8%
|
$296,259
|
$1,000
|
6%
|
| Inner Zone Single Entry |
$254,882
|
$861
|
-9%
|
$295,435
|
$998
|
6%
|
| Inner Zone Multiple Entry |
$255,012
|
$861
|
-9%
|
$295,564
|
$998
|
6%
|
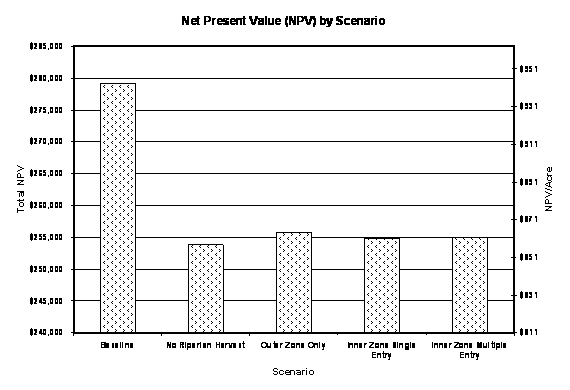 |
| Figure A.2.3: | NPV by scenario for Case Study 2. This case is significantly impacted by a stream adjacent parallel road along ½ of the riparian area. To meet the inner zone TPA requirement, 96-102 square feet of basal area was retained in the first riparian entry. This retention level precluded regeneration and stand re-entry over much of the analysis period. |
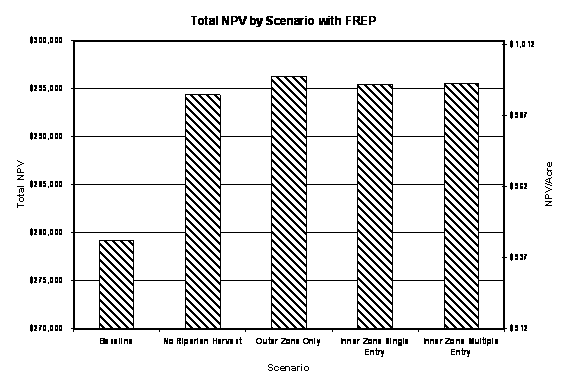 |
| Figure A.2.4: | NPV with FREP by scenario for Case Study 2. |
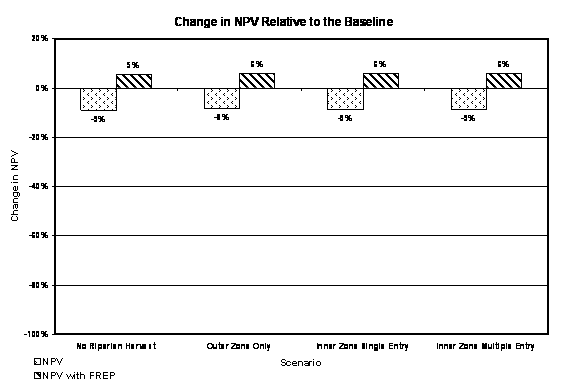 |
| Figure A.2.5: | Percent change (compared to the baseline) in NPV of cash flows over 90 years for Case Study 2. Retention requirements under the baseline are compensated at 100% in this case as it exceeds the 12.2% over-ride. This generates a positive impact under the FREP. |
A.3 Case Study 3
Case Study 3 is located at 3496' in elevation in Stevens County.
It has a mixed conifer forest cover dominated by western red cedar
and Douglas-fir overstory with a well developed understory of shade
tolerant species. The site was harvested in its entirety in the
first year of the simulation which results in a relatively high
NPV/acre relative to other sites under consideration. Stands were
modeled using the Psuedotsuga menzeisii/ Physocarpus malvaceus
(Douglas-fir/ninebark) habitat type.
![]()
| Table A.3.0: | Case Study 3 acreage. |
| Location: |
Stevens County
|
|
| Total acres of commercial forestland: |
20
|
|
| Acres previously in buffers (estimated): |
0
|
0%
|
| Acres in buffers under new rules: | ||
| Core |
2.2
|
11.00%
|
| Inner |
2.2
|
11.00%
|
| Outer |
1.6
|
8.00%
|
| Inaccessible (surrounded by water on all sides) |
0.7
|
3.50%
|
| Total |
6.7
|
33.50%
|
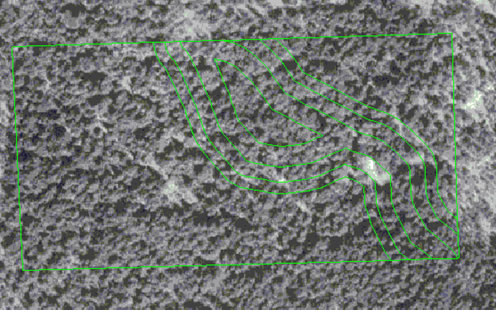 |
| Figure A.3.1: | Digital ortho-photo of Case Study 3. This stream was re-classified from a class 5 to a class 3. |
| Table A.3.1: | Total commercial harvest volume (MBF) over the next 90 years for Case Study 3. |
|
Harvest Volume
|
|||
| Scenario |
Pulp
|
Hewsaw
|
Sawlog
|
| Baseline |
0
|
95
|
720
|
| No Riparian Harvest |
0
|
67
|
513
|
| Outer Zone Only |
0
|
77
|
566
|
| Inner Zone Single Entry |
0
|
79
|
574
|
| Inner Zone Multiple Entry |
0
|
93
|
593
|
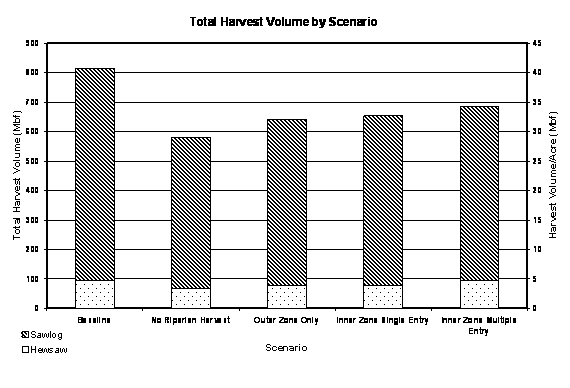 |
| Figure A.3.2: | Harvest volume by scenario for Case Study 3. Pulp values are not included as pulp is not merchantable at this time. |
![]()
| Table A.3.2: | NPV of cash flows over the next 90 years for Case Study 3. |
|
NPV
|
NPV with Easement
|
|||||
| Scenario |
Total
|
Per Acre
|
% Change
|
Total
|
Per Acre
|
% Change
|
| Baseline |
$78,821
|
$3,941
|
$78,821
|
|||
| No Riparian Harvest |
$54,166
|
$2,708
|
-31%
|
$72,104
|
$3,605
|
-9%
|
| Outer Zone Only |
$60,903
|
$3,045
|
-23%
|
$78,841
|
$3,942
|
0%
|
| Inner Zone Single Entry |
$60,799
|
$3,039
|
-23%
|
$78,738
|
$3,936
|
0%
|
| Inner Zone Multiple Entry |
$60,632
|
$3,031
|
-23%
|
$78,570
|
$3,928
|
0%
|
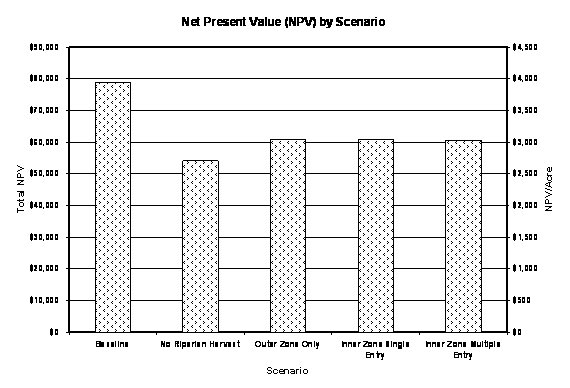 |
| Figure A.3.3: | NPV by scenario for Case Study 3. To meet the inner zone TPA requirement, 123-127 square feet of basal area was retained in the first riparian entry. An existing multi-storied canopy and shade tolerant species composition allowed for multiple entries on this site. |
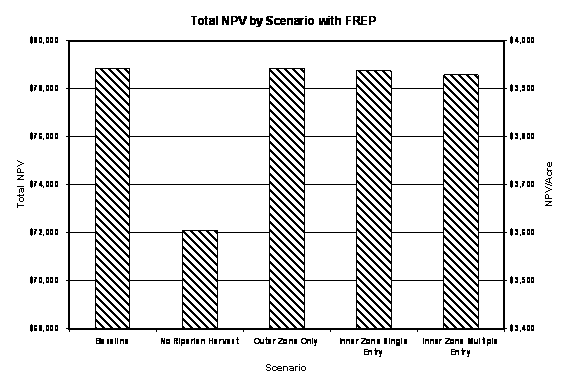 |
| Figure A.3.4: | NPV with FREP by scenario for Case Study 3. |
 |
| Figure A.3.5: | Percent change (compared to the baseline) in NPV of cash flows over 90 years for Case Study 3. Retention requirements under the baseline are compensated at 100% in this case as it exceeds the 12.2% over-ride. This ameliorates the impact of the stream classification change. |
A.4 Case Study 4
Case study 4 is located at 3377' in elevation in Stevens County. The main stream within the property was reclassified to a class 4 (Np) from a class 5 (Ns) under the FFR. As the stream was within 500' of a fish bearing stream additional harvest limitations ensued.
![]()
| Table A.4.0: | Case Study 4 acreage. |
| Location: | Stevens County | |
| Total acres of commercial forestland: |
96.1
|
|
| Acres previously in buffers (estimated): |
0
|
0%
|
| Acres in buffers under new rules: | ||
| Class 4 RMZ |
7.3
|
7.60%
|
| Inner |
0.3
|
0.30%
|
| Outer |
0.1
|
0.10%
|
| Total |
7.7
|
8.00%
|
 |
| Figure A.4.1: | Digital ortho-photo of Case Study 4. This is the only class 4 stream analysis conducted for all the case studies. The upland forest stands and riparian stands were harvested to approximately 50 TPA within the past decade. The regeneration delay prior to a riparian entry contributes to the negative impact under the FFR for this case study. |
| Table A.4.1: | Total commercial harvest volume (MBF) over the next 90 years for Case Study 4. |
|
Harvest Volume
|
|||
| Scenario |
Pulp
|
Hewsaw
|
Sawlog
|
| Baseline |
0
|
586
|
2,264
|
| No Riparian Harvest |
0
|
551
|
2,131
|
| Outer Zone Only |
0
|
552
|
2,134
|
| Inner Zone Single Entry |
0
|
565
|
2,158
|
| Inner Zone Multiple Entry |
0
|
577
|
2,250
|
 |
| Figure A.4.2: | Harvest volume by scenario for Case Study 4. Pulp values are not included as pulp is not merchantable at this time. |
![]()
| Table A.4.2: | NPV of cash flows over the next 90 years for Case Study 4. |
|
NPV
|
NPV with Easement
|
|||||
| Scenario |
Total
|
Per Acre
|
% Change
|
Total
|
Per Acre
|
% Change
|
| Baseline |
$53,565
|
$557
|
$53,565
|
|||
| No Riparian Harvest |
$45,972
|
$478
|
-14%
|
$50,225
|
$522
|
-6%
|
| Outer Zone Only |
$46,054
|
$479
|
-14%
|
$50,308
|
$523
|
-6%
|
| Inner Zone Single Entry |
$46,341
|
$482
|
-13%
|
$50,595
|
$526
|
-6%
|
| Inner Zone Multiple Entry |
$46,773
|
$486
|
-13%
|
$51,026
|
$530
|
-5%
|
 |
| Figure A.4.3: | NPV by scenario for Case Study 4. |
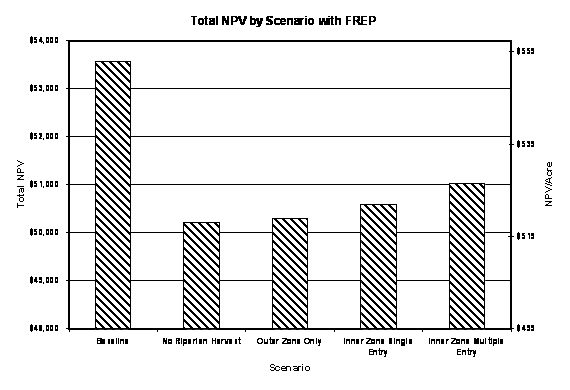 |
| Figure A.4.5: | NPV with FREP by scenario for Case Study 4. |
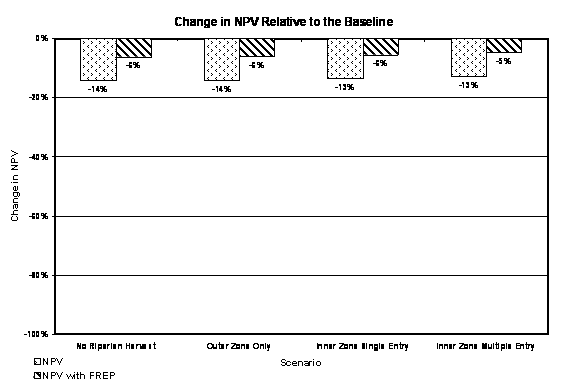 |
| Figure A.4.5: | Percent change (compared to the baseline) in NPV of cash flows over 90 years for Case Study 4. |
A.6 Case Study 6
Case Study 6 is an 825.1 acre parcel in Pend Oreille County. The parcel consists of 117.8 acres of wetlands and lakes and 707.3 acres of forested land. Site quality is low, which eliminates the need for an outer riparian zone. Riparian stands are typically 140+ years old, with a dominant canopy layer of Ponderosa Pine and Larch mixed with Lodgepole pine, Douglas-fir and a mixed understory of shade tolerant species. Upland stands are younger, with fewer canopy layers and lower stocking overall.
![]()
Table A.6.0: |
Case Study 6 acreage. |
| Total acres of commercial forestland: |
707.3
|
(117.8 of water)
|
| Acres previously in buffers (estimated): |
102.3
|
14.50%
|
| Acres in buffers under new rules: | ||
| Core |
29.1
|
4.10%
|
| Inner |
65.6
|
9.20%
|
| RMZ (wetland buffer) |
28.7
|
4.00%
|
| Total |
123.4
|
17.30%
|
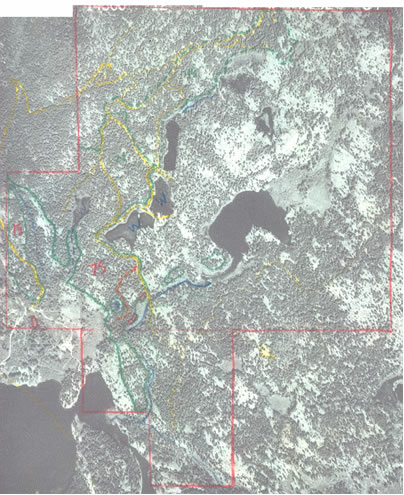 |
| Figure A.6.1: | Ortho-photo of Case Study 6. This 825.1 acre parcel has 118 acres of water and wetlands within its perimeter, all of which are considered Bull Trout habitat. The low site class negates the need for an outer riparian zone for this case study. |
| Table A.6.1: | Total commercial harvest volume (MBF) over the next 90 years for Case Study 6. |
|
Harvest Volume
|
|||
| Scenario |
Pulp
|
Hewsaw
|
Sawlog
|
| Baseline |
0
|
7,529
|
19,290
|
| No Riparian Harvest |
0
|
6,741
|
16,757
|
| Inner Zone Single Entry |
0
|
6,806
|
16,931
|
| Inner Zone Multiple Entry |
0
|
6,911
|
17,181
|
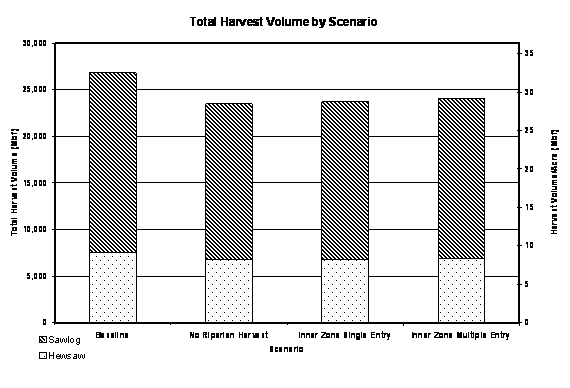 |
| Figure A.6.2: | Harvest volume by scenario for Case Study 6. Pulp values are not included as pulp is not merchantable at this time. |
![]()
| Table A.6.2: | NPV of cash flows over the next 90 years for Case Study 6. |
|
NPV
|
NPV with Easement
|
|||||
| Scenario |
Total
|
Per Acre
|
% Change
|
Total
|
Per Acre
|
% Change
|
| Baseline |
$1,142,584
|
$1,384
|
$1,142,584
|
|||
| No Riparian Harvest |
$800,562
|
$970
|
-30%
|
$1,227,929
|
$1,488
|
7%
|
| Inner Zone Single Entry |
$787,448
|
$954
|
-31%
|
$1,214,814
|
$1,472
|
6%
|
| Inner Zone Multiple Entry |
$787,037
|
$953
|
-31%
|
$1,214,403
|
$1,471
|
6%
|
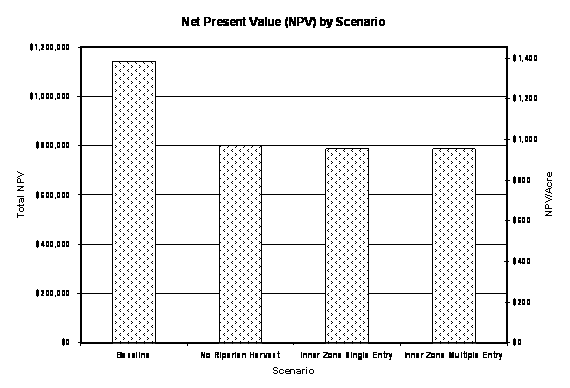 |
| Figure A.6.3: | NPV by scenario for Case Study 6. The low site class and stratified canopy layers resulted in slow regeneration potential and the retention of 79-172 square feet of basal area at the first inner zone riparian entry depending on decade of re-entry. Multiple entries were only possible because existing canopy layers were of sufficient size to warrant re-entry within the 90 year simulation period. |
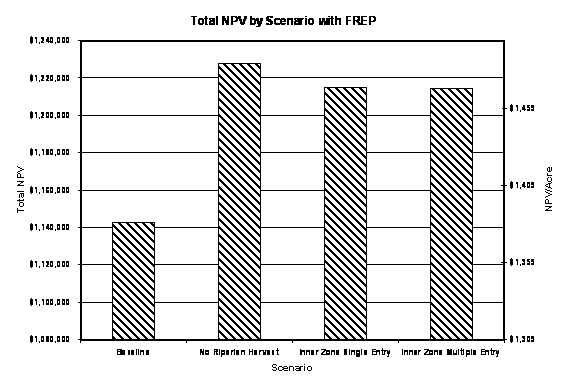 |
| Figure A.6.4: | NPV with FREP by scenario for Case Study 6. In all cases, the FREP benefits this landowner should they choose to enter in an easement over 17% of their property. |
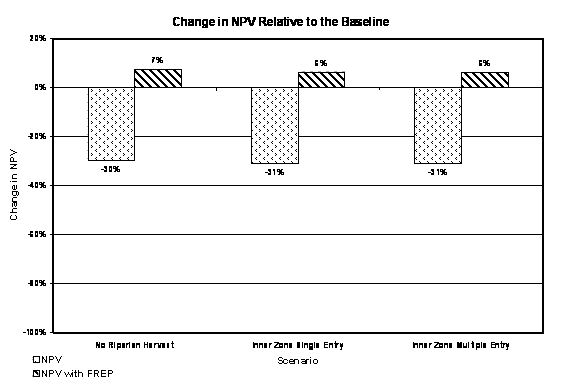 |
| Figure A.6.5: | Percent change (compared to the baseline) in NPV of cash flows over 90 years for Case Study 6. Retention requirements under the baseline are compensated at 100% in this case as it exceeds the 12.2% over-ride. This generates a positive impact under the FREP. |
A.7 Case Study 7
Case study 7 is 426.9 acres of forest land in Okanogan County. This site is 3150' in elevation, but within a Ponderosa Pine ecological habitat type. Low site class as a result of droughty soils reduces the capability of this site for rapid establishment and growth of the understory. Large diameter residual overstory trees in riparian areas further reduce the opportunity for advance regeneration establishment. These factors contribute significantly to the adverse economic effect of the FFR for this landowner. Conversely, if the landowner chooses to obtain a FRE, then economic gains are significant.
![]()
Table A.7.0: |
Case Study 7 acreage. |
| Location: |
Okanogan County
|
|
| Total acres of commercial forestland: |
426.9
|
|
| Acres previously in buffers (estimated): |
39.4
|
9.20%
|
| Acres in buffers under new rules: | ||
| Core |
23.7
|
5.50%
|
| Inner |
34.1
|
8.00%
|
| Total |
57.8
|
13.50%
|
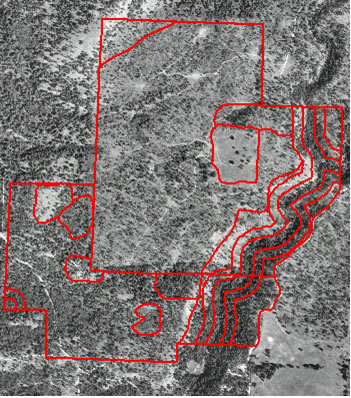 |
| Figure A.7.1: | Digital ortho-photo of Case Study 7. |
| Table A.7.1: | Total commercial harvest volume (MBF) over the next 90 years for Case Study 7. |
|
Harvest Volume
|
|||
| Scenario |
Pulp
|
Hewsaw
|
Sawlog
|
| Baseline |
0
|
550
|
7,175
|
| No Riparian Harvest |
0
|
400
|
6,856
|
| Inner Zone Single Entry |
0
|
450
|
6,883
|
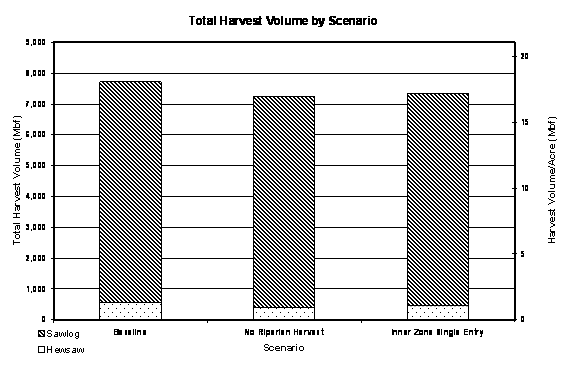 |
| Figure A.7.2: | Harvest volume by scenario for Case Study 7. Pulp values are not included as pulp is not merchantable at this time. |
| Table A.7.2: | NPV of cash flows over the next 90 years for Case Study 7. |
|
NPV
|
NPV with Easement
|
|||||
| Scenario |
Total
|
Per Acre
|
% Change
|
Total
|
Per Acre
|
% Change
|
| Baseline |
$108,425
|
$253
|
$108,425
|
|||
| No Riparian Harvest |
$98,430
|
$230
|
-9%
|
$138,032
|
$323
|
27%
|
| Inner Zone Single Entry |
$97,357
|
$228
|
-10%
|
$136,958
|
$320
|
26%
|
![]()
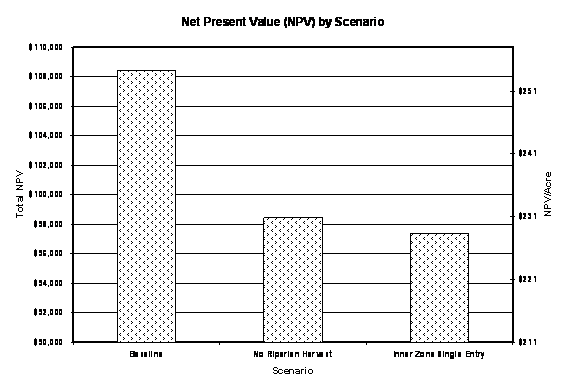 |
| Figure A.7.3: | NPV by scenario for Case Study 7. Despite a high basal area present in the inner zone, to meet the inner zone TPA requirement, no harvest is permitted in the inner zone until 50 years into the simulation period. This limitation severely impacts NPV under FFR. |
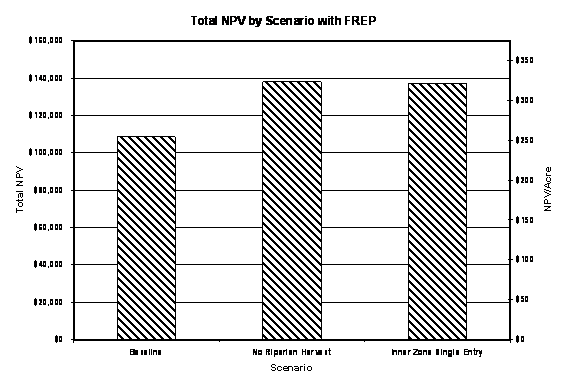 |
| Figure A.7.4: | NPV with FREP by scenario for Case Study 7. |
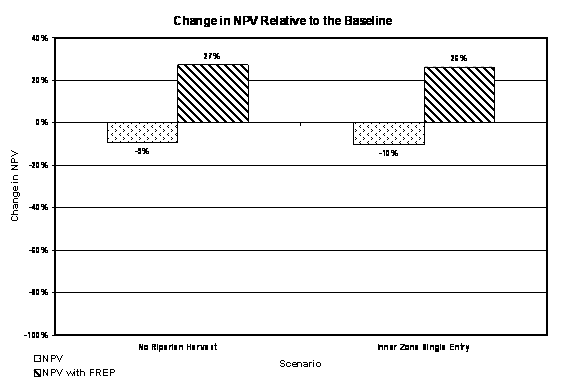 |
| Figure A.7.5: | Percent change (compared to the baseline) in NPV of cash flows over 90 years for Case Study 7. Retention requirements under the baseline are compensated at 100% in this case as it exceeds the 12.2% over-ride. This generates a positive impact under the FREP. |
A.8 Case Study 8
Case study 8 is a 21 acre parcel in Whitman County. This case is at the lowest elevation of all the cases at 1789'. Very low site conditions coupled with an initial low stocking density create conditions where FFR impacts are large and potential benefits under the FREP are significant. The high percentage of forest land within the riparian zone is indicative of the land usage in the forest/agricultural interface of the Ponderosa Pine habitat type. The stand development was modeled using the Pinus ponderosae/Symphoricarpus albus (Ponderosa Pine/waxberry) habitat type.
| Table A.8.0: | Case Study 8 acreage. |
| Location: |
Whitman County
|
|
| Total acres of commercial forestland: |
21
|
|
| Acres previously in buffers (estimated): |
1.9
|
9.00%
|
| Acres in buffers under new rules: | ||
| Core |
1.9
|
9.00%
|
| Inner |
4.3
|
20.50%
|
| Total |
6.2
|
29.50%
|
| Table A.8.1: | Total commercial harvest volume (MBF) over the next 90 years for Case Study 7. |
|
Harvest Volume
|
|||
| Scenario |
Pulp
|
Hewsaw
|
Sawlog
|
| Baseline |
0
|
73
|
376
|
| No Riparian Harvest |
0
|
66
|
294
|
| Inner Zone Single Entry |
0
|
67
|
310
|
![]()
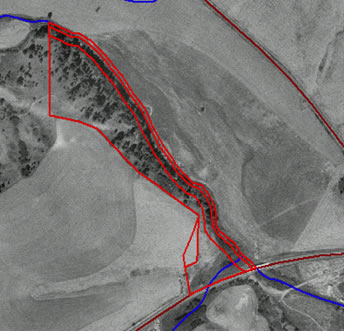 |
| Figure A.8.1: | Digital ortho-photo of Case Study 8. |
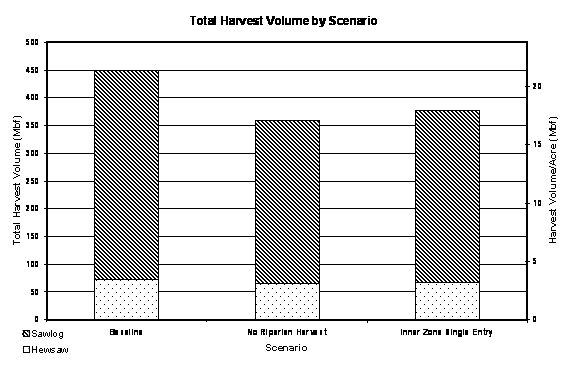 |
| Figure A.8.2: | Harvest volume by scenario for Case Study 8. Pulp values are not included as pulp is not merchantable at this time. |
| Table A.8.2: | NPV of cash flows over the next 90 years for Case Study 8. |
|
NPV
|
NPV with Easement
|
|||||
| Scenario |
Total
|
Per Acre
|
% Change
|
Total
|
Per Acre
|
% Change
|
| Baseline |
$4,737
|
$225
|
$4,737
|
|||
| No Riparian Harvest |
$2,436
|
$116
|
-49%
|
$14,387
|
$685
|
204%
|
| Inner Zone Single Entry |
$2,484
|
$118
|
-48%
|
$14,435
|
$687
|
205%
|
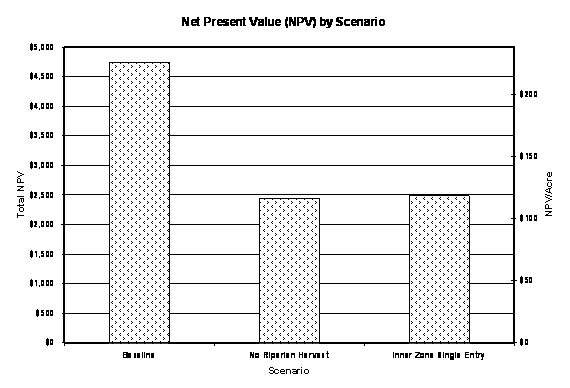 |
| Figure A.8.3: | NPV by scenario for Case Study 8. |
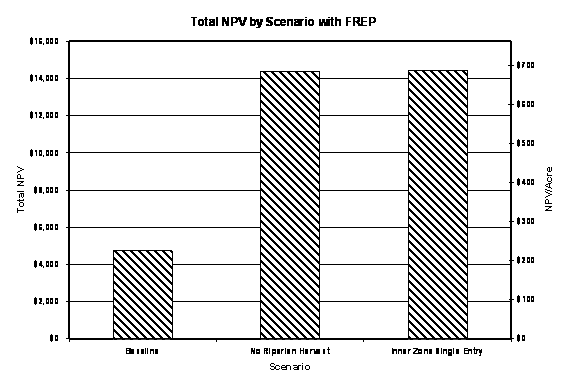 |
| Figure A.8.4: | NPV with FREP by scenario for Case Study 8. |
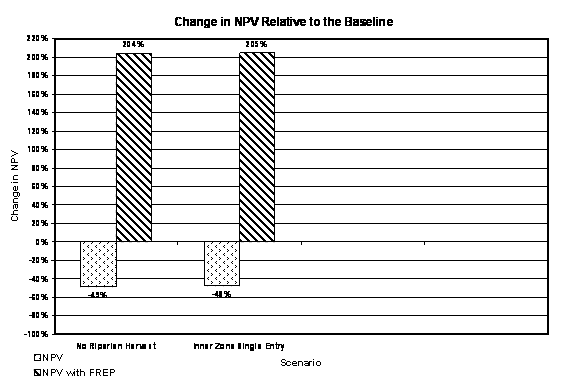 |
| Figure A.8.5: | Percent change (compared to the baseline) in NPV of cash flows over 90 years for Case Study 8. Retention requirements under the baseline are compensated at 100% in this case as it exceeds the 12.2% over-ride. |
![]()
A.9 Case Study 9
Case Study 9 is located in Whitman County at 2456' in elevation.
It has 23.5 acres of forest land as part of a mixed agricultural/forestry
land holding. The high percentage of forest land within the riparian
zone is indicative of the land usage in the forest/agricultural
interface of the Ponderosa Pine habitat type. The stand development
was modeled using the Pinus ponderosae/Symphoricarpus albus
(Ponderosa Pine/waxberry) habitat type. The stands had very low
initial stocking, but with a medium site class, growth rates were
sufficient to allow multiple entries over the ninety year simulation.
| Table A.90: | Case Study 9 acreage. |
| Total acres of commercial forestland: |
23.5
|
|
| Acres previously in buffers (estimated): |
1.6
|
6.80%
|
| Acres in buffers under new rules: | ||
| Core |
1.6
|
6.80%
|
| Inner |
4
|
17.00%
|
| Total |
5.6
|
23.80%
|
 |
| Figure A.9.1: | Digital ortho-photo of Case Study 9. The stream is a class 2 which dictates a very wide buffer. No outer zone is required as the stands are on site class 3 land. |
| Table A.9.1: | Total commercial harvest volume (MBF) over the next 90 years for Case Study 9. |
|
Harvest Volume
|
|||
| Scenario |
Pulp
|
Hewsaw
|
Sawlog
|
| Baseline |
0
|
41
|
743
|
| No Riparian Harvest |
0
|
29
|
617
|
| Inner Zone Single Entry |
0
|
30
|
633
|
| Inner Zone Multiple Entry |
0
|
31
|
641
|
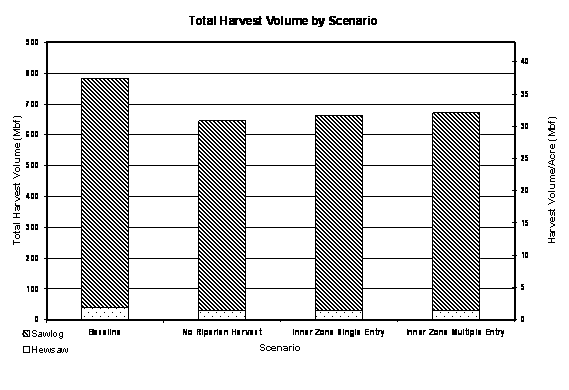 |
| Figure A.9.2: | Harvest volume by scenario for Case Study 9. Pulp values are not included as pulp is not merchantable at this time. |
![]()
| Table A.9.2: | NPV of cash flows over the next 90 years for Case Study 9. |
|
NPV
|
NPV with Easement
|
|||||
| Scenario |
Total
|
Per Acre
|
% Change
|
Total
|
Per Acre
|
% Change
|
| Baseline |
$22,802
|
$970
|
$22,802
|
|||
| No Riparian Harvest |
$18,507
|
$787
|
-19%
|
$32,140
|
$1,367
|
41%
|
| Inner Zone Single Entry |
$18,333
|
$780
|
-20%
|
$31,966
|
$1,360
|
40%
|
| Inner Zone Multiple Entry |
$18,428
|
$784
|
-19%
|
$32,061
|
$1,364
|
41%
|
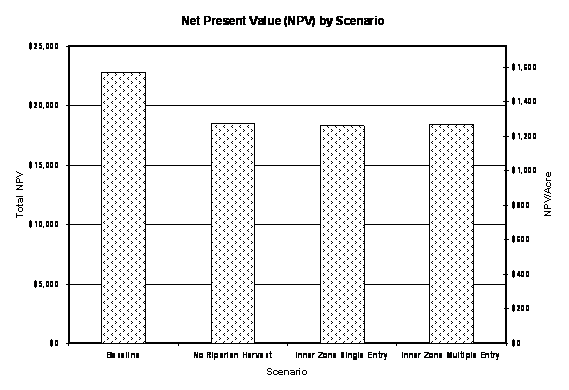 |
| Figure A.9.3: | NPV by scenario for Case Study 9. To meet the inner zone TPA and basal area requirements took 60 after regeneration. |
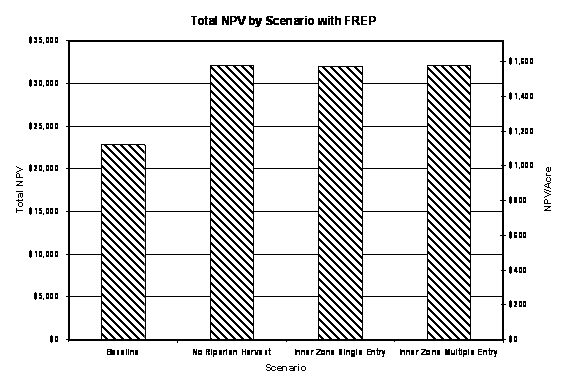 |
| Figure A.9.4: | NPV with FREP by scenario for Case Study 9. |
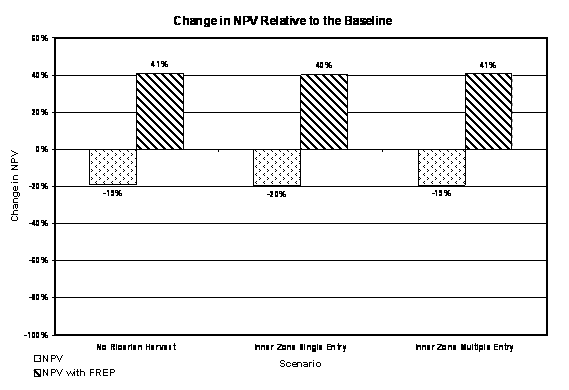 |
| Figure A.9.5: | Percent change (compared to the baseline) in NPV of cash flows over 90 years for Case Study 9. Retention requirements under the baseline are compensated at 100% in this case as it exceeds the 12.2% over-ride. Positive FREP values are also indicative of the long delay prior to initial harvest entry into the riparian stand. |
![]()

