|
 |
 |
 |


Factors Influencing Understory Douglas-fir
Vigor
in Multi-Cohort Prairie Colonization Stands
at Fort Lewis, Washington
|
Derek John Churchill
University of Washington
Abstract
Forest stands on Fort Lewis, Washington are being managed for
multiple values under an uneven-age silvicultural system that
relies on natural regeneration. In stands that were former prairies
and have excessively drained, outwash soils, Douglas-fir (Pseudotsuga
menziesii) is the only understory conifer present and the
principal regeneration species. Factors influencing the vigor
of Douglas-fir advanced regeneration were investigated in thirteen
stands at both the individual tree and stand levels. Live crown
ratio, height-to-diameter ratio, height growth, and crown density
were combined to produce two methods of quantifying vigor: a
regression model that predicts volume growth as a percent of
maximum site potential (relative volume growth) and a simple
vigor classification system. Overstory recruitment potential
and release potential were estimated for different classes of
vigor. At the individual tree level, understory Douglas-fir with
low levels of understory competition was found to require an
average 45% full sunlight or overstory stocking of less than
150 SDI (30% full site occupancy (Long 1985)) to achieve vigor
levels where recruitment into the overstory without further release
is likely. Between 10-35% full sunlight or 150-275 SDI (30-55%
full site occupancy), regeneration was found to be growing slowly
but able to maintain release potential, especially if less than
5m in height. Below 10% full sunlight or above 275 SDI (55% full
site occupancy), regeneration was scarce and of very poor vigor.
Regeneration with high levels of understory competition was found
to require more light to achieve the same growth rates, and this
effect increased in higher light environments. A stand level
model was developed and demonstrated that while overstory density
is the dominant factor influencing understory vigor, understory
stocking, shrub cover, spatial arrangement of the cohorts are
also important. A three stage progression of overstory treatment
types is recommended to balance the tradeoffs between stand volume
growth, structural and habitat goals, and understory vigor. By
combining elements of shelterwood, group selection, and single
tree selection systems, multi-cohort, structurally complex stands
can be created and maintained in a shifting mosaic of patches.
Results suggest that uneven-age management is possible with Douglas-fir
on dry sites, although stands will be structurally different
from west-side, late-successional forests that contain shade
tolerant conifers and will require periodic stand entries to
maintain. TABLE OF CONTENTSClick here for a PDF Version of this Thesis
LIST OF FIGURES
LIST OF TABLES
ACKNOWLEDGEMENTSI would first like to acknowledge and thank Jeff Foster and Gary McCausland of the Fort Lewis Forestry Program for funding this project and giving me the opportunity to work and do research at Ft. Lewis. Jim Rhode and numerous members of the Fort Lewis Forestry field crew also provided valuable assistance along the way. I am also grateful to: Bruce Lippke and Larry Mason of the Rural Technology Initiative at the College of Forest Resources for their support throughout my 3 years at the CFR; members of my graduate advising committee, Drs. Tom Hinckley, Bruce Lippke, Eric Turnblom, Kristina Vogt, and Tim Harrington for their guidance, ideas, encouragement, and feedback throughout the project; Drs. Tim Harrington, Dave Marshall, Connie Harrington, and the summer field crew of the U.S.F.S. Pacific Northwest Research Station in Olympia, for being key partners in the project and offering invaluable advice and field assistance; Amy Miller for her help in the field and partnership in the analysis; fellow grad students at the CFR who were a vital part of both this project and my overall graduate experience, Andrew Larson, Michael Andreau, Cara Nelson, Elaine Oneil, Ann Andreau; Bianca Perla, Mitchell Almaguer-Bay, Mariano Amoroso, Jeff Comnick, and many others; Dr. Gabe Tucker for his mentorship early on in this project; Dr. Rolf Gersonde for his helpful ideas and critical review; and Dr. Charlie Halpern for the use of field equipment. Finally, I would like to thank my father Jack Churchill for his help in the field and encouragement, and most of all my wife, Wendy Finkleman for her tremendous support and understanding during this project.
IntroductionIn recent years, changing social values and increasing scientific understanding of forest ecosystems have led to greater consideration of alternatives to traditional even-aged management in forests west of the Cascade Mountains in the Pacific Northwest, especially where economic returns are not the driving management objective (Gordon 1994, Kohm and Franklin 1997, Curtis et al. 1998). After research into “partial cutting” was largely abandoned in the 1950’s (Munger 1950, Issac 1956), it was re-established in the mid 1990’s (Curtis et al. 1998, Ruel et al. 2000, Hunter 2001). Much of this research has been aimed at developing the knowledge and tools to grow conifer species under partial overstories, whether in silvicultural prescriptions designed to retain or accelerate the development of late seral structures (Franklin et al. 1997, Carey 2003), restore riparian function (Emmingham et al. 2000, Tappeiner et al. 2002), or establish successful regeneration in uneven-age management systems (Tappeiner et al. 1997, Miller and Emmingham 2001, Coates et al. 2003). Managers and landowners have been reluctant to implement alternatives to traditional even-aged management on a wider level, however, due in large part to the lack of proven management strategies to grow Douglas-fir (Pseudotsuga menziesii (Mirb.) Franco) in the understory, and the perception of an inevitable shift in overstory composition towards more shade tolerant species (Becker 1995, Emmingham 2002). Considerable debate exists in the scientific literature and
among foresters whether uneven-age management of Douglas-fir,
which is moderately shade tolerant (Issac and Dimock 1958, Herman
and Lavender 1990), is possible using single tree selection or
whether group selection is necessary (Curtis 1998, Malcolm et
al. 2001). Single tree selection typically involves removing
individual mature and low-vigor trees dispersed throughout the
stand in relatively frequent light thinnings with the goal of
creating and maintaining multiple cohorts over time (Smith et
al. 1997). While establishment of Douglas-fir seedlings in the
understory is not uncommon after light thinning entries (Bailey
and Tappeiner 1998, Harrington et al. 2003), growth rates generally
decline substantially as the sapling stage is reached (1-3m,
3-10ft), virtually eliminating recruitment into the mid- and
upper-canopy (Herman and Lavender 1990, Williams et al. 1999).
To maintain adequate vigor and recruit into the mid- and upper-
canopy, understory Douglas-fir saplings require a substantial
amount of growing space (Oliver 1995). Thus for single tree selection
to work, it is recommended that the overstory be heavily thinned
early in a stand’s development and then kept open through
successive light thinnings (Bailey 1996, Emmingham et al. 2000,
Brandeis et al. 2001b, Tappeiner et al. 2002).
The critical question in making either approach work is the amount of growing space Douglas-fir needs to maintain adequate vigor in the understory, and thus at what densities and spatial arrangements to maintain the overstory. Numerous investigators have addressed this question by correlating measures of overstory density and/or light availability with understory Douglas-fir growth, both at the stand and individual tree level (Table 1). From these studies, a very general conclusion can be drawn that a maximum of 40% of full stocking or 30-40% of full sunlight is necessary to maintain adequate vigor. However, conclusions from different studies have been variable and can be difficult to develop into comprehensive silvicultural guidelines for several reasons. First, the definition of adequate vigor is often not well defined or consistent among studies. Many authors directly or indirectly define adequate vigor as growth rates that are close enough to open grown, maximum site potential for a tree to recruit into the overstory without any release in the future (Wampler 1994, Bailey 1996, Brandeis et al. 2001b, Drever and Lertzman 2001) Yet, in uneven-age management systems with periodic overstory removals, understory trees need only to maintain sufficient leaf area, stem stability, and root system to avoid mortality and be able to respond to release in the future (O'Hara 1996, Ruel et al. 2000). Thus growth rates that are far below open grown, maximum site potential can be considered adequate for understory trees. Clearly defining vigor in terms of a tree’s ability to grow into the overstory without further release, maintain its release potential, or merely survive is a critical step in translating the variable results created by the different definitions of adequate vigor (Table 1) into guidelines for uneven-age management.
Defining vigor in terms of maintaining release potential requires an understanding of response to release. Results from studies on release of Douglas-fir, as well as inference from release studies of other western conifers, suggest that Douglas-fir can respond to release after even severe suppression and that risk of mortality, lag time before response, and post-release growth are strongly related to duration of suppression, and pre-release growth rates and live crown ratio (LC ratio) (Helms and Standiford 1985, Carlson and Schmidt 1989, Tesch and Korpela 1993, Kobe and Coates 1997, Deisenhofer 2000, Wright et al. 2000). Thus, acceptable levels of risk and desired post-release growth rates should guide definitions of pre-release vigor in terms of thresholds for pre-release growth rates or live crown ratio (Helms and Standiford 1985, Tesch and Korpela 1993, Ruel et al. 2000). Several investigators have designed vigor classification systems that have set such thresholds for Douglas-fir (Carter and Klinka 1992, Emmingham et al. 2000, Miller and Emmingham 2001). However, these systems are based on different growth metrics, involve qualitative criteria that can be difficult to replicate, or were designed for different size classes of trees. As rates of height and radial growth are affected by tree size, vigor thresholds set for seedlings based on absolute, and not relative, growth metrics may not be appropriate for saplings. The same is true for height to diameter ratio (HD ratio). Although an HD ratio of 60 is a commonly used threshold of adequate vigor (Newton and Comeau 1990), this number is questionable as the stem height of diameter measurements and the total height of the tree influence the value and implication of the ratio (Mustard and Harper 1998, Wilson and Oliver 2000). More research is needed to develop thresholds for multiple growth metrics that can be applied across different size classes and correspond to definitions of vigor that have clearly defined management implications. The second reason for the lack of comprehensive guidelines for uneven-age management of Douglas-fir is the difficulty in accounting for the large number of factors that affect growing space in complex stands, often with methods that were designed for even-aged management systems. Traditional, distant-independent stem measurements such as basal area or Stand Density Index (SDI) (Reineke 1933) are often poorly correlated at the plot level to light levels reaching the understory (Chan et al. 1997, Brandeis et al. 2001a, Aukema and Carey 2003) and thus are typically weak predictors of understory growth for individual trees (Wampler 1994, Deisenhofer 2000, Brandeis et al. 2001a). Light or canopy closure measurements have shown greater predictive power (Carter and Klinka 1992, Chen and Klinka 1997, Drever and Lertzman 2001), but are time consuming and hard to translate into stand level management prescriptions. Accounting for side shading (Oliver and Larson 1996) from intra-cohort and shrub competition is also essential to better explain what controls the growth of advance regeneration (Brandeis et al. 2001b, Duchesneau et al. 2001, Canham et al. 2004). Adding further complexity is research that suggests that Douglas-fir may be more shade tolerant on drier sites (Carter and Klinka 1992, Wampler 1994, Bailey 1996, Chen et al. 1996, Williams et al. 1999). A final factor is tree size. There is evidence that as Douglas-fir get older and taller, its light requirements to maintain growth also increase (Carter and Klinka 1992, Messier et al. 1999).
Growth models have been developed for multi-cohort stands in other forest types that factor in some or all of the complex set of variables listed above to help managers determine stocking guidelines for different stand structures and management objectives. These models include: stand-level, distant-independent models based on crown competition (Biging and Dobbertin 1995, Hasenauer and Kindermann 2002), leaf area (O'Hara and Valappil 1999), or SDI (Long 1995, Ralston et al. 2003); and spatially explicit crown and light models (Biging and Dobbertin 1995, Coates et al. 2003, Gersonde 2003). Many of these models show promise for uneven-age management of Douglas-fir. However, spatially explicit models in particular require more inventory information and technical resources than most management agencies, who are accustomed to models designed for even-age stands such as Forest Vegetation Simulator (FVS) or Organon, typically have. There is a clear need for stand level growth models that do not require spatially explicit inventory information but can account for the vertical and horizontal heterogeneity of multi-cohort stands (Monserud and Robinson 2003). In this study, I inventoried vigor and stand structure of naturally regenerated Douglas-fir advanced regeneration in dry-site conifer forests in the southern Puget Lowlands of Washington State. Methods were developed to quantitatively assess and classify vigor using metrics that can be integrated with existing inventory datasets. I sought to clearly define the implications of different levels of vigor by linking quantitative classifications of vigor with estimates of release potential and the likelihood of recruitment into the overstory without further release. These estimates were made from some data gathered in this study, but primarily from results from other investigators. I then used these vigor assessment methods to investigate and model the factors influencing vigor of understory regeneration at the individual tree and stand levels. Finally, results were combined into silvicultural recommendations for uneven-age management in dry site Douglas-fir forests. MethodsStudy area
Field sampling The 13 stands in the phase I stand inventory, totaling approximately
680 ha (1500ac), were selected using a proportional, stratified
random sample. First, the total population of prairie colonization
stands was divided into 3 overstory basal area (BA) classes:
18-29m2/ha (90-142ft2/ac), 30-39 m2/ha
(143-190 ft2/ac), and 40+ m2/ha (190+ ft2/ac).
Stands that had been thinned in the last five years or had access
restrictions were excluded. Stands were then randomly selected
from the three BA classes in proportion to the number of stands
in each BA class in the total population. This process produced
a set of stands that were a good representation of the range
of structural conditions found in the total population of prairie
colonization stands (Foster, pers comm.). All stands had had
at least two thinning entries. Site index (King 1966) ranged
from 34-38 (metric) (110-125, English) (Foster, unpublished data)
and was assumed to be 35 (metric) (115; English) for all stands
given that within stand variation is as great as among stands
due to the heterogeneity of the glacial soils. The overstory was sampled in two ways. First, trees over 15cm (6in.) diameter at breast height (dbh; diameter at 1.37m above ground level) were sampled using point sampling (variable radius plots) (Bitterlich 1947). Basal area factors used were 28, 34, or 40 (English scale) depending on the basal area class of the stand. Height, crown length, and crown width were measured on two randomly selected trees per plot. Second, a visual estimate of the percent of open sky (VOS), excluding shrubs or trees under 15cm (6in.) dbh, was made from each plot center. The same person estimated VOS in all 13 plots. This VOS measure was modified from Brandeis et al. (2001a) and Deisenhofer (2000) and consisted of estimating the percent openness of the canopy in both the northern and southern halves of the sky and averaging them. Where VOS was at least 20% higher in the southern half, the average was weighted to adjust for edge effects (Hasenauer and Kindermann 2002) using the equation below. It is treated as a unitless, relative measure, instead of an absolute measure of percent of open sky. Eq. 1: Weighted VOS = (3VOS,South + VOS,North)/4
Understory trees, defined as less than 15cm (6in) dbh and taller than 1.37m (4.5ft), were sampled within a circular fixed area plot of either 0.04 or 0.008ha (0.1 or 0.02ac), depending on the BA class of the stand. For all understory trees, dbh was measured and crown class determined based on the height of trees within a cohort: dominant, co-dominant, intermediate, or overtopped. Crown class for open grown trees not near clumps was determined by comparing the height of the tree to nearby trees in the same cohort. The following additional measurements were taken for all understory trees, or a sub-sample, depending on the number trees in the plot: diameter at 15cm (6in) above ground; total height; height to live crown, measured at the lowest whorl with two live branches with new growth; annual height increment for each of the past six years; total age determined from whorls and bud scars, crown density, and degree of crown crowding from intra-cohort competition (neighboring understory trees) and shrubs. Crown density was measured with a 1-5 rating that combined visual estimates of average branch length and diameter, number of internodal buds and branches, and number of branches and each whorl; all in the last 3 years of growth. Ranges of these variables used to rate trees are provided in Appendix A. Carter and Klinka (1992) and Miller and Emmingham (2001) developed similar systems to rate vigor based on visual crown ratings. Crown crowding, defined as any infringement on the live crown of the sample tree from neighboring understory trees in the same cohort or shrubs, was measured using a combination of methods from Howard and Newton (1984) and Wagner and Radosevich (1991, 1998). At the base of the live crown, a horizontal, two dimension circle was visualized around the tree using the longest live branch as the radius. The proportion of this two dimensional circle (projected crown area) overlapped by foliage of neighboring trees or shrubs from the base of the live crown to the top was estimated to the nearest 10 percent. This combined measure of intra-cohort and shrub competition was termed percent crown overlap. A diagram of this method is provided in Appendix B. Data from the phase I stand inventory were generated from 13 stands, 212 plots, and 637 understory Douglas-fir trees and used to broadly characterize structure of the overstory, understory, and shrub layers. After this analysis, a sub-sample of 25 plots from the 212 phase I plots was selected for further intensive analysis. A stratified random sample was used to ensure that the phase II sub-sample of 25 plots came from a balanced distribution of light environments. At each phase II plot, two understory trees were selected for
destructive sampling: the tallest tree within the cohort and
the tree closest to the average height. For each tree, dbh of
all overstory trees were recorded in a 0.09ha (0.2ac) fixed area
plot as well as in a variable radius plot, both centered on the
sample tree. Before each tree was cut down, two methods were
used to measure crown crowding from intra-cohort competition
and shrubs. First, the percent crown overlap method from phase
I was expanded to include a vertical dimension. For each competitor,
the two dimensional horizontal overlap and the percent overlap
along the vertical live crown of the sample tree were estimated.
By adding all the competitors together, an estimate was made
of the percent occupancy of competing understory trees and shrubs
within a three dimensional cylinder projected from the base of
the live crown to the top of the tree with the radius being the
longest live branch. The second method consisted of measuring
the dbh of, and azimuth and distance from the stem of the sample
tree to, the stem of each competitor within a radius set by the
farthest competitor that overlapped the crown of the sample tree.
Competitors had to be as high as the live crown of the sample
tree. This variable radius method was chosen based on Wagner
and Radosevich (1991, 1998), who found that “The optimum
radius appeared to be defined by those neighbors whose crowns
intermingled with that of the Douglas-fir.” A neighborhood
competition index (NCI) was calculated for each tree based on
the following equation from Canham et al. (2004), where DBHi is
the diameter at 1.37m of ith competitor, Disti is
the distance to the ith competitor, and
As competition from shrubs and other tree species was minimal compared to intraspecific competition, the same parameters were used for all competitors. Parameter estimates for these equations were iteratively tested to determine the most powerful values used in later analysis. After each tree was cut down, percent open sky was estimated using the VOS procedure described above and a hemispherical photograph was taken as close to 66% of tree height as could be safely reached with a 5m (16.4ft) orchard ladder using a digital Nikon camera with a 2.5 F-Stop fisheye lens mounted on a monopod with a level. Gap Light Analyzer/C, version 2.0 light modeling software (Frazer et al. 1999) was used to analyze these photographs and determine site openness and an index of total solar radiation (TSR) (Canham et al. 1990, Frazer et al. 1997). TSR combines the seasonal distribution of the sun’s path with the distribution of canopy openness to calculate a single index of available light in units of percentage of full sun for a specified growing season which was set at April 1 – Oct 15th for the Ft Lewis area. All tree measurements from phase I were also re-measured on each phase II tree. In addition, branch length and number of internodal buds were measured for the last 3 years. Percent cover of shrubs by species was estimated in a 0.008ha (0.02ac) fixed area plot around each tree. Height growth increments were measured from the top of the tree to breast height and checked against rings counted on a disc cut at dbh. Discs were also cut at ground level and at the base of the live crown. These discs were later oven dried for 48 hours, sanded, and analyzed using a high resolution computer scanner and WinDENDRO v2001a (Regent Instruments, Inc.) tree ring analysis software, which calculated age and annual radial growth along 4 radii for each disc. These radial growth measurements were combined with height growth data to calculate annual volume increment using a tapered rocket formula where the three discs were used to create two tapered cylinders and a cone at the top. Inside bark diameters were used. Height to diameter ratio history was also calculated using the ground level disc, but diameters were adjusted for bark thickness, drying, and the discrepancy between field measurements with a dbh tape and radial measurements on a disc. This was done by multiplying all inside bark diameters by the ratio of the 2004 field measured diameter to the 2004 inside bark diameter obtained from WinDENDRO.
Assessing vigor Eq 3: y = 0 .018x2 - 0.27x - 466.74 This quadratic equation was the best fit for the maximum site potential tree data (R2= 0.96, p<0.0001) until tree heights approached 1.4 meters, below which it underestimated maximum potential growth. A graph of this regression model is provided in Appendix C. For the 54 trees that were intensively analyzed in phase II, actual RVG was calculated for every year from when the tree was 1.37m to its current height. The last 5 years were averaged to create the primary vigor metric for further analysis: actual 5yr RVG. For the 637 understory trees in the stand inventory, however, coring trees to measure diameter and volume growth was intentionally not done to keep the sampling design within what could be practically integrated into the existing Fort Lewis inventory system. Exploratory analysis was thus done with the 54 tree data set to test which variables that were measured in the stand inventory best correlated with actual RVG. These variables were: past 5yr mean annual height growth increment (HG), 2004 live crown ratio (LC Ratio), 2004 height to diameter ratio (HD Ratio), and visual crown density rating (CDR). Single variables, as well as biologically meaningful products of these variables, were tested using simple linear regression. Stepwise, linear regression was then used to test multiple variables and derive a best fit model using SPSS, version 12.0 (SPSS 2003). This model was used to predict 5yr RVG for the 637 understory trees from the stand inventory. The second method of assessing vigor was a simple four class classification system. This additional method was developed to provide a more efficient and sufficiently accurate means for managers to assess vigor of understory cohorts, conceptualize vigor, and design silvicultural prescriptions. Classes were based on thresholds of HD ratio, HG, and LC Ratio that are listed in Table 2. Trees must meet the thresholds for all three metrics to be placed in a certain class or else they are placed in the next lowest class. Crown density rating was not included to allow for this vigor assessment method to be easily used with existing data sets. Also, crown density rating is a qualitative measure that requires consistency, which can be hard to achieve with multiple observers.
A HD ratio of 70, measured at 15cm above ground, was chosen as the HD threshold for high vigor (class 4) (Table 2). This correlates with an HD ratio of 60 at the root collar. This threshold value is based on observations from: Newton and Comeau (1990) who suggest that HD ratios over 60, measured at the root collar, threaten the long term growth potential of young plantation trees; Wonn and O'Hara (2001) who showed that an HD ratio of 80, measured at dbh, is a critical threshold for stem stability in interior Douglas-fir; Cole and Newton (1987) who found that decreases in height growth occurred at HD ratios above 70 in plantation trees; and Emmingham et al. (2000) who specified 60 as a threshold for a vigorous understory tree, 80 for a stable tree, and 100 for a weak tree. Height growth thresholds were based on approximately 66%, 33%, and 15% of the site index potential height growth for the average tree height found in the study (King 1966). Live crown ratio thresholds (Table 2) were based on the positive relationships of live crown ratio to post-release growth observed by Helms and Standiford (1985), Seidel (1983a), Oliver (1985), and Tesch and Korpela (1993); as well as recommendations by Emmingham et al. (2000). Table 2: Summary data for vigor classification system for understory trees. Trees must meet thresholds for all three growth metrics to be in a class, otherwise they are placed in the next lowest class.
The two methods of assessing vigor were compared to evaluate
whether the simpler vigor classification system could estimate
5yr RVG within a reasonable range. Analysis of variance (ANOVA)
and a Scheffe’s post hoc test was used to test for significant
differences between the mean RVG values for each vigor category,
for both the phase 1 and phase 2 datasets (
Overstory recruitment and release potential Similar to Tucker and Foster (unpublished), the number of years needed to reach the average overstory height of the 13 stands, 45m (148ft), was used as an indicator of the likelihood of reaching the overstory without further release, assuming that current height growth rates are maintained and that trees are currently 5m (16.4ft) in height. This indicator was a simple thought exercise used to compared vigor classes and purposely ignored the dynamic nature of forest stands and the fact that Douglas-fir height growth begins to slow as trees reach approximately 25m (80ft) on site class III sites (King 1966). As a biological limit exists regarding how slow trees can grow and remain alive (Oliver and Larson 1996, Kobe and Coates 1997), risk of mortality from suppression was then examined. As the 54 tree sub-sample was a representative sample of the total population of understory trees, the slowest radial growth rates found from analysis of lifetime radial growth rates were assumed to be close to the threshold of mortality. These minimum growth rates were compared with mortality threshold rates from other studies. Estimates of mortality risk for each vigor class were based on how close the past 5yr mean radial growth increment were to these mortality thresholds. HD ratio thresholds for each vigor class were also considered as high HD ratios are associated with a higher risk of stem failure and suppression mortality (Wilson and Oliver 2000, Wonn and O'Hara 2001). Hemispherical photographs were then used to evaluate whether trees from different classes had enough space directly above them to recruit into the overstory, assuming that existing overstory trees would expand their crowns. Percent of total solar radiation and visual examination of the photos were used. Release potential was defined in terms of a released tree’s ability to regain comparable growth rates, for a given light environment, to trees that did not undergo suppression. To assess release potential, lifetime RVG histories of the 54 intensively analyzed trees were examined for patterns of suppression and release. Trees that showed patterns of release were compared to trees growing in similar light environments that had not undergone suppression. Lifetime HD ratios were also examined to see the extent to which trees recovered from high ratios. Although the exact history of overstory removal around each tree could not be confidently determined, it was assumed that at least some of the trees growing in open conditions had been released in the past and should therefore show a growth response. Trees growing in open conditions that were growing at low RVG rates were closely examined to determine why they had not responded to release. Finally, the live crown ratio thresholds for each vigor class were also considered.
Factors influencing vigor: individual tree and stand
level At the stand level, two methods were used to compare the overall vigor of the understory between stands. First, the number of understory trees per acre in each vigor class was tabulated for each stand. Second, the stand level, mean tree 5yr RVG was calculated for all trees, and then separately for crop trees, by averaging the mean RVG of each plot with understory trees. A non-linear model was developed to explain variations in stand mean RVG and test which factors influence understory vigor at the stand level. The model was based on the concept that average growth of an understory cohort is determined by growing space available to the cohort divided by the number of trees in the cohort (O'Hara 1996, Oliver and Larson 1996). Although multiple understory cohorts did exist in some stands, all understory trees were lumped into one cohort to simplify the analysis. Stand density index (SDI) was chosen to measure growing space occupancy for both the overstory and understory, as it has been shown to be a good indicator of leaf area index (Long 1995, O'Hara 1996) and is commonly used to measure site occupancy (Long 1985, Long and Daniel 1990). Percent shrub cover was tested in the model to account for its potential effect on resource availability. The average crown overlap for the stand was also tested to account for the spatial distribution of understory trees; whether they are clumped or more evenly distributed. A final variable was tested to account for the distribution of understory trees in relation to the heterogeneity of overstory density. This variable was the ratio of average overstory SDI for plots with understory trees to the average overstory SDI of all the plots. Stands with understory trees in more open plots thus have a lower value than stands where more trees are in plots with higher levels of overstory or where gaps are occupied with shrubs instead of trees. Several model forms were tested and the best combination of variables was chosen through iterative trials. SPSS, version 12.0 (SPSS 2003) was used for this analysis.
ResultsStand inventory Assessing vigor Stepwise linear regression produced the following best fit model to predict 5 yr mean RVG using all the above variables and total height (Ht) (R2= 0.89. p<.0001, Standard Error of Estimate (SEE) =0.058, All coefficients are significant p<.005). Eq 4: Predicted RVG = 1.337 + 0.076LCR2CDR -
0.009Ht(m) - 0.028ln(HD Ratio) + .003HG(cm) Without height, HG drops out of the model due to collinearity with LCR2 *CDR. In the full model, however, the variance inflation factor (VIF) is below 10 for each variable indicating the collinearity is not significant. Height is a not a significant predictor of RVG on its own, but affects the interaction of the other variables. Residual and QxQ plots indicated a relatively constant variance and approach to normality for the overall model. A second, slightly weaker model to predict RVG that does not include crown density rating is listed in Appendix D for use with data sets where crown density rating is not available. The model in equation 4 produces negative RVG values for trees with very high height to diameter ratios and/or very low live crown ratios. Few of these low vigor trees were part of the 54 tree, phase II sub-sample used to create the model only the average and tallest trees were selected for sampling. While the model is adequate for intermediate, co-dominant, and dominants trees, it is likely to be less accurate for trees from the overtopped crown class. Although negative values do not make biological sense, they were included in subsequent analysis as indicative of RVG close to zero. The second method of assessing vigor, vigor classes based on thresholds, is compared with RVG in Figure 3. The extreme upper values in each category are due to high height to diameter ratios. For the 54 phase II trees, the means of actual RVG and radial growth for the 4 vigor categories are all significantly different from each other (p<0.05). The means of RVG from 637 trees from the phase I data set, which are also significantly different from one another (p<0.001)., all fall within the 95% confidence intervals of the phase II dataset displayed as the solid horizontal lines in figure 3a. There is also a clear separation of the 50th percentile boxes of each class within the boxplots in figure 3b. Finally, the combined phase I and II average RVG values (rounded to the nearest 5%) for each vigor class are presented in Table 2.
Overstory recruitment and release potential
Factors influencing vigor: individual tree level
Dividing crown overlap into two classes (high and low) and including it as an indicator variable generated the best regression models to predict RVG (Figures 5 & 6). The breakpoint for the two classes that produced the best models was 30% for the 3-dimensional crown overlap measured on the 54 phase II trees, and 50% for the 2-dimensional crown overlap measured on the 637 trees in the phase I dataset. Regression models are constrained to the range of the data and caution should be used making any extrapolations. The boxplots in Figure 7 were included as a secondary method of showing the relationships between RVG and VOS, SDI, and crown overlap and to better display the distribution of the data.
In the phase I VOS (Figure 6a), phase II VOS (Figure 5a), and phase II TSR (Figure 5b) regression models, ANCOVA showed statistically significantly steeper slopes and higher R2 values for trees with low crown overlap than trees with high crown overlap. Intercepts were not significant for either high or low crown overlap. The effect of crown overlap was not significant at the lowest light levels but became significant at the point where the 95% CI of the regression lines diverged, and had an increasing effect as open sky increased and overstory density decreased. The divergence in the 95% CI intervals is due to increasing differences between means, as well as a drop in variance, as light levels increased.
The phase II VOS model (Figure 5a) has a higher R2 value and lower intercept and slope than the phase I VOS model (figure 6a). The drop in R2 values is most likely due to increased variance introduced by the RVG prediction model and increased measurement error as VOS was measured at plot center in phase I and not for each individual tree as in phase II. Phase I and II regression models for SDI had similar slopes, intercepts and R2 values and so only the results for the phase I, larger data set are presented in Figure 6b. Low crown overlap had a higher R2 value and a significantly different intercept than high crown overlap, but the slope and curvature were not significantly different. Similar to the VOS models, a pattern of an increasing effect of crown overlap as SDI decreased was found. Between 200 and 250 SDI (Figure 6b), there is a clump of 6 trees above 35% RVG that were all on the edges of gaps and so were receiving more light for their SDI value than trees that were underneath a more continuous canopy. Accounting for this clump of outliers, there is a clear jump in the response of RVG at 150 SDI, which is very evident in the boxplot shown in Figure 7b. It should be noted that 0 SDI does not mean that the tree is open grown, only that no overstory trees are within the plot radius measured. The upward lip in the quadratic model beginning at 350 SDI is due to the lack of data above this level and the nature of the quadratic function. A quadratic model form was chose over an exponential form as it had a much higher R2 value. The model should be constrained to SDI values less than 350. The second vigor assessment method, the 4 vigor classes, was also related to VOS, SDI, and crown overlap using boxplots (Figure 8). These were derived to clearly show the ranges of VOS and SDI values that trees from the 4 vigor classes were found in.
VOS showed a strong relationship to TSR (Figure 9), especially for trees with lower crown overlap (R2=0.86). This was expected as VOS measured openness of just the overstory trees, while TSR measured all trees affecting the light environment of the subject tree. The relationship is not a 1:1 relationship as VOS over-predicts TSR at lower levels and under-predicts it at higher levels. This indicates that VOS is a relative and not absolute measure of actual solar radiation and should not be interpreted or applied as an absolute percent of open sky. The regression equation in Figure 9 can be used to convert the relative, visually estimated VOS into TSR in order to compare light levels with other studies.
In addition to the main vigor metric, RVG, regression models predicting live crown ratio and HD ratio were developed from the same set of explanatory variables as RVG. LC ratio and HD ratio showed the same basic relationships to VOS, SDI and crown overlap. Regression models were consistently weaker than models for RVG and so are not presented here. Instead, boxplots are shown in Figure 10 to display the distribution of LCR and HD ratio data by VOS and SDI class and crown overlap.
Factors influencing vigor: stand level
Eq. 5:
Eq. 6:
Between 85-90% of the variation in RVG was explained with only overstory SDI, understory SDI, and tall shrubs or low shrubs in each model. Non-significant coefficients were included to add predictive power. As only 13 data points were used, the asymptotic confidence intervals of the non-linear regression method are large. With more data points, they may in fact be skewed in a negative or positive direction and be significant.
DiscussionAssessing vigor Combining all four of these metrics into a single model based on relative volume growth proved to be a more powerful approach to both predicting current volume growth and measuring response to overstory stocking and crown crowding than using individual, absolute metrics. All of the coefficients have signs that make biological sense. The significance and negative sign of total height in the model, as well as its affect on the significance of height growth, reflects the change in maximum potential height and radial growth and exponential increase in volume growth with increasing tree size (King 1966). Other investigators examining growth of understory Douglas-fir in relation to environmental variables have generally used two or more vigor metrics in their analysis (Carter and Klinka 1992, Mailly and Kimmins 1997, Williams et al. 1999, Deisenhofer 2000, Drever and Lertzman 2001). However, combining multiple crown and growth metrics into a single, relative metric that is strongly correlated with volume growth is advantageous in situations where coring large numbers of trees is not feasible and investigators want a single, continuous, and comprehensive vigor metric to assess and compare advanced regeneration across a wide range of tree sizes. In situations where a more detailed understanding of understory vigor is needed, the model may be less appropriate as multiple metrics provide more complete information and variance is likely increased by using a predicted instead of a directly measured metric. The second method of assessing vigor suggests that understory trees can be separated out into four ranges of RVG using the height growth, HD ratio, and live crown ratio thresholds with a degree of accuracy that is appropriate when general and rapid stand assessments are desired and a continuous variable is not needed (Figure 3). The height growth, LC ratio, and HD ratio thresholds (Table 2) used to classify trees are generally supported by results from the RVG scatterplots in Figure 1. For the 18 trees growing at more than 35% RVG, all had live crown ratios greater than 65%, only one had height growth less than 30cm, and only two had HD ratios above 70. These two trees both had high crown overlap, suggesting that trees growing above 35% RVG will maintain HD ratios less than 70 if they have less than 30% crown overlap (3-dimensional). |
||||||||||||||||||||||||||||||||||||||||||||||||||||||||||||||||||||||||||||||||||||||||||||||||||||||||||||||||||||||||||||||||||||||||||||||||||||||||||||||||||||||||||||||||||||||||||||||||||||||||||||||||||||||||||||||||||||||||||||||||||||||||||||||||||||||||||||||||

 |
| Figure 12 : Diagram of conceptual model of factors influencing vigor of understory regeneration. |
![]()
This stand level model was developed from only 13 stands at a single point in time and cannot be used to predict the effects of treatments. The high R2 value of the model is likely to be a product of having only 13 data points and five or six variables. With more stands, the R2 value would likely decrease. However, the fact that between 85-90% of the variation in RVG was predicted with only overstory SDI, understory SDI, and tall or low shrubs, suggests that strong, stand level relationships between understory vigor, overstory and understory SDI, and shrub cover do exist. Until more stands are included, this model should be used as a conceptual model and a rough guide of the quantitative relationships between understory vigor and the predictor variables.
Separate from the stand level model, overstory SDI is well correlated with understory stocking, whether measured by tpa or SDI (Figure 11b). The exponential relationship suggests that as stands are opened up during future thinnings, natural regeneration will provide sufficient understory stocking levels to maintain adequate growing stock under current thinning regimes. Miller and Emmingham (2001) found that natural regeneration provided sufficient growing stock in selection thinning systems in similar Douglas-fir forests. However, many gaps found in this study were not well stocked with regerenation and understory crop tree stocking levels appear low in many of the stands (Table 3). A detailed analysis of growing stock under different thinning regimes should be undertaken to determine if natural regeneration should be augmented with planting.
Conclusions and Management Recommendations
To assess vigor of understory Douglas-fir, height growth, LC ratio, HD ratio, and crown density rating (a visual estimate or measured variable of crown density, such as number of internodal branches or branch length) can be combined together into a powerful indicator of vigor: relative volume growth (RVG). RVG allows for comparisons across a wide range of size classes, relates easy to measure growth metrics to volume growth, and provides managers with a concrete measure of how understory trees are growing compared to the maximum potential for that site. The qualitative crown density rating can be dropped if necessary with only a small loss in predictive power (Appendix B). Constructing a maximum volume growth curve and predictive regression models for a site, however, requires intensive sampling and an initial investment of time to reconstruct volume growth in the laboratory.
![]()
Understory tree vigor can also be assessed via a classification system that uses thresholds of height growth, HD ratio, and LC ratio to place trees into four vigor classes. This simpler system is sufficient for most management applications and can be easily integrated into most stand exam, marking, or cruising protocols. With some training, field technicians can quickly classify trees in the field using only visual estimates of these growth metrics, or by taking height and diameter measurements and visually estimating height growth and live crown ratio.
It is very likely that most of the Douglas-fir regeneration (vigor classes 1-3) found in this study will need release from overstory removal in order to recruit into the overstory. Although Douglas-fir appears to be able to maintain slow growth rates, reasonable LC ratios and HD ratios, and release potential in low light environments for several decades, it is unlikely that Douglas-fir can persist at slow growth rates in the understory for the many decades and centuries it would take for the overstory to be thinned by natural mortality. Understory trees from vigor class one are currently at some risk of mortality from suppression and growth rates of trees from higher vigor classes will decline as the overstory closes over time.
If released, however, evidence from this study and all other studies reviewed suggest that Douglas-fir will respond. In all but the most severely suppressed trees, released trees appear able to regain growth rates comparable with trees that were never suppressed, recover from high HD ratios, and become viable replacement trees. The lag time before response to release, degree of response, and decline in HD ratios after release will depend on the level of overstory removal, the degree of crown crowding from understory competition after release, and pre-release live crown ratio and growth rates. Trees in vigor classes one and two will likely take a period of time to respond, while class three and four will likely respond very quickly. Furthermore, risk of stem failure from high HD ratios and lag time before response to release appear to increase with increasing tree height. Trees taller than 5m in both vigor class one and two should be carefully evaluated to determine if they are worth releasing. A LC ratio of at least of 50% and an HD ratio of not more than 80 (measured at 15cm above ground) are suggested thresholds to guide this evaluation. Trees taller than 10m, especially from vigor class 1, are unlikely to be worth releasing.
At the individual tree level, dominant and co-dominant Douglas-fir with low levels of crown crowding (less than 50% 2-dimensional crown overlap) need an average of 45% full sunlight to achieve vigor levels where recruitment into the overstory without further release is likely (vigor class four). For vigor class three trees, this average is 35% full sunlight. For vigor classes one and two, the average was found to be 10-15% full sunlight. Below 10% full sunlight, regeneration is likely to be scarce and in vigor class one. SDI levels are 150 (30% full site occupancy; 24 Curtis Relative Density) or less to achieve vigor classes three and four, 150-275 for classes one and two, and 275+ (55% full site occupancy; 44 Curtis Relative Density) for scarce stocking and class one trees. These percent of full sunlight and SDI levels are means, however, and growth rates of individual trees will vary considerably for a given level of light or overstory density.
![]()
Trees with high levels of crown crowding (greater than 50% 2-dimensional crown overlap) require more light to achieve the same vigor classes, and this effect increases in higher light environments. Only in very high light environments do they reach 35% RVG (Figure 5 & 6). Even in low light environments, negative effects on HD ratios and live crown ratios are apparent (Figure 10). Without release from crown crowding, trees with greater than 50% crown overlap will suffer serious losses in potential volume growth. Pre-commercial thinning is recommended for crop trees that have crown overlap over 50% or are likely to before the next stand entry. Pre-commercial thinning should be done after overstory thinning treatments as harvesting will damage a proportion of crop trees.
While maintaining the overstory below 150 SDI is necessary for recruitment of Douglas-fir advanced regeneration into the overstory, entire stands do not need to be thinned to these low levels. Most volume growth and stand structure exists in the overstory and thus early, heavy thinning across an entire stand will result in a major loss of potential volume growth (O'Hara 1996). It can also result in intense natural regeneration or shrub colonization of open areas. Between approximately 150-275 SDI, understory Douglas-fir grows slowly but appears able to maintain its release potential as long as understory cohorts do not get too tall. To balance the tradeoff between total stand volume growth and vigor of regeneration, patchy or spatially heterogeneous stands can be created and maintained in a shifting mosaic.
A three stage progression of overstory treatment types is recommended for patches within a stand. First, some patches can be managed to maximize volume growth in the overstory for one or more stand entries with light thinning from below treatments that keep stocking levels over 275 SDI. Although some regeneration may establish after these light thinning entries, it should not be a primary treatment objective as regeneration establishment will be a focus of the second stage. In this second stage, the overstory should be opened up enough (150-275 SDI) for regeneration to establish and maintain at an average vigor of class two. Depending on stand conditions and the objectives of the landowner, overstory trees can be removed across all diameter classes or from below, and small gaps can be created. These two cohort patches can be maintained for several stand entries by progressively reducing overstory density towards 150 SDI which will allow the regeneration to keeping growing, albeit slowly, and maintain its release potential. Depending on how vigorous it is, the patch should be moved to the third stage once the regeneration reaches 5-10m in height. In this stage, overstory SDI should be reduced below 150 to provide enough light for regeneration to grow vigorously and recruit into the overstory. To maximize growth of the regeneration cohort, all the overstory trees should be removed in one entry. If a multi-layered canopy is a management goal, however, the overstory can be removed over several stand entries and some overstory trees can be indefinitely retained for long term structure. Clumped retention, rather than dispersed retention, should be used as it provides more micro-sites with high light levels for the same amount of overstory SDI (Lieffers et al. 1999, Drever and Lertzman 2003) and thus uses growing space more efficiently. A third cohort may establish after scarification from successive stand entries in areas of the patch that are not stocked with regeneration. Once the main regeneration cohort reaches commercial size, the patch can be moved back to the first stage and begin the cycle again. If some members of the original overstory cohort are retained, a three cohort structure is likely to be achieved in the next cycle if it is not already present.
![]()
By ensuring that different patches within a stand are at different stages in the progression, a horizontally and vertically complex stand with multiple cohorts will be created. Although each patch may only have 1-3 cohorts, the patches put together will have more. Minimum patch size should be 0.25 ha (0.6 ac), as this appears to be the minimum gap size necessary for Douglas-fir to achieve high vigor levels in gaps (Ketchum 1994, Mailly and Kimmins 1997). Larger patch sizes, however, will be easier to manage. By varying patch size and the spatial arrangement of patch stages, a high degree of structural complexity can be created.
Active management of the regeneration cohort should be also considered during the second and third stages of overstory treatments. As described above, pre-commercial thinning and shrub control around crop trees has the potential to significantly increase vigor levels. While natural regeneration appears to be providing sufficient stocking under thinned understories, gaps captured by shrubs and grasses may need shrub control and or planting to ensure timely stocking and full utilization of growing space. Gaps occupied with native shrubs provide important wildlife habitat, but many gaps are filled with non-native Scotch Broom (Cytisus scopariu) in the stands inventoried in this study.
Prescriptions for individual stands will need to take into account the current vigor, height, crown crowding, spatial arrangement, and stocking levels of both overstory and understory cohorts, as well as shrub cover. Relatively uniform, even-age stands with high overstory SDI and little regeneration will need to be thinned to different densities throughout the stand to create a mix of stage one and two patches. Stage three patches can be added if large gaps are desired for wildlife habitat. Stands that already have a high level of patchiness can be treated by moving different patches to different stages depending on the stocking, vigor and height of the regeneration in each patch. To provide an approximate assessment of stands at the patch level, inventory data can be broken down by plot to show the distribution of overstory SDI and understory trees per acre, average height, relative volume growth, and crown overlap. Displaying this information on stand map using GIS can provide an idea of the spatial distribution of different cohorts (Appendix F).
To help managers determine the stand level tradeoffs between structural goals, wood production needs, habitat value, understory vigor, and risk tolerance, stand level models that are based on existing inventory information and accessible to managers are needed (Lieffers et al. 1999, Hasenauer and Kindermann 2002). While light based models are clearly superior at predicting growth of advanced regeneration at the individual tree level, density based models appear to work well at the stand level (O'Hara 1996). Although spatially explicit models are powerful tools to understand forest ecosystems and the effects of experimental treatments, they will require substantial investment of time and resources for development. At the same time, traditional inventory metrics and growth models designed for even-age management are often not sufficient for uneven-age management. Incorporating light measurements and simple metrics for intra-cohort competition, spatial distribution of cohorts, and shrub cover into distant independent stand models shows promise to make them versatile and powerful enough for most management needs.
The results of this study support the conclusions of other investigators that uneven-age management is possible with Douglas-fir on dry sites using two-aged shelterwood systems (Seidel 1983b, Tesch and Korpela 1993), group selection (Coates and Burton 1997), or single tree selection systems that include heavy thinning at some point (Deisenhofer 2000, Miller and Emmingham 2001). By combining elements of all three systems, structurally complex, multi-cohort stands can be created that also produce significant wood volume. These stands will be structurally different from west-side, late-successional forests that contain shade tolerant conifers, however, and require ongoing, periodic thinning to maintain.
![]()
List of References
- Anderson, W. W., A. O. Ness, and A. C. Anderson. 1955. Soil
survey of Pierce County, Washington. USDA Soil Conservation
Service, Washington, D.C.
- Aukema, J. E., and A. B. Carey. 2003. Management History
and thinning affect growth and survival of tree seedlings planted
underneath experimentally thinned Douglas-fir. A report to
Ft. Lewis. USDA Forest Service, Pacific Northwest Research
Station, Olympia, Washington.
- Aztet, T., and R. H. Waring. 1970. Selective filtering of
light by coniferous forests and minimum light energy requirements
for regeneration. Can. J. Bot. 48:2163-2167.
- Bailey, J. D. 1996. Effects of Stand Density Reductions
on Structural Development in Western Oregon Douglas-fir forests
- A reconstruction study. PhD dissertation. Oregon State University,
Corvallis, OR.
- Bailey, J. D., and J. C. Tappeiner. 1998. Effects of thinning
on structural development in 40-100 years Douglas-fir stands
in western Oregon. For. Ecol. Manage 108:99-113.
- Becker, R. 1995. Operational considerations of implementing
uneven-aged management. in K. L. O'Hara, editor. Uneven-aged
Management: Opportunities, Constraints, and Methodologies.
Montana Forest and Conservation Experiement Station, Missoula,
Montana.
- Biging, G. S., and M. Dobbertin. 1995. Evaluation of competition
indices in individual tree growth models. Forest Science 41:360-377.
- Bitterlich, W. 1947. Measurement of basal area per hectare
by means of angle measurement. Allg. Forest. Holzwirtsch, Ztg.
58:94-96.
- Brandeis, T. J., M. Newton, and E. C. Cole. 2001a. A comparison
of overstory density measures for describing understory conifer
growth. For. Ecol. Manage 152:149-157.
- Brandeis, T. J., M. Newton, and E. C. Cole. 2001b. Underplanted
conifer seedling survival and growth in Douglas-fir stands.
Can. J. For. Res. 31:302-312.
- Canham, C. D., J. S. Denslow, W. J. Platt, J. R. Runkle,
T. A. Spies, and P. S. White. 1990. Light regimes beneath closed
canopies and tree-fall gaps in temperate and tropical forests.
Can. J. For. Res. 20:620-631.

- Canham, C. D., P. T. LePage, and D. K. Coates. 2004. A neighborhood
analysis of canopy tree competition: effects of shading vs.
crowding. Can. J. For. Res. 34:778-787.
- Carey, A. B. 2003. Biocomplexity and restoration of biodiversity
in temperate coniferous forests inducing spatial heterogeneity
with variable density thinning. Forestry 76:127-136.
- Carlson, C. E., and W. C. Schmidt. 1989. Influence of overstory
removal and western spruce budworm defoliation on growth of
advance conifer regeneration in Montana. Res. Paper INT-409.
- Carter, R. E., and K. Klinka. 1992. Variation in shade tolerance
of Douglas fir, western hemlock, and western redcedar in coastal
British Columbia." For. Ecol. Management 55:87-105.
- Chadzon, R. L. 1988. Sunflecks and their importance to understory
plants. Advanced Ecological Research 18:1-63.
- Chan, S., and J. D. Walstad. 1987. Correlations between
overtopping vegetation and development of Douglas-fir saplings
in the Oregon Coast Range. Western Journal of Applied Forestry
2:117-119.
- Chan, S. S., M. Bailey, D. Karnes, R. Metzger, and W. Kastner.
1997. Riparian Silviculture in the Oregon Coast Range; A partnership
between management and research, pp 190-198. USDA Forest Service,
Northeastern Forest and Range Experiment Station, General Tech
Report GTR 238.
- Chen, H. Y. H., and K. Klinka. 1997. Light availability
and photosynthesis of Pseudotsuga menziesii seedlings grown
in the open and in the forest understory. Tree Physiol. 17:23-29.
- Chen, J. M., K. Klinka, and G. J. Kayahara. 1996. Effects
of light on growth, crown architecture, and specific leaf area
for naturally established Pinus contorta and Pseudotsuga menziesii
var. glauca saplings. Can. J. For. Res. 26:1149-1157.
- Coates, D. K., and P. J. Burton. 1997. A gap-based approach
for development of silvicultural systems to address ecosystem
management objectives. For. Ecol. Manage 99:337-354.
- Coates, D. K., C. D. Canham, M. Beaudet, D. L. Sachs, and
C. Messier. 2003. Use of a spatially explicit individual-tree
model (SORTIE/BC) to explore the implications of patchiness
in structurally complex forests. For. Ecol. Manage 186:297-310.
- Cole, E. C., and M. Newton. 1987. Fifth-year responses of
Douglas-fir to crowding and nonconiferous competition. Can.
J. For. Res. 17:181-186.
- Comeau, P. 2000. Measuring light in forests. British Columbia
Ministry of Forests Extension Notes.
- Curtis, R. O. 1982. A simple index of stand density for
Douglas-fir. Forest Science 28:92-94.
- Curtis, R. O. 1998. Selective Cutting in Douglas-fir. Journal
of Forestry 96:40-46.
- Curtis, R. O., D. S. DeBell, C. A. Harrington, D. P. Lavender,
J. B. St.Clair, J. C. Tappeiner, and J. D. Walstad. 1998. Silviculture
for multiple objectives in the Douglas-fir Region. USDA Forest
Service, Gen. Tech. Rep. PNW-GTR-435.
- Deisenhofer, F. U. 2000. Influence of light on the growth
of advance regeneration in the understory of Douglas-fir dominated
forests in western Oregon. Masters. Oregon State University,
Corvallis.
- Drever, C. R., and K. P. Lertzman. 2001. Light growth responses
of coastal Douglas-fir and western redcedar saplings under
different regimes of soil moisture and nutrients. Can. J. For.
Res. 31:2124-2133.
- Drever, C. R., and K. P. Lertzman. 2003. Effects of a wide
gradient of retained tree structure on understory light in
coastal Douglas-fir forests. Can. J. For. Res. 33:137-146.
- Duchesneau, R., I. Lesage, C. Messier, and H. Morin. 2001.
Effects of light and intraspecific competition on growth and
crown morphology of two size classes of understory balsam fir
saplings. For. Ecol. Manage 140:215-225.
- Emmingham, B., S. Chan, D. Mikowski, P. Owston, and B. Bishaw.
2000. Silviculture practices for riparian forests in the Oregon
Coast Range. Oregon State University, College of Forestry,
Forest Research Laboratory, Corvallis, OR.
- Emmingham, W. H. 2002. Status of uneven-aged management
in the Pacific Northwest, USA. Forestry: An International Journal
of Forest Research 75:433-436.
- Foster, J. R., and S. E. Shaff. 2003. Forest colonization
of puget lowland grasslands at Fort Lewis, Washington. Northwest
Science 77:283-296.
- Franklin, J. F., D. R. Berg, D. A. Thornburgh, and J. C.
Tappeiner. 1997. Alternative silvicultural approaches to timber
harvesting. Pages 111-140 in J. F. Franklin, editor. Creating
a forest for the 21st century: the science of ecosystem management.
Island Press, Washington, D.C.
- Frazer, G. W., C. D. Canham, and K. P. Lertzman. 1999. Gap
Light Analyser (GLA), Version 2.0: Imaging software to extract
canopy structure and gap light light transmission indices from
true-colour fisheye photographs Copyright 1999. Inf. Rep. BC-X-373,
Simon Fraser University, Burnaby, British Columbia and the
Institute of Ecosystem Studies, Millbrook, New York.
- Frazer, G. W., J. A. Trofymow, and K. P. Lertzman. 1997.
A method for estimating canopy openess, effective leaf area
index, and photosynthetically active photon flux density using
hemipherical photography and computerized image analysis techniques.
Inf. Rep. BC-X-373, Canadian Forest Service, Pacific Forest
Center.
- Gersonde, R. F. 2003. Developing a hybrid growth model for
multiaged Sierra Nevada mixed-conifer forests. PhD Dissertation.
University of California, Berkeley, Berkeley.
- Givnish, T. J. 1988. Adaptation to Sun and Shade: A whole-plant
perspective. Aust. J. Plant Physiology 15:63-92.
- Gordon, J. C. 1994. From vision to policy: a role for foresters.
J. Forestry 92 .16 - 19.
- Harrington, C. A., K. R. Buermeyer, L. C. Brodie, and B.
W. Wender. 2003. Factors influencing growth and flowering of
understory plants in conifer stands in western Washington.
in Proceeedings from the wood compatibility initiative workshop,
N 17.
- Hasenauer, H., and G. Kindermann. 2002. Methods for assessing
regeneration establishment and height growth in uneven-aged
mixed species stands. Forestry 75:385-394.
- Helms, J. A., and Standiford. 1985. Predicting release of
advanced reproduction of mixed conifer species in California
following overstory removal. Forest Science 31:3-15.
- Henderson, J. A., D. H. Peter, R. D. Lesher, and D. C. Shaw.
1989. Forest plant associations of the Olympic National Forest.
USDA Forest Service, Pacific Northwest Region R6 ECOL Technical
Paper 001-99.
- Herman, R. K., and D. P. Lavender. 1990. Psuedostsuga Menziesii
(Mirb.) Franco. Pages 527-540 in Silvics of North America.
USDA Forest Service Agric. Handbook 654, Washington, D.C.
- Howard, G., and M. Newton. 1984. Overtopping by successional
Coast Range vegetation slows Douglas-fir seedlings. Journal
of Forestry 82:178-180.
- Hunter, M. G. 2001. Communiqué No. 3: Management
in young forests. Cascade Center for Ecosystem Management,
Corvallis, Oregon.
- Issac, L. A. 1956. Place of partial cutting in old-growth
stands of the Douglas-fir region. USDA Forest Service, Res.
Pap. PNW-16:48p.
- Issac, L. A., and E. J. Dimock 1958. Silvicultural Characterisitcs
of Doulgas-fir. USDA Pacific Northwest Forest and Range Experiment
Station Silvical Series N0. 9.
- Ketchum, S. J. 1994. Douglas-fir, grand fir and plant community
regeneration in three silvicultural systems in Western Oregon.
Masters thesis. Oregon State University, Corvallis, OR.
- King, J. E. 1966. Site index curves for Douglas-fir in the
Pacific Northwest. No. 8, Weyerhaeuser Forestry Paper, Weyerhaeuser
Forestry Research Center, Centralia, WA.
- Kneeshaw, D. D., H. Williams, E. Nikinmaa, and C. Messier.
2002. Patterns of above- and below-ground response of understory
conifer release 6 years after partial cutting. Can. J. For.
Res. 32:255-265.
- Kobe, R. K., and D. K. Coates. 1997. Models of saping mortality
as a function of growth to characterize interspecific variation
in shade tolerance of eight tree species of northwestern British
Columbia. Can. J. For. Res. 27:227-236.
- Kohm, K. A., and J. F. Franklin. 1997. Creating a forest
for the 21st century: the science of ecosystem management.
Island Press, Washington D.C.
- Kollenberg, C. L., and K. L. O'Hara. 1999. Leaf area and
tree increment dynamics of even-aged and multiaged lodge pole
pine stands in Montana. Can. J. For. Res. 29:687-695.
- Lieffers, V. J., C. Messier, K. J. Stadt, F. Gendron, and
P. Comeau. 1999. Predicting and managing light in the understory
of boreal forests. Can. J. For. Res. 29:796-811.
- Long, J. N. 1985. A practical approach to density management.
Forestry Chronicle 61:23-27.
- Long, J. N. 1995. Using stand density index to regulate
stocking in uneven-aged stands. in K. L. O'Hara, editor. Uneven-aged
Management: Opportunities, Constraints, and Methodologies.
Montana Forest and Conservation Experiement Station, Missoula,
Montana.
- Long, J. N., and T. W. Daniel. 1990. Assessment of growing
stock in uneven-aged stands. Western Journal of Applied Forestry
5:93-96.
- Mailly, D., and K. P. Kimmins. 1997. Growth of Pseudotsuga
menziesii and Tsuga heterophylla along a light gradient:resource
allocation and morpholigcal acclimation. Canadian Journal of
Botany 75:1424-1435.
- Malcolm, D. C., W. L. Mason, and G. C. Clarke. 2001. The
transformation of conifer forests in Britain: regeneration,
gap size and silvicultural systems,. Forest Ecology and Management
151:7-23.
- Maquire, D. A., and A. Kanaskie. 2002. The ratio of live
crown length to sapwood area as a measure of crown sparseness.
Forest Science 48:93-100.
- Marshall, J. D. 1986. Drought and shade tolerance interact
to cause fine root mortality in Douglas-fir seedlings. Plant
Soil 91:51-60.
- McCaughey, W. W., and D. E. Ferguson. 1988. Response of
advanced regeneration to release in the inland mountain west:
a summary. USDA Forest Service, Gen. Tech. Rep. INT-GTR 243:255-266.
- Messier, C., R. Doucet, J.-C. Ruel, Y. Claveau, C. Kelly,
and M. J. Lechowicz. 1999. Functional ecology of advance regeneration
in relation to light in boreal forests. Can. J. For. Res. 29:812-823.
- Miller, M., and B. Emmingham. 2001. Can selection thinning
convert even-age douglas-fir stands to uneven-age structures?
Western Journal of Applied Forestry 16:35-43.
- Monserud, R. A., and A. P. Robinson. 2003. How adaptable
are forest growth models for simulating alternative silvicultures
in the Northwest. in Proceeedings from the wood compatibility
initiative workshop, N 17. USDA, Forest Service, Pacific Northwest
Research Station.
- Munger, T. T. 1950. A look at selective cutting in Douglas-fir.
Journal of Forestry 48:97-99.
- Mustard, J., and G. Harper. 1998. A summary of the available
information on the height to diameter ratio. Forest Dynamics
Research, Research Branch, B.C. Ministry of Forests, Victoria,
B.C.
- Newton, M., and P. Comeau. 1990. Control of competing vegetation.
Pages 256-265 in D. Winston, editor. Regenerating British Columbia's
Forests. U.B.C. Press, Vancouver, B.C.
- O'Hara, K. L. 1996. Dynamics and stocking-level relationships
of multi-aged Pondersoa Pine Stands. Forest Science, Monograph
33 42:1-34.
- O'Hara, K. L., and N. I. Valappil. 1999. Masam - a flexible
stand density management model for meeting diverse structural
objectives in multi-aged stands. For. Ecol. Manage 118:57-71.
- Oliver, C. D. 1995. Uneven-age Stand Dynamics. in K. L.
O'Hara, editor. Uneven-aged Management: Opportunities, Constraints,
and Methodologies. Montana Forest and Conservation Experiement
Station, Missoula, Montana.
- Oliver, C. D., and B. C. Larson. 1996. Forest stand dynamics.
John Wiley & Sons, Inc., New York.
- Oliver, W. W. 1985. Growth of California red fir advance
regeneration after overstory removal and thinning. USDA Forest
Service, Research Paper PSW-RP-180:1-6.
- Page, L. M., A. D. Cameron, and G. C. Clarke. 2001. Influence
of overstorey basal area on density and growth of advanced
regeneration in Sitka spruce in variably thinned stands. For.
Ecol. Manage 151:25-35.
Perdue, V. 1997. Land use and the Fort Lewis prairies. Pages 17-28. in K. Ewing, editor. Ecology and Conservation of the South Puget Sound Prairie Landscape. The Nature Conservancy, Seattle, WA.
- Ralston, R., J. Buongiorno, S. Benedict, and F. J. 2003.
Westpro: A computer program for simulating uneven-aged Douglas-fir
stand growth and yield in the Pacific Northwest. USDA Forest
Service, General Tech Report PNW-GTR-574.
- Reineke, L. H. 1933. Perfecting a stand-density index for
even-aged forests. J. Agric. Res. 46:627-639.
Ruel, J.-C., C. Messier, R. Doucet, Y. Claveau, and P. Comeau. 2000. Morphological indicators of growth response of coniferous advance regeneration to overstory removal in the boreal forest. The Forestry Chronicle 76:633-642.
- Seidel, K. W. 1983a. Growth of suppressed grand fir and
shasta red fir in central Oregon after release and thinning
10-year results. USDA Forest Service, Research Note PNW-RN-404.
- Seidel, K. W. 1983b. Regeneration in mixed conifer and Douglas-fir
shelterwood cuttings in the cascades range of Washington. USDA
Forest Service, Research Paper PNW-RP-314.
- Smith, D. M., B. C. Larson, M. J. Kelty, and P. M. S. Ashton.
1997. The Practice of Silviculture, 9th edition. John Wiley & Sons.
- SPSS, I. 2003. SPSS for Windows, version 12.0 ed. SPSS,
Inc. Chicago, Ill.
- St.Clair, J. B., and R. A. Sniezko. 1999. Genetic variation
in response to shade in Coastal Douglas-fir. Can. J. For. Res.
29:1751-1763.
- Tappeiner, J. C., W. H. Emmingham, and H. D. E. 2002. Silviculture
in the Oregon Coast Range forests. Pages 172-190 in G. E. Wells,
editor. Forest and Stream Management in the Oregon Coast Range.
Oregon State University Press, Corvallis, OR.
- Tappeiner, J. C., D. P. Lavender, J. D. Walstad, R. O. Curtis,
and D. S. DeBell. 1997. Silvicultural systems and regeneration
methods:current practices and new alternatives. in J. F. Franklin,
editor. Creating a forest for the 21st century: the science
of ecosystem management. Island Press, Washington, D.C.
- Tesch, S. D., and E. J. Korpela. 1993. Douglas-fir and white
fir advance regeneration for renewal of mixed-conifer forests.
Can. J. For. Res. 23:1427-1437.
- Van Pelt, R., and J. F. Franklin. 1999. Response of understory
trees to experimental gaps in old-growth Douglas-fir forests.
Ecological Applications 9:504-512.
- Wagner, R. G., and S. R. Radosevich. 1991. Neighborhood
predictors of interspecfic competition in young Douglas-fir
plantations. Can. J. For. Res. 21:821-828.
- Wagner, R. G., and S. R. Radosevich. 1998. Neighborhood
approach for quantifying interspecific compeition in coastal
Oregon forests. Ecological Applications 8(3):779-794.
- Wampler, M. 1994. Growth of Douglas-fir under partial overstory
retention. M.S. thesis. University of Washington, Seattle,
WA.
- Wang, G. G., H. Qian, and K. Klinka. 1994. Growth of Thuja
plicataI seedlings along a light gradient. Canadian Journal
of Botany 72:1749-1757.
- Waring, R. H. 1983. Estimating forest growth and efficiency
in relation to canopy leaf area. Advanced Ecological Research
13:325-354.
- Williams, H., C. Messier, and D. D. Kneeshaw. 1999. Effects
of light availability and sapling size on the growth and crown
morphology of understory Douglas-fir and lodgepole pine. Can.
J. For. Res. 29:222-231.
Wilson, J. S., and C. D. Oliver. 2000. Stability and density management in Douglas-fir plantations. Can. J. For. Res. 30:910-920.
- Wonn, H. T., and K. L. O'Hara. 2001. Height:diameter ratios
and stability relationships for four northern Rocky Mountain
tree species. Western Journal of Applied Forestry 16:87-94.
- Wright, E. F., D. D. Canham, and K. D. Coates. 2000. Effects
of suppression and release on sapling growth for 11 tree species
of northern, interior British Columbia. Can. J. For. Res. 30:1571-1580.
- Wright, E. F., Coates,K.D., Canham,D.D.,Bartemucci,P. 1998.
Species variability in growth response to light across climatic
regions in northwestern British Columbia. Can. J. For. Res.
28:871-886.
- Zar, J. H. 1999. Biostatiscal Analysis, 4th ed. edition.
Simon & Schuster, Upper Saddle River, NJ.
Appendices
Appendix A
Crown metrics and criteria used to estimate crown density rating.
The last 3 years of growth was examined and averaged together.
Trees were rated based on which category they met the most number
of criteria for.
Rating |
Branch length (cm) |
Branch thickness (mm) |
# of Internodal buds and branches |
# of Whorls |
1 |
<=10 |
<=1.5 |
<=4 |
4-Mar |
2 |
15-Nov |
1.6-2.5 |
10-May |
4-Mar |
3 |
15-24 |
2.6-3.5 |
10-May |
5 |
4 |
25-34 |
3.6-4.5 |
15-Nov |
6-May |
5 |
35+ |
4.6+ |
16+ |
6-May |
Appendix B
Diagram of crown overlap method of measuring crown crowding from intra-cohort competition and tall shrubs.
Appendix C
Scatterplot and fitted regression line for maximum site potential height (Ht) to volume growth curve. Data is from 19 naturally regenerated, open grown “best” trees growing near the study sites on the same soil type. Each data point represents the annual volume growth increment for a single height of a tree. Multiple data points for each of the 19 trees are included.
Annual volume growth increment (cm3/yr) = 0 .018(Ht)2 - 0.27(Ht)
- 466.74
(R2= 0.96, p<0.0001)
Appendix D
Relative volume growth regression without crown density rating. Live crown ratio drops out of the model.
Predicted RVG = 1.721 - 0.367 ln(HD Ratio) + 0.005 HG(cm) - 0.0001
Ht(m)
(R2= 0.86, SE=0.064, p<0.0001, all coefficients are significant
p<0.001)
Appendix E
Examples of hemispherical photos of 4 vigor classes. Percent
full sun is percent of total solar radiation calculated from
hemispherical photographs.
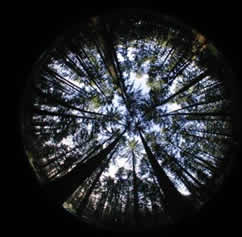 |
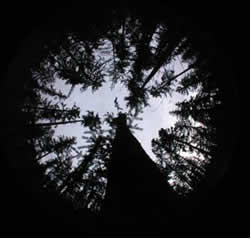 |
Vigor Class 1: 12% Full Sun |
Vigor Class 2: 25% Full Sun |
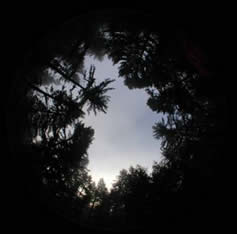 |
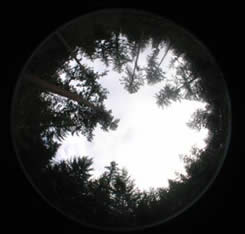 |
Vigor Class 3: 43% Full Sun |
Vigor Class 4: 67% Full Sun |
Appendix F
Sample diagram of plot layouts for Kalipso stand. Number above and to left of point shows Tpa of understory crop trees and percent below and to left of points is average relative volume growth of the understory crop trees.