Section III: Safety
Basis of Concern
|
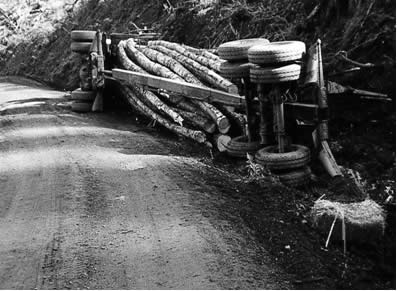
Figure 3.1. Overturned log truck (Associated Oregon Loggers). |
In 2007, the State Legislature requested that scientists from the University of Washington and Washington State University undertake an investigation of the Washington log truck industry towards gaining better understanding of “the costs to safely provide log hauling services.” No such study has previously been conducted in Washington. Log hauling has a history of being a hazardous profession. During the 40-year period from 1950 to 1989, 1246 log truck drivers (average 31 per year) were killed on the job (Milham 1997). Since that time, deregulation of the trucking industry, rising fuel prices, declining wood markets, shortages of skilled drivers, increases in traffic congestion and other ensuing circumstances have added new operational pressures that could logically have safety implications for this historically dangerous industry. The Legislature has correctly identified the safe operation of log trucks as a timely matter for public concern. Safe and sustainable log hauling services are needed to support a significant Washington forest industry and to protect the traveling public.
Motor vehicle accidents create a huge financial impact on society, dramatically affect quality of life, and are the leading cause of unintentional deaths in the United States (NSC 2005). In 2000, the total cost of motor vehicle crashes was estimated by the National Highway Traffic Safety Administration (NHSTA) to be $230.6 billion (NHTSA 2006). NHTSA reported that tractor-trailer trucks are only 3% of registered vehicles in the United States but are involved in 10% of all fatal vehicle crashes (NHTSA 2004). Collisions in Washington involving all heavy trucks increased by 15% from 2004 to 2006. Truck-related injuries increased by 7% and collision fatalities by 40% during the same period (WSDOT 2007).
Every year approximately one million loads of logs are hauled by log trucks on Washington’s roadways. The cumulative annual distance of travel is approximately 140 million miles often under adverse road and weather conditions. For reference, 140 million miles is 0.4 percent of the total annual vehicle miles traveled (Total 2007 VMT = approximately 32 billion miles) in Washington (WSDOT 2008). Log trucks travel over private, county, state and federal road systems on dirt, gravel, and pavement. In 2007, log trucks were involved in 116 accidents in Washington (WSDOT 2008, WSP 2008).
In the previous section of this report, the costs of operations for a log truck under different service arrangements were established for 2006 and 2008. Worthy of note is the 20 percent increase in operations costs from 2006 to 2008 largely caused by increases in fuel prices. This significant change indicates that costs of operations are volatile and, when compared with survey information on trucker revenues, suggests that revenues for some companies are probably not keeping pace. A survey of motor carrier insurers, conducted by the Federal Motor Carrier Safety Administration, revealed a consensus amongst insurance providers that the most financially stable trucking companies are also the safest companies (FMCSA 2008). Rapidly increasing cost of operations have been noted as a cause of instability and heightened safety hazard in the trucking industry with the least profitable and smallest companies most vulnerable (GAO 1991). Analysis of log truck registration data from the WA Department of Licensing indicated that, in 2006, 68 percent of registrations were from small independent operators (WSDOL). Independent operators with a single log truck represented 64 percent of survey respondent companies.
 Current Safety Status of the Log Truck Industry
In this section, we examine safety information and report analysis of data collected from state agencies, transportation safety literature, interviews with truckers, and industry survey results. Remarkably, a key finding of our analysis of accident and fatality data from the WA Department of Labor and Industries (L&I), WA Department of Transportation (WSDOT), and the WA State Patrol (WSP) was that even as accident rates have increased for all heavy trucks in Washington, 15% from 2006 to 2008, the log truck subset of this larger traffic sector showed no similar trend.
|
Figure 3.2. Washington log truck accidents 2002 – 2007. |
Analysis of all log truck traffic accidents in Washington from 2002 through 2007, as displayed in Figure 3.2 above, shows no particular trend for either side of the Cascade Mountains. These data were complied by the WSP and the WSDOT based upon accident reports collected at the scene by responding officers. Included are all accidents, regardless of fault or vehicle state of origin that involved log trucks during the stated years. Over the six year period, a total of 772 accidents with an average of 129 accidents per year were found.
Further examination of log truck collision data was conducted to see if any trends could be found relative to issues of concern such as fatigue, defective equipment, and injury severity collisions. Results are shown in Figures 3.3 and 3.4 below. Injuries reported included all occupants of collision-involved vehicles. There was no apparent increase in accidents resulting from defective equipment or fatigue; in fact, the last three years have been substantially under the previous three years. No trends indicating increases in injury severity collision were found to be present. Log truck accidents in Washington averaged approximately 0.1% of all vehicular accidents and 0.5% of all fatal accidents from 2002 to 2006. Large trucks typically are expected to have significantly higher rates of crash fatalities than automobiles due to size, weight, configuration and braking capability. Yet, this does not appear to be the case for log truck accidents in Washington. In 2006, log truck traffic accounted for 0.4% of total vehicle miles traveled (VMT) in Washington. From 2002 through 2007, there was only one confirmed case of log truck driver intoxication resulting in an accident.
|
Figure 3.3. Defective equipment and fatigue; causes of log truck accidents 2002-2007. |
|
Figure 3.4. Fatality and injury collisions involving log trucks 2002 – 2007. |
Further investigation of the safety performance of the log truck industry focused on analysis of work-related injuries and fatalities as reported to the Washington Department of Labor and Industries (L&I). This data is limited to only those drivers that are employed by Washington companies (L&I Risk Code 5003). The Fatalities Assessment and Control Evaluation Program (FACE) provides statistics on work-related fatalities that can be searched by occupation type. Figure 3.5 shows the analysis of log trucker fatalities differentiated as involving truck operation or not involving truck operation (example: driver hit by log) as reported to L&I for years 1998 through 2007. No trend of increased safety risk was found.
|
Figure 3.5. Log trucker fatalities as reported to L&I for years 1998 - 2007 |
An analysis was conducted using data provided by L&I for all Risk Code 5003 injury claims for the years 1998 through 2005. During this period, a total of 1947 claims were filed by log truck drivers seeking worker compensation. Injuries resulted from a spectrum of industrial accident types of which a minority, 228 (12%), was identified as associated with vehicle operation (L&I 2007).
|
Figure 3.6. Log truck driver L&I claims per 100 FTE 1997 - 2005. |
A graph of total claims per year per 100 full time employee equivalents (FTE) is shown in Figure 3.6. Again, no trend of increases in L&I accident claims was found.
This multi segmented analysis of available accident statistics revealed no evidence that economic pressures have resulted in increased log truck accident incidence. Historical annual accident data for years prior to 1997, needed to develop long-term trend analysis, were not found to be available. However, Milham (1997) reported total log hauling fatalities for the 40-year period of 1950 through 1989. The average for this period was 31 fatalities per year. While the number of truckers working during those years or the miles traveled isn’t known, we can take comparative inference based upon annual timber harvest. The average state timber harvest volume for years 1950 through 1989 was 5.8 billion board feet per year. The average harvest volume for recent years (2002–2005) was 3.8 billion board feet per year or 66 percent of the 1950 to 1989 average annual harvest volume. All crash fatalities of log truckers, other collision-involved drivers and passengers plus L&I claimed fatalities not resulting from vehicle accidents for years 2002 to 2005 averaged 4 per year or 19 percent of the 1950 to 1989 average annual fatalities. This initial comparison, albeit crude due to data limitations, suggests that log hauling would appear to be a much safer occupation today than it was in years past. Interviews with log truck drivers and insurance providers, conducted during this investigation, also indicated that the log hauling industry has not experienced any recent increase in safety hazard.
Issues for Concern
Log truckers were asked if economic stresses resulting from increases to operational expenses outpacing gains in revenues would result in deferred truck maintenance that could compromise operational safety. Most truckers replied that operation of defective equipment would put their person and livelihood in unacceptable jeopardy. Evidence presented above leads to a conclusion that current economic challenges to state log hauling operations have not, as yet, resulted in increases in accident frequency. However, other issues could challenge future safe operation..
Fatigue and Hours of Service
Fatigue is difficult to assess as a contributing factor in truck crashes. Police reports often include a space to indicate a fatigued or asleep driver, but the reported data may be incomplete because the evidence is often circumstantial (Massie et al. 1997). Sleep deprivation impairs a person's ability to perform a variety of tasks, including those related to driving and operating equipment. Drowsiness slows reaction time, decreases awareness, and impairs judgment (Balkin et al. 2000, Van Dongen et al. 2003). Often a truck driver's fatigue is caused by inadequate daily sleep, rather than a complete absence of sleep. A truck driver's extended hours of operation can create a scenario of continuous sleep deprivation by limiting a driver's daily sleep time. Research has shown that less than seven hours of sleep each night has been found to consistently lower truck driver performance (NTSB 1995, Arnold et al. 1997, Balkin et al. 2000). Orris et al. (2005) published a research synthesis of the Transportation Research Board (TRB) publications that concluded that sleep deficits, night driving, reduced sleep, and fatigue are associated with dangerous driving, reduced performance, and falling asleep while driving. Driver impairment from fatigue is known to be a contributing factor in many commercial vehicle crashes (Advocates for Highway and Auto Safety, NIOSH 2003).
A large body of transportation research has shown that extended hours of service are linked to increased traffic hazards. Harris and Mackie (1972) found significant changes in truck driver performance after ten hours of driving. Drivers were physically less aware of external stimuli and more likely to create errors the longer that they kept driving. Jones and Stein (1987) found that relative risk for drivers who had been behind the wheel for more than eight hours was almost twice that of drivers with fewer hours. Lin et al. (1993) showed that the likelihood of a truck crash increased significantly after the fourth hour of driving and kept on increasing as driving hours were further extended. Campbell (2002) found that the relative risk of fatigue gradually increases during the first eight hours of operation. During the ninth hour the fatigue risk was nearly double and by the twelfth hour the risk was higher by a factor of six.
Driver hours-of-service (HOS) regulations to limit the length of time that a commercial drivers can continuously operate a truck were first implemented in the United States in 1939 and remained largely unchanged until 1962. Through the years since there have been several adjustments to HOS rules and approaches to enforcement. In 2005, the U.S. Department of Transportation’s Federal Motor Carrier Safety Administration (FMCSA) issued the latest update to federal HOS rules. The new rules prohibit truckers from driving more than eleven hours in a row, working longer than 14 hours in a shift and driving more than 60 hours over a seven-day period or 70 hours over an eight-day period. In addition, the new rules require truckers to rest for at least ten hours between shifts and provide a 34-hour period to recover from cumulative fatigue (FMCSA 2005). FMCSA (2003) has estimated that 100% adherence to HOS regulations would result in $1 billion in annual avoided costs due to reductions in crashes.
Fatigue and hours of service literature specific to operation of a log truck was not found. It is important to note, therefore, that the research summary, presented above, chronicles results taken primarily from studies of the long-haul heavy trucking industry and that log trucking is different in some critical respects as the hauls are shorter and driving breaks for loading and unloading occur at scattered intervals throughout the work day. However, survey results from log truck company owners, confirmed by log trucker interviews, clearly indicate that many log truck drivers work long hours and could be subject to fatigue (average 69 working hours per week).
Table 3.1. Log truck survey question 15: “How many hours per day per truck do you and/or your drivers normally work?”
(n= 128)
| |
Average |
Median |
Min |
Max |
| Hours/truck/day |
12.2 |
12 |
7 |
16 |
Table 3.2. Log truck survey question 16: “How many days per week per truck do you and/or your drivers normally work?
(n = 128)
| |
Average |
Median |
Min |
Max |
| Days/week/truck |
5.1 |
5 |
3.6 |
7 |
Table 3.3. Log truck survey question 17: “How many hours per week are normally required for maintenance of your log truck?”
(n = 126)
| |
Average |
Median |
Min |
Max |
| Hours/week/truck |
6.8 |
6 |
2 |
24 |
Table 3.4. Log truck survey question 14: “How many loads per day per truck do you and/or your drivers normally haul?”
(n = 126)
| |
Average |
Median |
Min |
Max |
| Loads/day/truck |
2.9 |
3 |
1 |
5 |
Table 3.5. Log truck survey question 13: “What is your average one-way haul distance?”
(n = 122)
| |
Average |
Median |
Min |
Max |
| One-way miles |
67.4 |
60 |
20 |
200 |
Unlike long-haul drivers, log truckers deliver multiple loads per day (Table 3.4). Analysis of national safety data for commercial truck operation indicates that short-haul drivers are less likely than long-haul drivers to be involved in fatigue-related truck crashes (FMCSA 2005). The average one-way distance per log load was reported by survey respondents as 67.4 miles (see Table 3.5 above). It is apparent from survey analysis and interviews that the number of daily hours worked by log truckers is more a function of how many loads must be delivered than how many hours the driver may prefer to work. For the average haul distance, cost of operation estimates showed that three loads per day are required to be delivered to generate marginally sufficient gross revenues to cover operation costs (Section II; Tables 2.41 and 2.42). Since many log truckers begin and end their work days at home and the average round-trip delivery time appears to be approximately four hours, adjustments to daily hours worked could, therefore, only occur in four-hour increments, the time for the last load. With this limitation in mind and after review of survey and cost estimate analysis, we conclude that for most independent log truck operators, extended hours of operation appear to be required to generate sufficient revenues to remain in business. Extended hours of operation and chronic fatigue could become a cause for safety concern especially as drivers age.
Age
An aging workforce has become a common contemporary challenge for many industries. In Washington, 16% of commercial truck drivers are over 55 years of age (Lockhart and Wallace 2006). The log trucking industry appears have an even higher percentage of older drivers. Fifty-two percent of log truck survey respondents reported being 55 years of age or older.
Table 3.6. Log truck survey respondent age distribution.
(n = 128)
| |
Average |
Median |
Min |
Max |
| Age in years |
54.4 |
55 |
32 |
82 |
Age has been shown to be correlated with driver collision rates. A study of all national vehicle accident rates by age of driver showed that risk of collisions declines with age until 60 and then increases as drivers get older (NHTSA 1993). Another major U.S. study that was focused specifically on commercial carriers found that the youngest (21-39) and least experienced group of drivers were more likely by a factor of 1.6 to have accident involvement than the oldest (50+) and most experienced group of drivers (GAO 1991). Younger truck drivers are known to be more at risk because older drivers take less chances and have more experience (Venkataraman et al 1996, Chirachavala and Cleveland 1985). Numerous studies indicate that young drivers acquire driving skills quickly, but they require maturity and experience to develop the perceptual and cognitive skills needed to recognize hazards and respond appropriately (Deery 1999, Jonah 1986). Also related to immaturity is the tendency for younger drivers to overestimate their own driving skills (Gregersen 1996). Older drivers, by comparison, have developed skills to recognize and avoid hazards but they may not anticipate and react to hazards quickly enough (Holland and Rabbitt 1994). Reduced reaction times (both physical and cognitive), reduced ability to divide attention between tasks, and increased difficulty in handling complex and unfamiliar situations are associated with the normal aging process and are widely recognized and well-documented in the scientific literature (Brouwer et al. 1991, Holland and Rabbitt 1994, Stelmach and Nahom 1992). Normal aging results in declining visual acuity from reduced field of vision, less effective peripheral vision, and reduced ability to cope with glare from oncoming headlights (FHWA 2001). Night driving poses particular risks for older drivers. Night vision depends on seeing contrasts between objects, not on visual acuity alone, and this sensitivity to contrasts decreases with age (Burnham and Abrams 1998).
As we have shown with analysis of accident statistics, the log truck subsector has a better safety performance record than the broader population of Washington commercial carriers. The results of this comparison may be associated with differences in age distributions. Sixty-three percent of log truck survey respondents were between the ages of 40 and 60 years old. Age-to-collision-hazard analyses indicate that drivers of this age group are the most skilled and safest heavy truck operators. However, studies (Holland and Rabbitt 1994, NHTSA 1993) have shown that after age 60, safety performance of drivers may decline. An aging workforce, combined with the demands of extended HOS, could compromise the long-term safety performance of the log truck industry.
Driver recruitment
It has been well documented that the trucking industry has experienced a shortage of qualified drivers with fewer young people choosing commercial driving as a career (Global Insight 2005). An FMCSA report estimates a current national shortfall of 20,000 commercial drivers and forecasts a national shortage of 110,000 drivers by 2014 (Corsi 2005). Log truck survey respondents also reported a scarcity of skilled drivers (Section II; Tables 2.9 and 2.10). Consequently, there is strong competition amongst trucking sectors and companies for drivers. In recent years, a significant factor aggravating the shortage of qualified drivers has been job-hopping or “churning.” High rates of driver turnover may account for as much as 80 percent of the demand for commercial operators (FMCSA 2008). Competition for skilled operators is uniquely challenging for companies looking for log truck drivers; new drivers are hard to find and established drivers are hard to keep. Added costs of recruitment, training, wages, and benefits can be significant. Job-hopping has also been linked to higher safety hazard. A comparison of the Commercial Drivers License program database with the Motor Carrier Management Information System (MCMIS) database quantified the relationship between job change rate and crash experience. Commercial drivers that change jobs often were found to have a higher crash-involvement rate than drivers with stable employment history (FMCSA 2008).
|
Figure 3.7. Trucking sectors compete for drivers (Mason)
|
Out-of-state log trucks
An aging workforce combined with limited opportunities for new driver recruitment may be contributing factors to industry decline. We found from analysis of WSDOL data that the number of log trucks registered in WA declined by 14 percent from 2002 to 2006 while, for those trucks continuing operation, there was a 12 percent shift to combination registration under schedule B so that goods other than logs can be sometimes hauled. Out-of-state trucks are making up for a growing in-state log truck infrastructure shortfall. Data for Idaho log trucks operating in Washington are not collected by the Idaho Department of Transportation, however, a significant number of Idaho trucks are known to be operating in northeastern Washington (Williamson pers com.). An examination of records from the Oregon Department of Transportation indicated that, in 2006, 1,593 Oregon log trucks were registered to operate in Washington as compared to 1,325 log trucks registered in Washington (both schedule A and B) revealing that 20 percent more Oregon than Washington log trucks were registered for Washington operation (ODOT 2007). Perez-Garcia (2007) prepared a report for the Washington Transportation Center (TRAC) and WSDOT that presented results of an investigation into current and future forest products use of Washington roadways. This study forecasted an increase in log truck traffic of approximately 150,000 loads per year (15 percent) by 2020. The safety and economic implications of a growing shortfall in Washington log truck infrastructure accompanied by increases in out-of-state log trucks operating in Washington are not known but should be worthy of further study.
Roadways
Washington has the ninth largest population growth of U.S. states increasing at a rate of 1.8 percent per year (WSOFM 2007). Annual vehicle miles traveled (VMT) on Washington roads have increased at a significantly greater rate than population (Figure 3.8). From 1981 to 2007, population increased by 53 percent from 4.23 million to 6.49 million people (WSOFM 2007). During the same period, VMT per year increased by 98 percent from 16.16 billion to 31.97 billion miles (WSDOT 2008). Average VMT per person per year have increased by 29 percent. From 1981 to 2007, total road-miles in Washington (principal, minor, collector, and interstate) increased 2 percent from 6,885 to 7,044 miles (WSDOT 2008). Quantified by VMT per road-mile, there is conceivably a 93 percent increase in traffic and associated congestion on Washington’s roadways. Increases in traffic congestion have both safety and economic implications for Washington log truck operators. Survey respondents reported that 83 percent of their travel occurred on paved roadways.
|
Figure 3.8. Increases to WA population and annual VMT (WSDOT 2008, WSOFM 2007). |
Two questions, included the Washington log truck survey, were asked about the dangers of activities associated with log hauling. Survey respondents were asked to identify, in their own words, the most dangerous part of driving a log truck. Responses were classified by type and are presented below in Table 3.7. Respondents overwhelmingly indicated that traffic and road conditions (89 percent) are considered to be the most dangerous parts of their jobs. Only 11 percent of drivers felt that the loading and unloading of logs presented the greatest danger.
Table 3.7. Log truck survey question 65a: “What do you feel is the most dangerous part of your job as a log truck driver?”
(n = 122)
| |
Traffic |
Roads |
Load/Unload |
Age/Fatigue |
Weather |
Equipment |
Other |
| Number |
84 |
25 |
13 |
11 |
4 |
4 |
6 |
| % of n |
69% |
20% |
11% |
9% |
3% |
3% |
5% |
This topic was developed further by asking respondents to consider comparatively the relative hazard of various elements of log hauling. Results presented below in Figure 3.9 show agreement with Table 3.6. Roadways are considered to be riskier places than landings with travel on state and interstate highways considered as the greatest safety challenge faced by log haulers. This finding corresponds with the VMT trend presented above.
|
Figure 3.9. Log Truck Survey Question 65b: “On a scale of 1 to 5 with 1 as safe and 5 as very dangerous please rate the following job situations relative to possible accident hazard.” (n = 126) |
An examination of statistics of all Washington accidents from 1993 to 2005 revealed that 61 percent of traffic fatalities occurred on rural roads, while 39 percent occurred on urban roads. By road type, 38 percent of deaths occurred on state or federal highways, 31 percent on county roads, 18 percent on city streets, and 11 percent on interstates (WSP 2007). These data might appear as contradiction to survey findings about state and interstate highways. However, our analysis of the subset of state accidents from 2002 to 2007, limited to only those accidents that involved log trucks, shows agreement with the respondent perspective (WSDOT, WSP 2008).
|
Figure 3.10. WA log truck accidents by roadway type 2002-2007 |
Further justification of log trucker concern about highway danger can be found in WSP statistics that show, in 2004, 75 percent of all fatal collisions involving commercial motor vehicles were caused by the passenger vehicle not the truck (WSP 2007). There is abundant agreement in transportation literature that most accidents involving commercial carriers are caused by passenger vehicles (Hanowski et al. 2007, Wang et al. 1999, Blower 1998). In 2005, to help address this situation, the WSP started the Ticket Aggressive Cars and Trucks (TACT) project that involved trooper placement in commercial carriers to spot and ticket passenger vehicles violating safe driving rules in truck traffic. As another part of this program, in 2005, the WSP Commercial Vehicle Division conducted 126,644 Commercial Vehicle Safety Alliance (CVSA) inspections. Inspections are conducted to help reduce collisions involving equipment failure (WSP 2007). In addition, the WSP and the Washington Trucking Associations (WTA) jointly sponsor a voluntary truck inspection program each year. Seventy-five percent of survey respondents reported participation in the voluntary inspection program with 50 percent reporting that voluntary inspections reduced time lost for roadside equipment checks. A letter from the WSP recognizing the safety contribution of the voluntary inspection program is included in Appendix F. Respondents report an average of 21.3 stops per year for weight and equipment inspections with each stop lasting an average of 25 minutes.
Table 3.8. Stopping distances for cars versus trucks; estimates are for 80,000 lb. loaded tractor-trailers traveling on a dry, level road. (Oregon Trucking Association).
Speed |
Reaction/Braking Distance Cars |
Reaction/Braking Distance Trucks |
Stopping Distance Cars |
Stopping Distance Trucks |
40 mph |
44' / 80' |
44' / 125' |
124' |
169' |
55 mph |
60' / 165' |
60' / 275' |
225' |
335' |
65 mph |
71' / 245' |
71' / 454' |
316' |
525' |
Another element of the TACT project is education. Stuster (1999) concluded that the most common factor in truck versus passenger vehicle crashes was the passenger vehicle driver’s lack of knowledge and awareness about the performance capabilities of large trucks. Specifically, drivers may be unaware of truck limitations in acceleration, braking, and visibility. At highway speeds heavy trucks require significantly greater stopping distances than passenger vehicles (Table 3.8). Stopping distances become greater on wet pavement.
Increases in traffic on major roadways elevate safety risk and add to costs of log truck operations. Added costs include greater accident risk, higher insurance rates, delayed deliveries, and increases in fuel consumption. The log truck survey respondents are well aware of changing traffic conditions as evidenced by responses shown in Table 3.9 where 99 percent of respondents report that traffic conditions are getting worse.
Table 3.9. Log truck survey question 40: “How would compare the traffic on Washington paved roads today as compared to 10 years ago?”
(n = 129)
| |
Much worse |
Somewhat worse |
The same |
A little better |
A lot better |
| Number |
96 |
32 |
1 |
0 |
0 |
| % of n |
74% |
25% |
1% |
0% |
0% |
A summary of traffic accidents involving logging trucks in 1971 was published by the WSP (1972) and, when compared with current conditions reported by WSP, provides an example of how things have changed. In 1971, drivers of logging trucks were cited for 63 percent of collision-related violations. In 2004, drivers of trucks accounted for 25 percent of collision-related violations (WSP 2007).
Survey respondents were also asked about their perceptions of road quality change over the last ten years. Road quality has a direct relationship not only to safety but also to fuel consumption and equipment maintenance costs. Results are presented in Tables 3.10 and 3.11 below. Survey respondents report deterioration of both paved and gravel roads.
Table 3.10. Log truck survey question 39: “How would you compare the quality of Washington paved roads today as compared to 10 years ago?”
(n = 118)
| |
Much worse |
Somewhat worse |
The same |
A little better |
A lot better |
| Number |
35 |
54 |
29 |
11 |
0 |
| % of n |
30% |
46% |
25% |
9% |
0% |
Table 3.11. Log truck survey question 41: “How would you compare the quality of Washington gravel roads today as compared to 10 years ago?”
(n = 116)
| |
Much worse |
Somewhat worse |
The same |
A little better |
A lot better |
| Number |
42 |
34 |
40 |
10 |
1 |
| % of n |
36% |
29% |
34% |
9% |
1% |
Equipment options to reduce costs and increase safety
The age and condition of equipment operated by log hauling companies have influence on company productivity and operating costs. As evidenced by WSP investment in roadside equipment inspections of commercial carriers, the condition of heavy trucks is an important matter of safety concern. Commission of this log trucking study confirms that the State Legislature also has interest in this topic. Due to the size, weight, configuration and braking capability of large commercial trucks, proper equipment condition is fundamental to minimized vehicle collision hazard. If we accept safety performance as a surrogate indicator for sufficiency of equipment maintenance then, based upon comparison of accident rate trends, it appears that Washington log trucks may be better maintained than other commercial carriers. Further support for this hypothesis is found in comparison of driver demographics. Log haulers are by percentage older and more experienced than the broader commercial carrier population. Fifty-two percent are 55 years of age or older. This does not mean, however, that there is not room for pursuit of further safety improvements.
Log truck survey respondents were asked about their preferences for equipment investment Results are presented in Tables 3.12 showing a pretty even split between those that purchase new and used equipment. We further asked, “What factors most influence the decision to purchase new verses used equipment?” Purchasers of used equipment were motivated almost exclusively by costs and availability of quality used trucks. Purchasers of new trucks overwhelmingly cited the benefits of warranty and dependability (62 percent) as being the prime motivation for a new truck purchase. Other benefits that respondents associated with new truck purchases included tax benefits, comfort, safety, reduced TARE weight (TARE refers to truck-empty weight), greater fuel efficiency, and more horsepower.
Table 3.12. Log truck survey question 50: “When replacing a truck tractor do you generally purchase…?
(n = 124)
| |
A new truck |
A used truck |
Sometimes new or used |
A kit (rebuild) |
| Number |
44 |
53 |
22 |
5 |
| % of n |
35% |
43% |
18% |
4% |
An analysis of truck ages, maintenance, and revenues was performed using survey response data. A total of 305 log trucks were reported to be operated by 129 respondent companies in the survey. Of this number, the ages of 256 trucks were identified and linked for analysis to company performance reports. The distribution of truck ages and comparative benefits of new trucks were revealed (Figures 3.11 through 3.14). Figure 3.11 displays a generally even distribution on either side of the 1991 to 2000 ten-year age class. However, 85 percent of trucks were found to be greater than ten years old (≤ 1998) indicating a generally aging fleet.
|
Figure 3.11. Surveyed log truck model year distribution |
Newer trucks were reported to require less maintenance, earn greater revenues, and provide greater net income (Tables 3.12 – 3.14). While there are many human factors associated with truck productivity, it does appear that newer equipment operated by survey respondents is correlated with greater profitability. But, are newer trucks safer? We do not have data to assess the relative roadway safety performance of log trucks by age. While the age, condition and value of equipment are determinants in truck insurance premiums (a surrogate for safety performance) the age of the truck is often irrelevant as condition is dependent upon upkeep as well as recently installed equipment (Cover Me Insurance Agency Inc). We can, however, say with some certainty that newer trucks are safer in one regard, namely that newer trucks are equipped with equipment required by the EPA to reduce pollution (EPA 2004).
|
Figure 3.12. Hours of maintenance verses truck age |
|
Figure 3.13. Annual gross revenue verses truck age |
|
Figure 3.14. Annual trucker income verses truck age. |
Federal emission standards have been evolving for highway diesel engines since the passage of the Clean Air Act in the early 1970s. The first regulations focused on control of exhaust of smoke. Subsequent regulations broadened emission control requirements to include gaseous and particulate pollutants. The 1990 amendments to the Clean Air Act directed EPA to set stringent standards for emissions for all heavy-duty highway engines. In 2000, 2002, and 2007, diesel engine manufacturers responded with incremental changes to pollution control systems that targeted reductions in nitrogen oxides (NOx), non-methane hydrocarbons (NMHC), particulate matter (PM), and carbon monoxide (CO). Figure 3.15 shows dramatic improvements in pollution reduction equipment for diesel engines with 2002 and 2004 as key upgrade years. Reductions in other exhaust pollutants such as sulfur oxides (SOx), benzene, butadiene, formaldehyde, acetaldehyde, acrolein, and dioxins have also been achieved (EPA 2004, 2002, 2000).
|
Figure 3.15. Historical Trend in Emissions from New Diesel Engines (USDOE 2006). |
Combustion of diesel fuels releases green house gases associated with global warming; accounting for 20 percent of all transportation sector emissions (Waterman-Hoey and Nothstein 2007). Asthma attacks, respiratory diseases, heart attacks, and other health declines are serious public problems that have been linked to emissions from diesel engines (WSDOE 2006, Clean Air Task Force 2005, EPA 2002). Fine particulate matter (PM2.5; 2.5 micrometers in diameter and smaller) is known to be harmful to human health (EPA 2008). A study of health impacts linked to diesel exhaust fine particle exposure estimated that, in 1999, 248 people died in Washington from associated heart and lung ailments (Clean Air Task Force 2005). For comparison, there were 63 large truck collision fatalities in Washington 1999 (FARS 2008). Particularly at risk from exposure to diesel pollution are truck drivers. (Laden et al. 2007, Steenland et al. 1998, Zaebst et al. 1991).
Diesel emissions represent a serious public safety hazard for which there is significant room for improvement, yet investment trails opportunity. Heavy trucks that are 2007 and newer are equipped with exhaust systems that allow very low emissions of fine particulates and other pollutants. As shown in Figure 3.15, this is not the case for older trucks. Since diesel engines can provide a million miles or more of service it could take decades to significantly reduce the adverse effects of diesel exhaust in Washington (WSDOE 2006). The Washington Department of Ecology (WSDOE) has identified heavy trucks as the most significant state source of on-road diesel PM (78 percent) and is seeking funding to underwrite private sector costs of retrofits to reduce fuel consumption and pollution. WSDOE cites a public benefit of three to sixteen dollars from every dollar invested in reducing diesel pollution (WSDOE). Retrofit of diesel particulate filters (DPFs) that are designed to cut soot emissions by 90 percent can be accomplished for trucks 1990 and newer. However, cost of retrofit is estimated at $7,000 to $10,000 per truck (Fox et al. 2006). Struggling trucking companies, such as log haulers, will not be able to afford such investment. Accommodation of pollution reduction expenditures was not included in our cost of operations estimates. The federal government has a program that may assist truck owners with retrofit costs (EPA). A regional public/private partnership called Cascade Sierra Solutions is pursuing similar goals. California, in May of 2008, appropriated $200 million for grants to trucking companies purchasing pollution reducing equipment (CEPA 2008). Public investments to support equipment upgrades that reduce pollution could help trucking companies and provide significant public benefit.
|
Figure 3.16. Heavy duty truck engines (all brands) sold in western Washington and Alaska from 1994 through 2007 (NC Power Systems Co.; NC Machinery Inc.) |
The purchasing behavior of new heavy duty diesel engine buyers was discussed in interviews with NC Power Systems Truck Engine Business Manager, Wayne Hofer and Rick Ham, Cummins Northwest, LLC. An unintended consequence of pollution reduction policies was suggested. Equipment sellers report that sales of diesel engines tend to peak in years prior to new release of pollution compliant equipment. Figure 3.16 above shows truck engine purchase trends in western Washington and Alaska. A report prepared for FMCSA found similar buyer patterns as truck purchasers rushed to replace equipment in years prior to addition of expensive pollution reduction equipment (Fox et al. 2006). Diesel engine particulate filters, diesel oxygenation catalysts, and other emissions control equipment add $7,000 to $10,000 to the price of a new truck (Fox et al. 2006). In addition to cost, purchasers are concerned also about prototype malfunctions, maintenance costs, and reduced fuel economy as well as added weight of equipment (Fox et al. 2006, Gilroy 2006, Hall pers. com.). An opportunity exists for policy makers to hasten investment in pollution reduction by underwriting equipment costs through low cost loans, tax incentives, clean air grants, and other assistance programs (CEPA 2008).
Equipment upgrades to heavy trucks for reduced pollution are not limited to exhaust systems. Achievement of reductions in fuel consumption automatically results in avoided emissions and can provide economic relief to trucking companies. Decades ago the military developed central tire inflation (CTI) systems to allow a driver to automatically and uniformly vary the inflation pressure of a tires while the vehicle is moving. Truck tires perform better on different surfaces when inflation is adjusted. With a CTI system, truck tire pressure can be lowered on gravel roads and raised for pavement. Tire pressure can be adjusted for appropriate deflection as operation needs change from empty to loaded, high to low speed, and good to poor traction. The economic and environmental benefits of CTI systems have been documented. Lower inflation pressure results in larger tire footprints that can result in lower costs for road construction and maintenance of logging roads (Sturos et al. 1995). Reduced pressure on drive tires has been shown to allow logging trucks to ascend steep grades that would otherwise only be negotiable with an assist vehicle (Bulley and Blair 2001). Operation of log truck tires at lowered pressure on gravel roads under wet conditions can reduce sediment run-off that adversely affects salmon streams (Schiess pers. com., Foltz and Elliot). Larger tire imprints on gravel roads dampen drive-train shocks, decrease maintenance costs, and increase tire life and driver comfort (Sturos et al. 1995).
On pavement, under-inflated tires negatively impact a driver’s ability to control against skidding, blowouts, and other tire failures. When tires are under-inflated, the tread wears more quickly and fuel consumption increases with rolling resistance. Goodyear estimates a 15 percent reduction in tire-miles for every 20 percent of under-inflation. Under-inflated tires cause sidewall stress and overheat more quickly than properly inflated tires resulting in tire damage and blow outs (Obringer). On wet surfaces, under-inflation increases stopping distance and likelihood of collision (NHTSA 2000). Ten pounds per square inch (psi) of drop in tire pressure will increase rolling resistance by two percent and fuel consumption by up to one percent (Ang-Olson and Schroeer). Over-inflation of tires is equally undesirable as it results in reduced tread life. Central tire inflation systems offer increased safety, longer tire service, and reduced fuel consumption. Federal recognition of the importance of proper tire inflation to safe operation of a motor vehicle is evidenced by the Transportation Recall Enhancement Accountability Documentation (TREAD) Act of 2000 that requires all passenger cars and light trucks produced in 2008 to be equipped with tire pressure monitoring systems. Unlike pollution control retrofits which are limited to 1990 and newer trucks CTI systems can be installed on any age of equipment. A number of different CTI systems are commercially available. Retrofit of CTI systems costs approximately $900 per truck (EPA 2005).
To move a truck at 65 miles per hour (mph) along a level highway, an average diesel engine produces 220 horsepower (hp). Approximately 70 hp (30 percent) is required to overcome the drag caused by rolling resistance in the tires (Ogburn and Ramroth). Reduction of rolling resistance through proper tire inflation results in fuel savings. Further benefit may be available through use of wide-base tires. Wide-base tires (“super-singles) have been developed by many tire companies to replace duals on driver and trailer axles. Super-singles are up to 17.5 inches wide and are compliant with pavement weight laws in all 50 states (EPA 2002). When fitted with aluminum rims and wide-based tires, trucks can reduce TARE weight by 200 pounds per axle. Fuel saving have been estimated at four to six percent over typical dual tires (Ogburn and Ramroth). Because these tires are not mounted in pairs, drivers may be concerned that a tire failure could leave them immobilized. Manufacturers dispute this claim when super-singles are used on trucks with tandem axles (EPA 2002). Retro fit to replace duals with single-wides is estimated to cost $3000 per truck (EPA 2005).
CTI systems and single-wide tires could reduce fuel consumption and pollution; increasing public safety while providing financial relief for trucks if costs could be underwritten by public funding support. Both systems are recognized as effective green house reduction strategies by the EPA Smart Way program, the California Air Resource Board, and Cascade Sierra Solutions. CTI systems and single-wide tires offer low-cost opportunity for retrofit to reduce fuel consumption and pollution on older commercial carriers.
Safety Summary
A thorough examination of the safety record of the log hauling industry in Washington has been conducted leading to conclusion that log truck operation is safer today than in years past. The accident record for log trucks compares favorably with the broader population of all commercial carriers.
Pollution health impacts and associated need for emissions equipment upgrades were introduced as emerging public/private costs of safe log truck operation. Annual fatalities linked to diesel pollution (Clean Air Task Force 2005) illustrate the seriousness of this safety issue. While great strides in emissions reduction equipment development have been made by manufacturers, equipment upgrades are way behind potential suggesting further research is needed to inform effective response (Fox et al. 2006).
While the current safety record of the Washington log trucking industry has been shown to be encouraging, a number of disturbing concerns that could challenge future safety performance were identified. The issues of rising cost of operations, extended hours of service, an aging workforce, poor driver recruitment, increasingly congested roadways, and the influx of out-of-state trucks will need periodic review to monitor impacts.
|
Figure 3.17. Voluntary Safety Inspection; Log Truckers Conference of the Washington Trucking Associations (Mason) |
|