The
first step in creating a management template is to identify
a forest structure associated with the management goals.
In southern pine forests, an open, park-like structure with
a rich, herbaceous understory is likely to support high levels
of biodiversity on appropriate sites. This type of structure
is characteristic of the fire-maintained longleaf pine forests
that covered much of the South in pre-settlement times. Only
a fraction of these forests remain, and they are recognized
for the high levels of biodiversity they support (Bragg 2002,
Noss 1988).
A reference dataset was used to quantify this structure.
The dataset was collected at International Paper’s Southlands
Experimental Forest in southwest Georgia for a study by Hedman
et al. (2000) that identified a set of “benchmark” stands
that were characteristic of historic, open longleaf pine forests
(Figure 1). Four key stand attributes described the structure
represented in the dataset: the density and diameter of the
large trees and the density and diameter of the small trees.
When considered together, these attributes provide a quantitative
target that can be used as an objective measure of whether
or not the desired forest structure is achieved. Stands whose
attributes are within this target have a structure that is
statistically similar to the desired structure as quantified
by the reference dataset.
Nine management alternatives (Table
1) were established
representing a range of practices for improving the likelihood
of achieving
the desired structure for increased biodiversity (see RTI
Fact Sheet 37 for a review of these practices). The first
alternative
was a 25-year chip and saw rotation, and the other eight
were 35, 40, or 55-year sawtimber rotations. Each alternative
included
a commercial thinning at age 15 that was assumed to remove
30% by volume. The sawtimber alternatives included subsequent
commercial thinnings beginning at age 25. These thinnings
were done from below to a residual basal area (BA) of either
60
or 80 ft2/acre. The thinnings were repeated at either 10
or 15-year intervals until the final clear-cut harvest.


Each management alternative was projected over
100 years (rotations were repeated as necessary) using the
Landscape Management System (LMS). LMS is one of RTI’s
core technologies that
brings together growth, treatment, and visualization models
under a single, user-friendly interface that offers integrated
analysis capabilities for a variety of ecological and product
outputs. Projections were done in LMS using the Southern
Variant of the Forest Vegetation Simulator (FVS, SN) growth
model. A 10-year-old loblolly pine plantation from the Hedman
et al. dataset that was representative of typical conditions
for a young, intensively managed plantation was used as the
base inventory to test each alternative.
 |
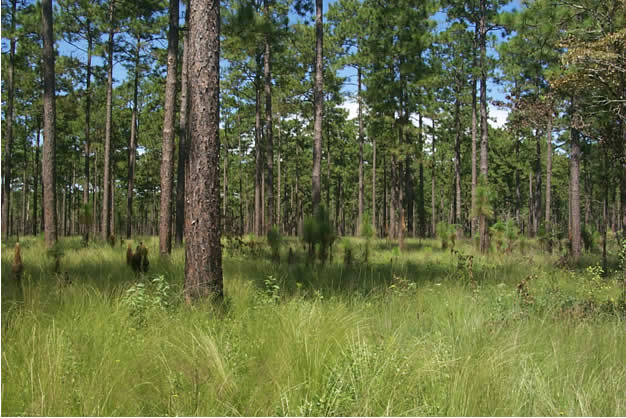
| Figure 1: A "benchmark" stand
measured by Hedman et al. (2000). The open, park-like
structure
of
this uneven-aged longleaf pine stand supports a rich,
herbaceous understory that provides habitat for a variety
of species. Photograph taken by Craig Hedman. |
| Table 1: Nine potential template alternatives were
established based on practices likely to achieve the
desired structure. |
When simulating
the thinning treatments for each alternative, a component
of desirable, mast- producing hardwoods (black
cherry, hickory, and various oaks) were maintained to
enhance wildlife habitat. It was also assumed that prescribed
burning would be done at 5-year intervals beginning at
age 20. While this was not directly represented in the
simulations, the impacts were indirectly represented
by not including the natural hardwood ingrowth that would
be expected after heavy thinning treatments but instead
assuming that such ingrowth would be killed or suppressed
by burning. |
Alternative |
Rotation
Length |
Thinning
Target (ft2 BA) |
Thinning
Interval |
1
|
25
|
NA
|
NA
|
2
|
35
|
60
|
10
|
3
|
35
|
80
|
10
|
4
|
40
|
60
|
15
|
5
|
40
|
80
|
15
|
6
|
55
|
60
|
10
|
7
|
55
|
80
|
10
|
8
|
55
|
60
|
15
|
9
|
55
|
80
|
15
|
|
For
each alternative, the projected stand structure over 100
years was compared to the target to assess how often the
desired structure was achieved. The soil expectation value
(SEV), which is the net return to bare land assuming perpetual
management, was also computed for each alternative. SEV is
a commonly used measure of overall economic performance that
allows direct comparisons of rotations with differing lengths.
SEV was computed using the harvest outputs from LMS and average
1st quarter 2005 stumpage prices for Georgia (Region 2) reported
by Timber Mart-South. Cost assumptions included $13.25/acre
for prescribed burning, $8/acre for annual property taxes
and overhead costs, and $215/acre for stand establishment
costs at the beginning of the rotation. SEV was computed
before taxes assuming a 5% target real rate of return.
The results for each alternative are summarized in Table
2. The 25-year chip and saw rotation (Alternative
1) was not long enough to produce the desired structure
and had
the lowest SEV. Shorter rotations are generally economically
advantageous, but historically low pulp prices ($18.40/cord)
have decreased their competitiveness relative to longer
rotations that produce higher-value products. The 35 and
40-year rotations
(Alternatives 2-5) performed the best economically but
only achieved the desired structure 24% of the time or
less. The
55-year rotations (Alternatives 6-9) achieved the desired
structure the most often and had moderate economic performance.
| Table 2: Comparison of the percentage of time that
the desired structure was achieved and economic performance
for nine template alternatives. |
Alternative |
% Time Desired
Structure Achieved |
SEV/Acre |
SEV
Cost/Acre |
Cost/% Time Desired
Structure Achieved |
1 |
0% |
($20) |
$639 |
NA |
2 |
14% |
$423 |
$196 |
$14.00 |
3 |
14% |
$480 |
$139 |
$9.93 |
4 |
24% |
$466 |
$153 |
$6.38 |
5 |
14% |
$619 |
$0 |
$0 |
6 |
48% |
$305 |
$314 |
$6.54 |
7 |
48% |
$413 |
$206 |
$4.29 |
8 |
48% |
$382 |
$237 |
$4.93 |
9 |
38% |
$415 |
$204 |
$5.37 |
From a cost-benefit standpoint, Alternative 5 achieved the
desired structure some of the time and had no economic cost,
as it achieved the highest SEV. The other alternatives each
had an opportunity cost, which was the loss in SEV relative
to what could be achieved with Alternative 5. Of these other
alternatives, Alternative 7 had the lowest cost per percent
time that the desired structure was achieved. Alternative
7 was one of three alternatives that achieved the desired
structure most often (48% of the time). In contrast, Alternative
5 achieved the desired structure least often (13% of the
time), not counting Alternative 1 which did not achieve the
desired structure at all.
Alternative 7 appears to be a good template option that
balances the management objectives of increased biodiversity
and economic
performance. It achieved the desired forest structure a
high percentage of the time, producing an open stand that
can
support a rich understory and a diversity of wildlife (Figure
2). At the same time, the economic performance was still
competitive such that it may be acceptable to landowners
or at least minimize any needed incentives. There may also
be increased opportunities for supplemental income from
hunting leases, as the resulting stand structure is good
habitat
for game species and aesthetically pleasing.
The template described above provides one example
approach for managing for biodiversity and economics in southern
loblolly pine plantations. The template incorporates some
key principles for managing for biodiversity, such as longer
rotations, early and frequent thinning, and prescribed burning.
The alternatives that were examined were not an exhaustive
list, and there are many other potential templates that could
also achieve good results. In particular, even longer rotations
may provide for more time in the target for landowners willing
to accept lower but still reasonable economic returns. Earlier,
more frequent, or heavier thinnings may achieve target conditions
sooner than the alternatives examined.
 |
| Figure 2: Projected stand development from age 10 to
55 under Alternative 7. |
The example southern
template above demonstrates that the RTI template framework
is not limited to western Washington riparian forests but
can also be successfully applied in other regions. This framework
shows promise as a proactive approach to managing forests
for multiple objectives in a way that minimizes economic
impacts, management complexity, and the potential for unintended
consequences.
A complete report of this research is available in Technical
Report D of RTI Working Paper #5.
References:
- Bragg, D.C. 2002. Reference conditions for old-growth pine
forests in upper west Gulf Coastal Plain. Journal
of the Torrey Botanical Society 29(4):261-288.
- Hedman, C.W., S.L. Grace, and S.E. King. 2000. Vegetation
composition and structure of southern coastal plain
pine forests: an ecological comparison. Forest Ecology
and Management 134:233-247.
- Noss, R.F. 1988. The longleaf pine landscape of the
Southeast: Almost gone and almost forgotten. Endangered
Species Update 5(5):1-8.
The research in this Fact Sheet was sponsored
by the National Commission on Science for Sustainable Forestry
(NCSSF). For
more information contact Kevin Zobrist, Rural Technology
Initiative, University of Washington (206) 543-0827.
|