|
 |
 |
 |


Fact Sheet #06:
Defining and Using Biologically Based Targets in Forest Management:
Incorporating Forest Structure and Variability
|
2001 Save or Print a PDF copy of Fact Sheet #06
Accounting for variability in forest ecosystems: the mean
as a representative value
Figure 1 presents four simulated 2-dimensional data sets all having a mean value of (10, 50), but having different data distributions. These data sets demonstrate that a mean value may not be representative of a particular data set, and that accounting for variability is important. Use of the mean value as a target criterion may be reasonable for the small variation case (A), but in each of the remaining cases (B-D) using only the mean value to define a target criterion could be misleading. 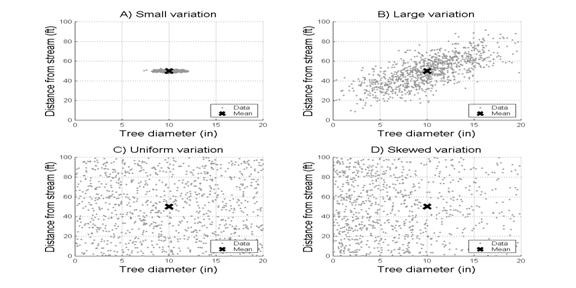
Though simulated, the data in Figure 1 are representative of conditions that may occur in forested riparian zones. The small variation case (A) could represent the migration of a stream channel to a position approximately 50 feet from a very uniform stand, for example a plantation. The large variation case (B) could represent a forest stand composed of young, small trees that have seeded in near a stream channel that is migrating away from older, larger trees that may have been adjacent to the stream at one time. The uniform variation case (C) could represent a mixed species, multi-aged stand that is just entering stand differentiation. Finally, the skewed variation case (D) could represent a forest stand after multiple disturbances, such as fire, landslide, or stream channel migration, having a large component of young, small trees that began growing after the most recent disturbance and older, larger trees that have survived one or more disturbances.
A single variable such as basal area per acre (BA) or volume per acre is frequently used to describe a forest ecosystem. This reduction of a forest ecosystem to a single descriptive variable necessitates the loss of structural information. For example, stand density and average tree size cannot be obtained from BA alone, but these two variables provide forest structure information useful for forest management. A description of forest structure is inherently multi-dimensional: each tree has a diameter, height, position, and age, and each stand has a number of trees, an average tree size, a particular species composition, and so on. A multi-dimensional forest ecosystem description will therefore more effectively capture the desired structural aspects of a forest than a single variable description.
Figure 2 presents results for two analyses of a data set obtained from the Pacific Resource Inventory, Monitoring, and Evaluation (PRIME) program database produced by the Forest Inventory and Analysis (FIA) branch of the U.S. Forest Service. The data set is derived from stand level summaries including all trees greater than one inch in diameter at breast height (DBH), located within 215 feet of a stream, and have a stand age of at least 80 years using FIA age classes. 127 riparian forest plots were obtained, with stand age classes from 80-89 years to over 300 years. The two analyses provide an example of a situation where using 2-dimensional data, trees per acre (TPA) and quadratic mean diameter (QMD), to represent a forest stand provides more information, and different assessment results, than using 1-dimensional data, BA. Both data sets are derived from the same database for the same stands. The objective of each analysis was to quantitatively assess whether a selected plot may be considered acceptable relative to a specified management target. Seven test plots, two having BA values of approximately 375.5 sq ft per acre (case A) and five having BA values of approximately 213 sq ft per acre (case B) were used with the assessment procedures in each analysis. The desired management target for both assessments was defined using the data from the 127 available riparian plots. 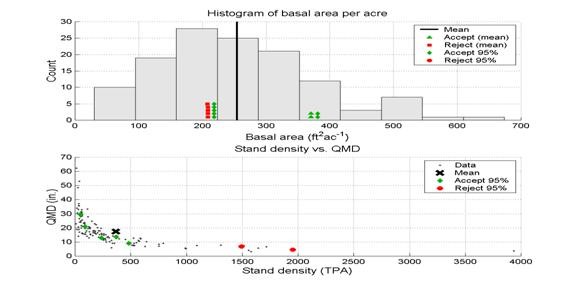
In the first analysis, the top plot in Figure 2, BA per acre is used to describe forest stands. The mean BA per acre for this data set is 254.5 sq ft per acre, and it is used to establish the minimum acceptable BA value for an assessment of the test plots. For the mean based assessment all plots having BA values greater than the mean value are considered acceptable. An alternative assessment procedure using a 95% acceptance region to better account for the variability in the BA data was also applied to the test plots. For the 95% acceptance region assessment all plots falling within the 95% acceptance region are statistically indistinguishable from the target, and are considered acceptable. The two test plots for case A were acceptable for both assessment procedures. The five test plots for case B, were not acceptable using the mean based assessment, but were acceptable using the 95% acceptance region based assessment. Note that the histogram of BA values is not symmetric, it is right skewed, and subsequently the mean is to the right of the mode (as well as the median, which is not shown). Under such circumstances a mean based rule will reject more plots than a rule that incorporates variability; most of the data are to the left of the mean value. The mean is, therefore, not a representative value for skewed distributions such as the distribution of BA.
In the second analysis, the bottom plot in Figure 2, TPA and QMD
are used to describe forest stands. TPA and QMD were used for this
example because their product is proportional to BA and collectively
QMD and TPA provide at least as much information as BA, as well
as providing important information on habitat conditions. A single
assessment procedure was applied for this 2-dimensional data set
using a 95% acceptance region defined by a straightforward extension
of the 1-dimensional procedure used for the BA analysis. Five of
the seven test plots were accepted in this scenario, one from case
A and four from case B, and two were rejected, one from each case.
The two rejected plots have very high stand densities, in excess
of 1000 TPA, and correspondingly small trees, on average, and they
are clearly far from the main data cluster. The five plots that
were accepted appear well within the main data cluster, as expected.
Note that the 2-dimensional distribution of the TPA and QMD data
is not symmetric. The distribution is curved and skewed towards
larger values for both TPA and QMD. Given this distribution shape,
the mean value for these data appears outside the envelope of the
data, and therefore is not representative of the main data cluster.
Two factors directly affecting forest management decisions are the inherent variability of forest ecosystems and the multi-dimensionality of forest structure. Through examples using simulated and actual data, the mean value has been shown to be of limited use when considered as a representative value for a distribution. A mean value may only be considered representative when the variability is small and the data distribution is symmetric. In most other situations the mean value will not be representative, and it may even be misleading. Further, the use of a single variable such as basal area per acre to represent forest structure can give potentially misleading results. Two stands may have the same basal area per acre but have different stand structures: one containing a large number of small trees and another containing a small number of large trees. If one stand condition is more desirable than the other a multi-dimensional analysis is necessary to distinguish these two conditions.
Target criteria and assessment procedures for forest management must incorporate the inherent variability of forest ecosystems and a multi-dimensional representation of forest structure to be effective. Using the mean value as the sole component of an assessment procedure fails to account for the variability of forest ecosystems, and will lead to the rejection of many stand conditions and management options that are indistinguishable from a desired forest condition, while accepting other stand conditions and management options that may produce an undesirable forest condition. Determining whether any particular management plan and projected stand condition will be indistinguishable from the desired forest condition requires a multi-dimensional analysis that incorporates stand structure information. In particular, management plans that provide for large diameter trees in numbers that are representative of the desired forest condition should be acceptable, even though they would have been rejected based upon a 1-dimensional analysis using a mean BA criterion. The use of multiple forest structure variables to describe a desired old-forest-like condition will be less restrictive, and more representative, than a 1-dimensional description while more effectively representing the desired ecological conditions and avoiding or mitigating any unintended consequences. |