 |
 |
 |
 |


|
By Santiago Mancebo and Ken Chamberlain
|
 |
Introduction:The Trimble Navigation GeoExplorer 3c is a 12-channel Global
Positioning System (GPS) receiver. This receiver was tested
by the U S Forest Service to determine performance under Western
Oregon tree canopy conditions. The unit tested was configured
without real-time differential correction capability. These
tests were made between June 06 and 22, 2000. |
1) The positional accuracy of various lengths of data logging from 1 second to 120 seconds to determine what, if any, increases in accuracy occur through the averaging of increasing numbers of positions.2) The positional accuracy of both uncorrected GeoExplorer 3c data and Post-processed differentially corrected GeoExplorer 3c data.
3) Examine the accuracy of the GeoExplorer 3c receiver using the internal and external antennas at various receiver settings of Signal-to-Noise (SNR) and Position Dilution of Precision (PDOP).
4) The efficiency of receiver performance. That is the number of positions logged during a specific period divided by the number of possible positions expressed as a percentage.
Equipment:
This test was performed with both the GeoExplorer 3c using both the manufacturer standard equipment internal antenna and GeoExplorer 3c optional external antenna. The manufactures list price for the GeoExplorer 3c (without map background) is $3,780, the GSA price is $3,495. The manufactures list price for the GeoExplorer 3 (with map background) is $4,495, the GSA price is $4,090. The external antenna is an optional item for the GeoExplorer 3c the manufacturers list price is an additional $195, the GSA price is $177 at this time.
The GeoExplorer 3c receiver version 1.02 was used for all tests.
Test Network and Survey Station Data:
Forested Site: The Clackamas Test Network is located in Western Oregon on the Mt. Hood National Forest. Clackamas GPS Test Network is a site for testing P and C/A Code (resource grade) GPS receiver performance under moderate to heavy western Oregon timber canopy. The vegetation at the site consists of Douglas Fir and Western Hemlock over story, these trees are approximately 24-40" d.b.h., with a Vine Maple and Red Alder under story. The terrain at the site is nearly flat with no terrain obstructions above 20 degrees. The test network is composed of twelve points with known geographic positions. These twelve points were established by a conventional Total Station closed traverse survey which was based on two GPS points adjacent to the site which had reasonable satellite horizon. These two points were established by static carrier phase GPS survey connected to the Oregon High Accuracy Reference Network (HARN).
Open Site: The station "Estacada" was used as a control site due to its clear-sky nature with no obstructions and know coordinates. Station "Estacada" is an Oregon High Accuracy Reference Network (HARN) Order A survey mark established by the National Geodetic Survey in 1998, PID-AI1994. The station is 48 KM, N 47 W of the Clackamas Test Network site.
Reference Station: Differential Correction Base (reference) data was downloaded from the Community Base Station (CBS) at the Portland State University Geology Department in Portland, Oregon. The Portland State University CBS uses 12 channel Trimble Maxwell chip receiver recording SYNC measurements at 5 second intervals at a 10 degree elevation mask with Trimble CBS software version 2.67. This CBS is located approximately 84 Km from the Clackamas Test Network.
Field Data Logging Procedures:
All GPS observations were made at approximate antenna height of 1.5 meters.
All GPS data was logged at 1 position / second.
All data was logged using a 15 degree elevation mask.
Clackamas site:
- Data was logged for 120 positions at each of the 12 points allowing a maximum occupation time of 10 min.
- Data was logged with the PDOP set to 100 for all tests.
- The complete network was logged at SNR 4 then repeated at SNR 5.
- The complete network was logged with internal antenna then repeated with the external antenna.
Estacada control point:
- Data was logged for 1 hour.
- Data was logged with the PDOP set to 100 for all tests.
- Data was logged at SNR 5.
- Data was logged with internal antenna then the data-logging was repeated with the external antenna.
Data post processed using the Trimble Pathfinder Office version 2.51 software package. Post-processing consisted of Differential corrections of the raw (.ssf) receiver files using the Portland State University CBS. The corrected (.cor) files were then exported in database .dbf format.
The data analysis was made using Microsoft Office 2000 Excel spreadsheet application. Excel was used to filter the PDOP. The data was filtered to create separate data sets for PDOPs 4, 6, 8, 10, 12, 15, 20 and 100 all further analysis was made using these data sets.
All accuracies report at 2DRMS (see appendix 1 for formulas). The 2DRMS value closely approximates the 95% error for a position. In other words, 1 out of 20 measurements will have errors larger than those published in this report.
Office Data Processing Procedures:
Data post processed using the Trimble Pathfinder Office version 2.51 software package. Post-processing consisted of Differential corrections of the raw (.ssf) receiver files using the Portland State University CBS. The corrected (.cor) files were then exported in database .dbf format.
The data analysis was made using Microsoft Office 2000 Excel spreadsheet application. Excel was used to filter the PDOP. The data was filtered to create separate data sets for PDOPs 4, 6, 8, 10, 12, 15, 20 and 100 all further analysis was made using these data sets.
All accuracies report at 2DRMS (see appendix 1 for formulas). The 2DRMS value closely approximates the 95% error for a position. In other words, 1 out of 20 measurements will have errors larger than those published in this report.
All data was analyzed in the North American Datum of 1983 (NAD 83).
SITE CONDITIONS:
These tests were made under generally dry conditions ranging from light rain to dry.
Guide to abbreviations used in Figures 1 - 8:
Forest: Refers data from the Clackamas Test Network.
Open: Refers to data from the station Estacada.
GeoIII - None: Refers to GeoExplorer 3 data with internal
antenna with out differential Correction.
GeoIII - Post: Refers to GeoExplorer 3 data with internal
antenna with differential corrections.
GeoIII ext - None: Refers to GeoExplorer 3 data using external
antenna with out differential Correction.
GeoIII ext - Post: Refers to GeoExplorer 3 data using external
antenna with differential corrections.
Note: The manufacturers recommended settings for the GeoExplorer 3c are a Signal to Noise (SNR) of 5 and a Position Dilution of Precision (PDOP) of 6. When the SNR gets smaller the signal is "noisier" and accuracy decreases. When the PDOP increase the satellite geometry used for determining the GPS position becomes weaker and the accuracy decreases.
TEST RESULTS:
Test1: Examine the positional accuracy of various lengths
of data logging from 1 second to 120 seconds to determine what,
if any, increases in accuracy occur through the averaging of increasing
numbers of positions.
Figure 1: The graph shows the GPS accuracy relative to length of occupation for various receiver configurations at both the Estacada and Clackamas Sites for both corrected and uncorrected data.
Test 1 Discussion:
This data reflects a running average of all positions at each location
and for each receiver configuration.
The data is in this test is an aggregate of all SNRs and PDOPs used in the sturdy. The data for the forested site (Clackamas) should therefore be used only for accuracy trends based on occupation times. The data for the open site (Estacada) may be used to examine the accuracy of external and internal antennas as well as corrections.
For open site (Estacada) there was no increase in accuracy for longer occupation times. For the forested Clackamas Test Network accuracies increased until about 50 positions were recorded after that point the increase in accuracy was gradual.
Test 1 Recommendations:Open Sites:
- Logging of the manufacturers recommended three positions is sufficient.
Forested sites:
- Logging of 50 positions of data is recommend for all configurations.
Figure 2: This graph shows the accuracy of various receiver configurations at the open site station Estacada for one second of data at various PDOP settings.
Figure 3: This graph shows the accuracy of various receiver configurations at the open site station Estacada for 50 positions of data at various PDOP settings
Figure 4: This graph shows the accuracy of various receiver configurations at the forested Clackamas Test Network for 1 second of data at various PDOP settings.
Figure 5: This graph shows the accuracy of various receiver configurations at the forested Clackamas Test Network for 50 positions of data at various PDOP settings.
Test 2 Discussion:
The removal of SA from the C/A code GPS signal prompted field users
to ask whether uncorrected data was accurate enough to be used for
GPS mapping purposes. The test results indicate that differential
corrections are still necessary.
Only the open site (Estacada) data shown on Figures 2 and 3 should considered absolute accuracy. See Figures 6 and 7 in Test 3 for absolute accuracy figures in forested sites. This data is intended only to illustrate the relative accuracy of corrected and differentially corrected positions.
PDOP and SNR were not a factor at open site (Estacada) as all data collected was at or below the manufacturers recommended settings of PDOP 6 and SNR 5.
The data in Figure 2 shows that at the open site (Estacada) while logging 1 second of corrected data that the external antenna a significantly increased relative and absolute accuracy over data logged with the internal antenna.
The data in Figure 4 shows that at the forested site (Clackamas)
when logging 1 second of differentially corrected data both the
internal and external antenna data yielded very poor accuracy. Very
little difference in accuracy was noted between corrected and uncorrected
data for this 1 second data.
The data in Figure 5 shows that at the forested site (Clackamas) when logging 50 positions of differentially corrected data for both the internal and external antennas had a significant increase in accuracy. The external antenna configuration yielded the highest relative accuracy.
Since the data in Figures 4 and 5 discussed above contains all
SNR configurations only the relative accuracy of the differential
corrections is valid, not the absolute accuracy of the corrections.
The accuracy of differentially corrected data will be more thoroughly
examined in test 3 where the data is segregated by different SNR
configurations.
Open Sites (Estacada):
- Post Processed differential corrections are recommended.
Forest sites:
- Post Processed differential corrections are recommended.
- External antenna is recommended.
Figure 6: Graph of the differentially corrected accuracy of various receiver configurations with 1 position of data using different combinations of PDOP and SNR settings at the forested Clackamas Test Network.
Figure 7: Graph of the differentially corrected accuracy of various receiver configurations with 50 positions of data using different combinations of PDOP and SNR settings at the forested Clackamas Test Network.
The data presented on Figures 6 and 7 may be examined for absolute accuracy for internal and external antennas at various configurable receiver settings.
The data on Figures 6 and 7 again illustrate the increased accuracy gained by averaging 50 positions. The magnitude of the accuracy increase was significant varying from 8 to 25 meters with the greatest increases occurring with the external antenna.
GPS users should use the accuracy and efficiency information show
on figures 6,7, and 8 to determine the receiver settings and correction
method most appropriate to the accuracy requirements of their project.
Test 4: Report on efficiency of receiver performance. That is the
number of positions logged during a specific period divided by the
number of possible positions expressed as a percentage.
- Example: The GPS receiver is set to log positions at a 1 second internal for a period of 2 minutes (120 seconds). The actual number of positions recorded is 60; therefore the efficiency is 60 positions logged / 120 positions possible = 50 %.
Figure 8: This graph presents the efficiency of various receiver configurations using different combinations of PDOP and SNR settings at the forested Clackamas Test Network
Test 4 discussion:
The data logged at SNR 4 was significantly more efficient than
at SNR 5. For example:
The data logged at the forested site (Clackamas) with SNR 5 and
PDOP 6, the manufacturers recommended settings, was only 5% efficient.
At that rate it would take over 16 minutes to logged the suggested
50 positions under the forested site conditions.
The test results shown in Figure 7 with 50 positions of data and Figure 8 indicate that the receiver settings for forested sites should be modified to SNR 4 and a PDOP of 8. This receiver setting represents a compromise between accuracy and efficiency. Using receiver settings of SNR 4 and PDOP 8 the accuracy is 18 meters with a 65% efficiency for the internal antenna. The same settings yield 14 meter accuracy with 67% efficiency with the external antenna.
Users should use the accuracy and efficiency information shown in Figures 7 and 8 to determine the receiver settings most appropriate to the accuracy requirements of their project.
Test 3 and 4 recommendations: (no Estacada open site data
this test)
Forested Sites:
- The receiver settings of SNR 4 and PDOP 8 are recommended.
- The external antenna is recommended.
Recommendations for the GeoExplorer 3c:
The following are general recommendations for using this receiver for mapping applications. The data presented in this report should be examined to determine the receiver settings, occupations length, and hardware configurations most appropriate for each project considering accuracy, efficiency and field operation requirements.
Differential correction of all data is recommended.
For open sites:
- Point features should use the manufacturers recommended three positions.
- The manufacturers recommended receiver settings of SNR 5 and PDOP 6 should be used, although they will often be exceeded due to available satellites.
- The external antenna is recommend for best accuracy.
- 2 meters 2dRMS accuracy can be achieved with these settings.
For Forested Sites:
- Point features should use at 50 positions per feature.
- The receiver settings should be modified to SNR 4 and PDOP 8.
- The external antenna should be used for best accuracy.
- 14 meter 2dRMS accuracy can be achieved with these settings.
The National Map Accuracy Standard (NMAS 1947) for point positions
on 1:24,000 Scale Quadrangle maps is 12.2 meters at 90% or to put
it in the same confidence interval as our study 14.8 meters at 95%.
Therefore this receiver when used as recommended above meets national
map accuracy standards when operating under tree canopy.
Appendix 1: Accuracy computation formulas used in this paper.
![]()
![]()
![]()
![]()
![]()
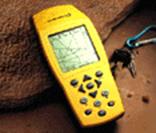
Appendix 2: Photo of GeoExplorer 3 (Photo from Trimble Navigation)

